4544
Interleaved pulse sequence for calibrated BOLD based on MRI measurement of venous oxygen saturation1Department of Radiology, University of Pennsylvania, Philadelphia, PA, United States, 2Department of Radiology, University of Navarra, Pamplona, Spain, 3Department of Neurology, University of Pennsylvania, Philadelphia, PA, United States
Synopsis
An improved interleaved pulse sequence termed “OxBOLD” is presented for calibrated fMRI. OxBOLD measures ASL-based perfusion and BOLD signal changes with whole-brain coverage, in addition to global measures of blood flow and venous oxygen saturation by concatenating background-suppressed 3D-GRASE pCASL, phase contrast, 2D-multi-slice EPI, and dual-echo GRE sequences. The OxBOLD pulse sequence is combined with the Yv-based calibration model to derive the calibration factor, M, which relates perfusion and BOLD signal changes to the cerebral metabolic rate of oxygen (CMRO2). M-maps derived from OxBOLD have similar M values averaged over grey matter as compared to the traditional Davis calibration model.
Background and Motivation
Calibrated fMRI permits quantification of changes in the cerebral metabolic rate of oxygen (CMRO2) due to a stimulus by first solving for the relationship between cerebral blood flow (CBF), oxygen metabolism, and BOLD signal changes1:
$$$\frac{\Delta BOLD}{BOLD_0}=M\left(1-\left(\frac{CMRO_2}{CMRO_2\mid_0}\right)^\beta\left(\frac{CBF}{CBF_0}\right)^{\alpha-\beta}\right)$$$ [1]
where M is the subject-specific calibration factor, representing the maximum BOLD signal change with full washout of deoxyhemoglobin ([dHb]), subscripts (0) represent the baseline condition relative to stimulus condition (no subscript), α is the Grubb constant that relates CBF to cerebral blood volume, and β is a B0-dependent constant reflecting relative intra- and extra-vascular BOLD signal contributions2.
To solve for M, a calibration experiment is conducted in which BOLD and CBF or [dHb] are measured simultaneously during an isometabolic stimulus, typically hypercapnic1 or hyperoxic3 gas breathing. In conventional hyperoxia calibrated fMRI, [dHb] ($$$\propto$$$1-Yv, where Yv is the venous oxygen saturation) changes are inferred from measures of end tidal oxygen (PETO2), however MRI lends itself to measure Yv directly through susceptometry-based oximetry4. With knowledge of Yv, and by invoking Fick’s principle, i.e. $$$CMRO_2\propto CBF\left(1-Y_v\right)$$$, [Eq. 1] can be recast as:
$$$\frac{\Delta BOLD}{BOLD_0}=M\left(1-\left(\frac{1-Y_v}{1-Y_v\mid_0}\right)^\beta\left(\frac{CBF}{CBF_0}\right)^\alpha\right)$$$ [2].
With the Yv-based calibration model, all parameters are determined from the MRI experiment (no external monitoring is required), and it provides the calibration constant M with fewer assumptions and reduced noise sensitivity compared to existing models. The sole assumption is that changes in Yv are spatially uniform from baseline to stimulus conditions. Yv in response to hypercapnia is expected to be spatially variant (since vascular reactivity is region-dependent5), thus Yv-based calibration would not be directly applicable. However hyperoxia challenge represents a suitable stimulus because small, relatively uniform flow changes are expected6,7, thereby implying uniform Yv changes.
In our prior preliminary approach to Yv-based calibration, the pulse sequence required measurement of CBF from inflow vessels rather than from ASL-based perfusion. More recently, the authors combined background-suppressed 3D-GRASE-based pCASL with multi-slice 2D-EPI, creating an optimized dual-acquisition ASL/BOLD sequence8. Here, we extend the dual-acquisition sequence to incorporate OxFlow (Yv and flow-based total CBF) measurements9,10 and compare M maps computed from the traditional Davis model during hypercapnia to those from the Yv-based model during hyperoxia.
Methods
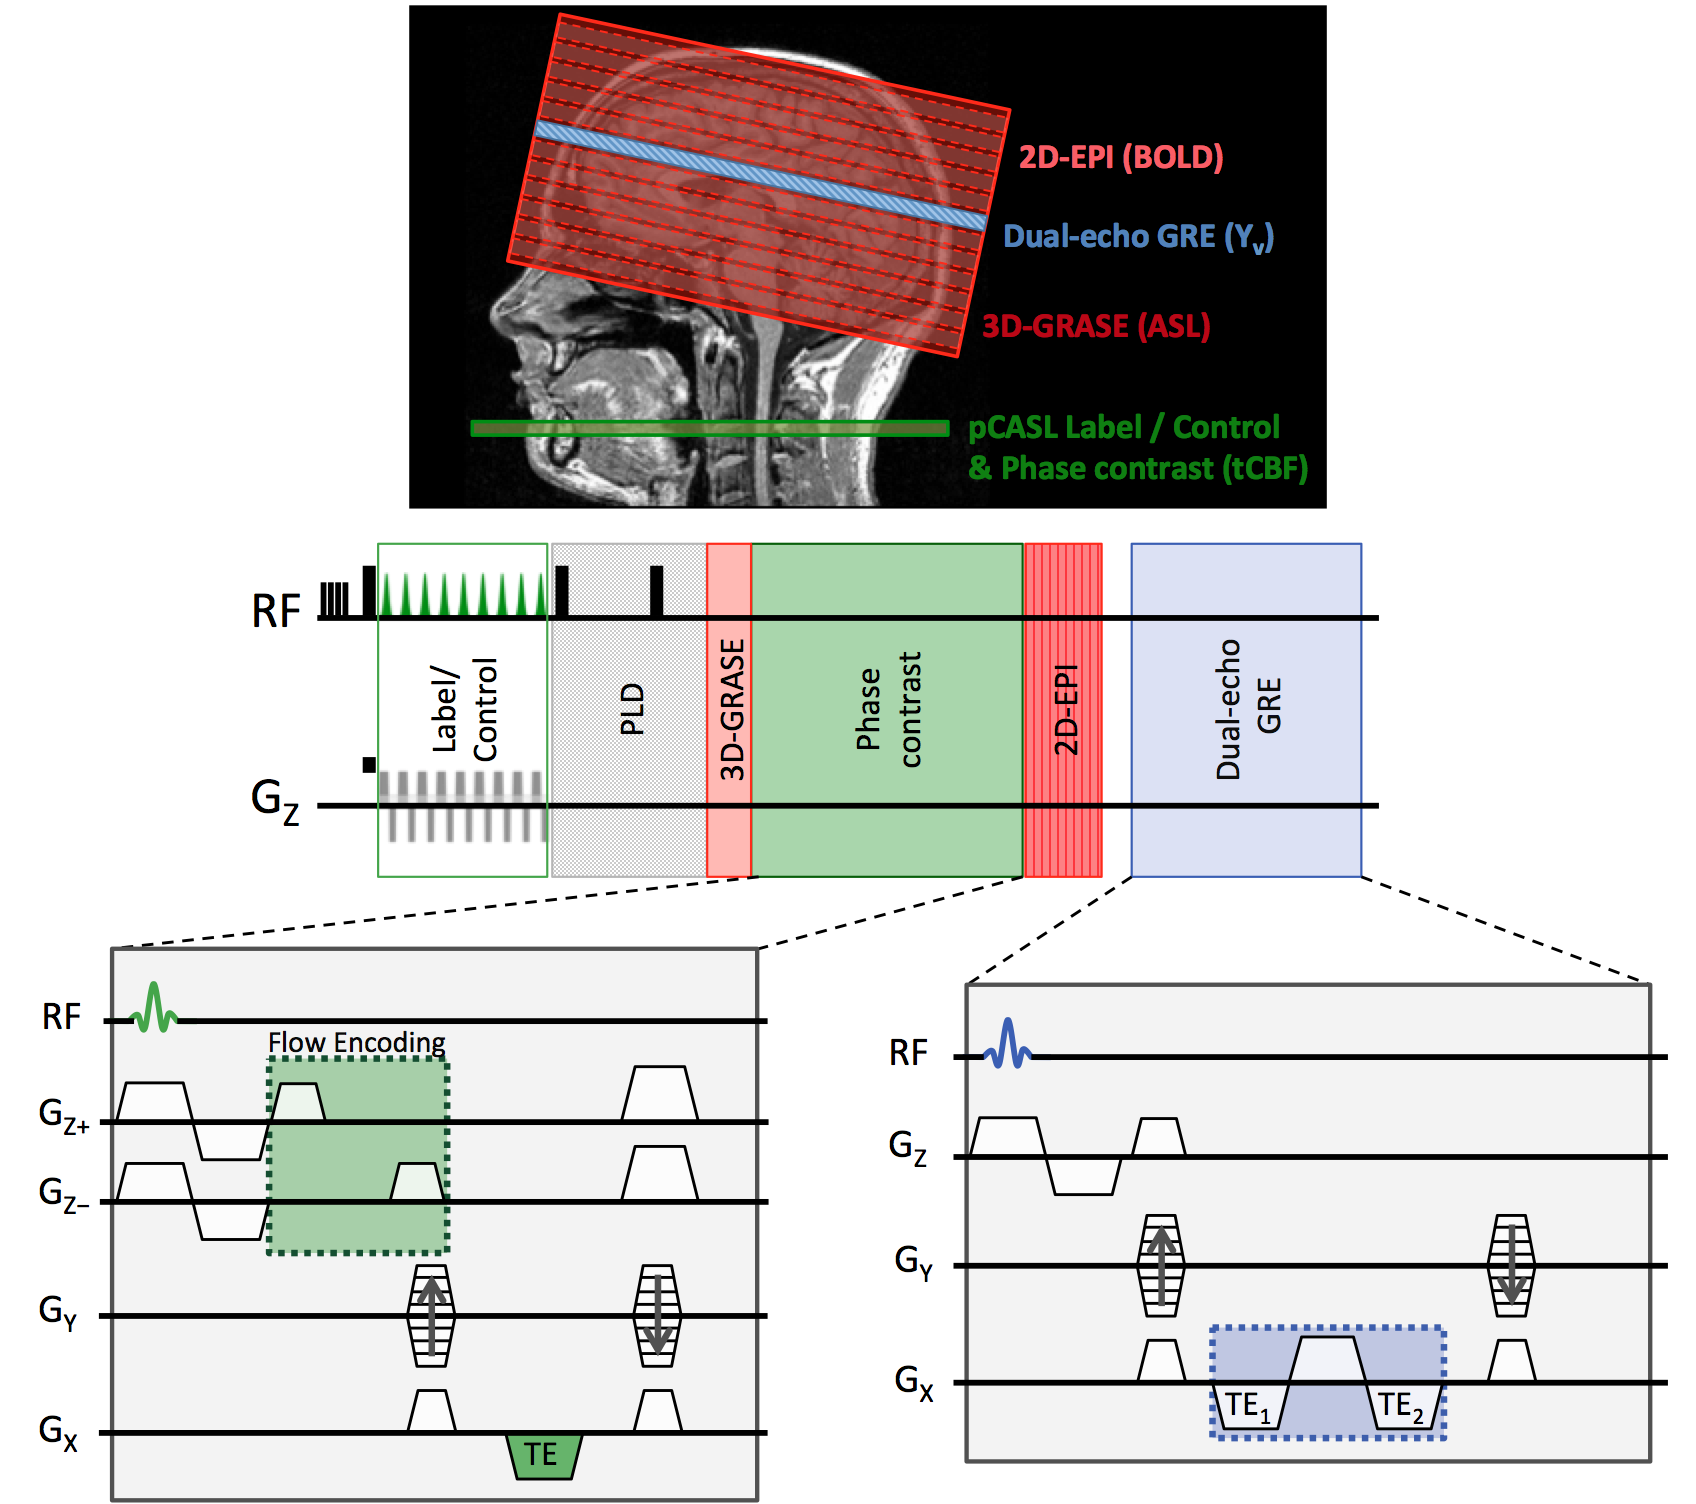
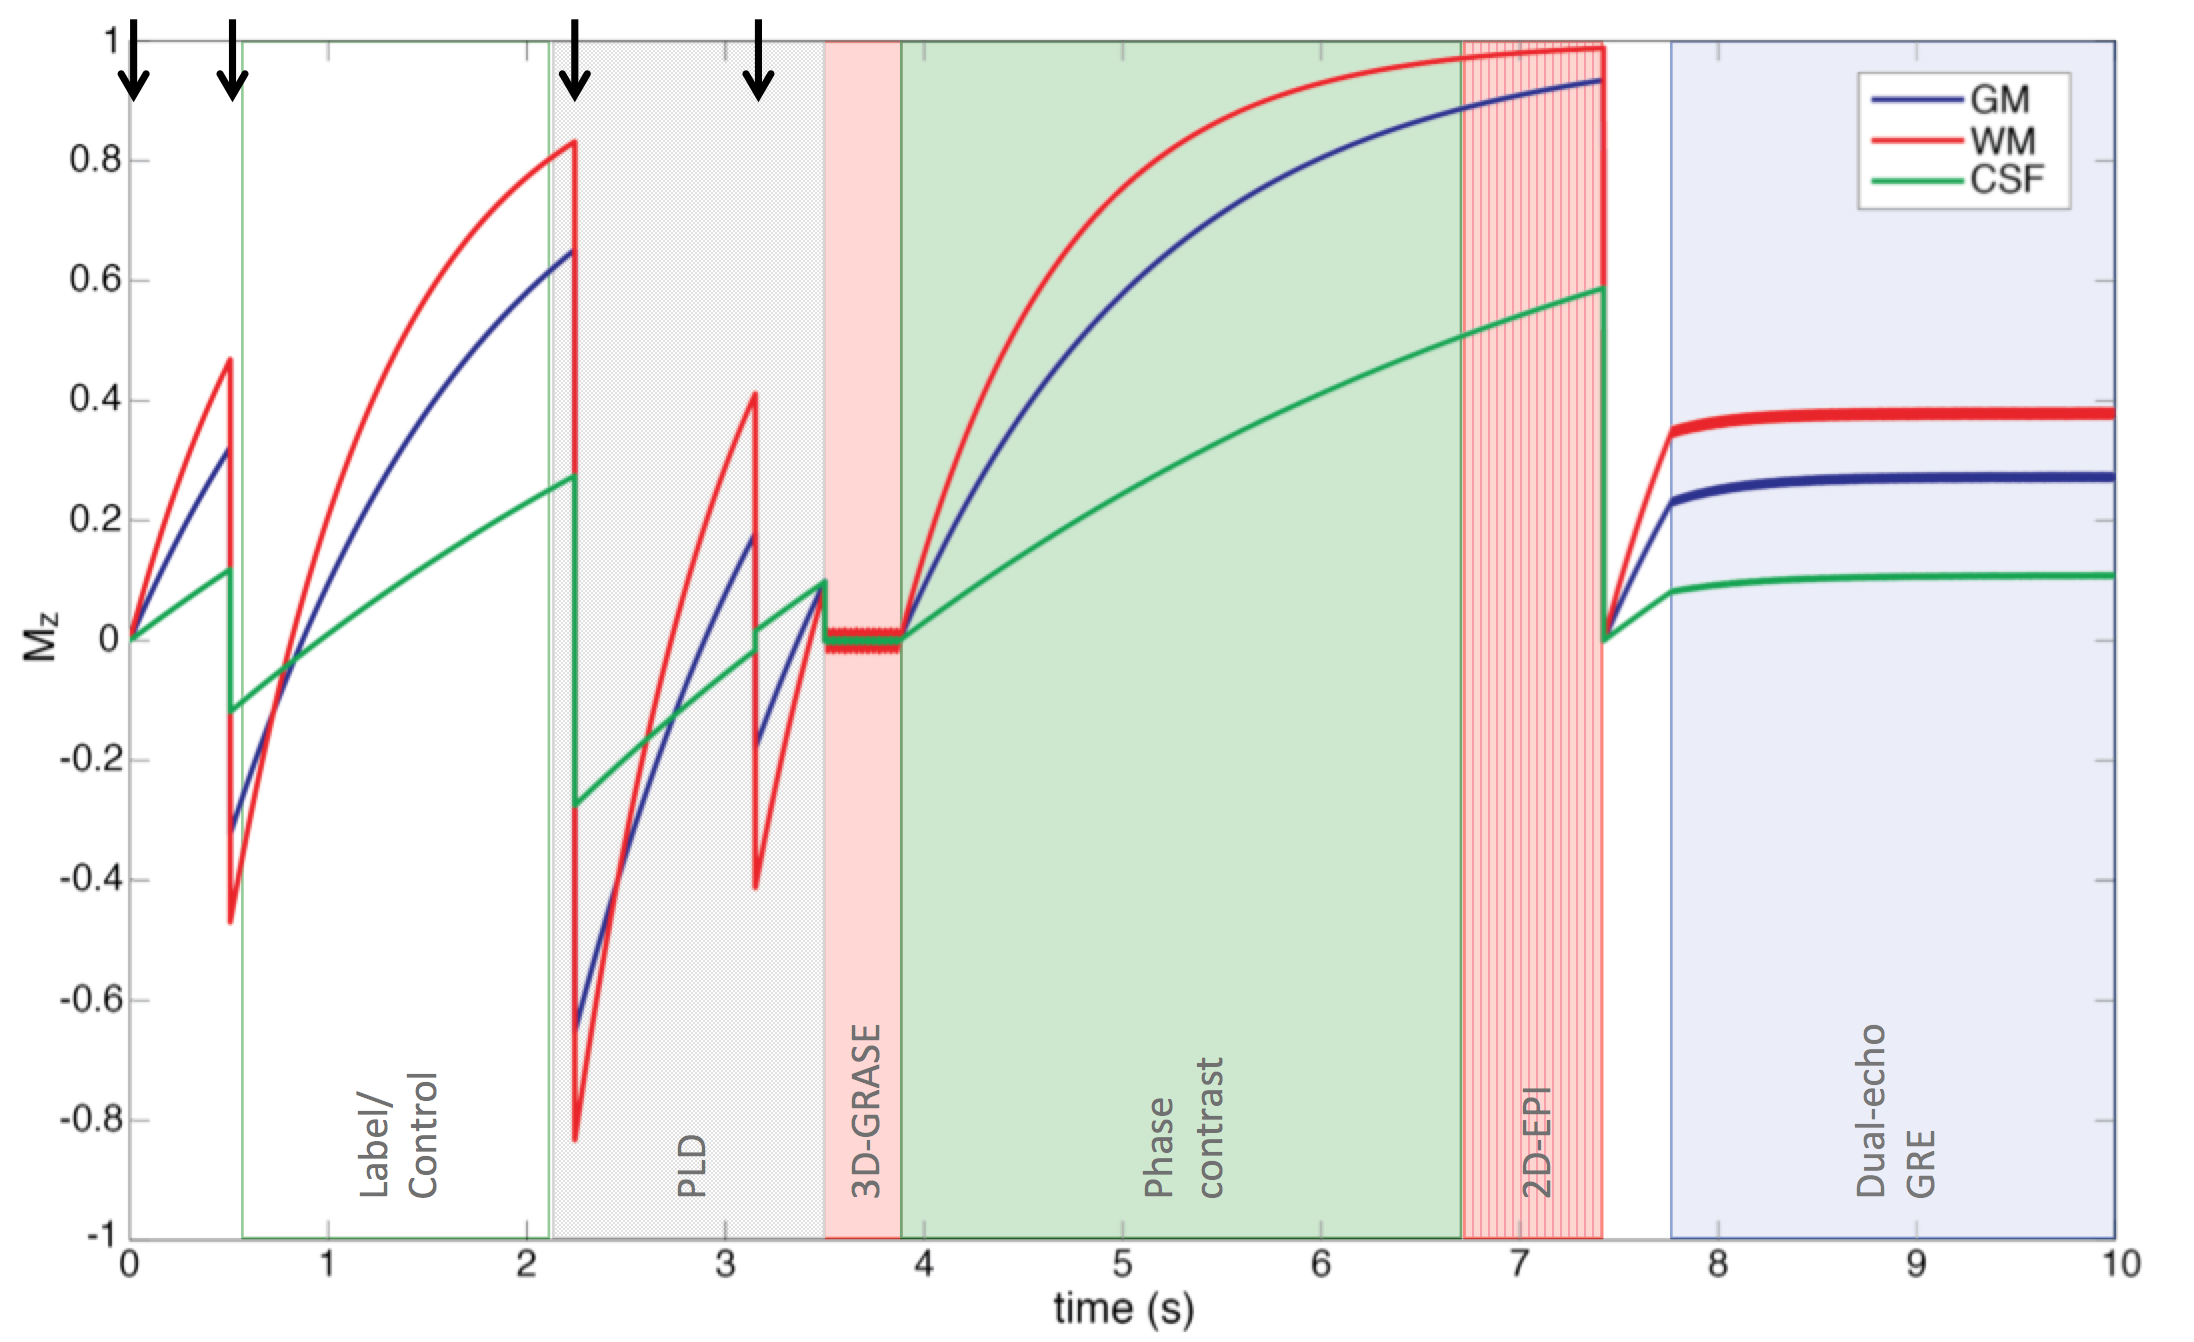
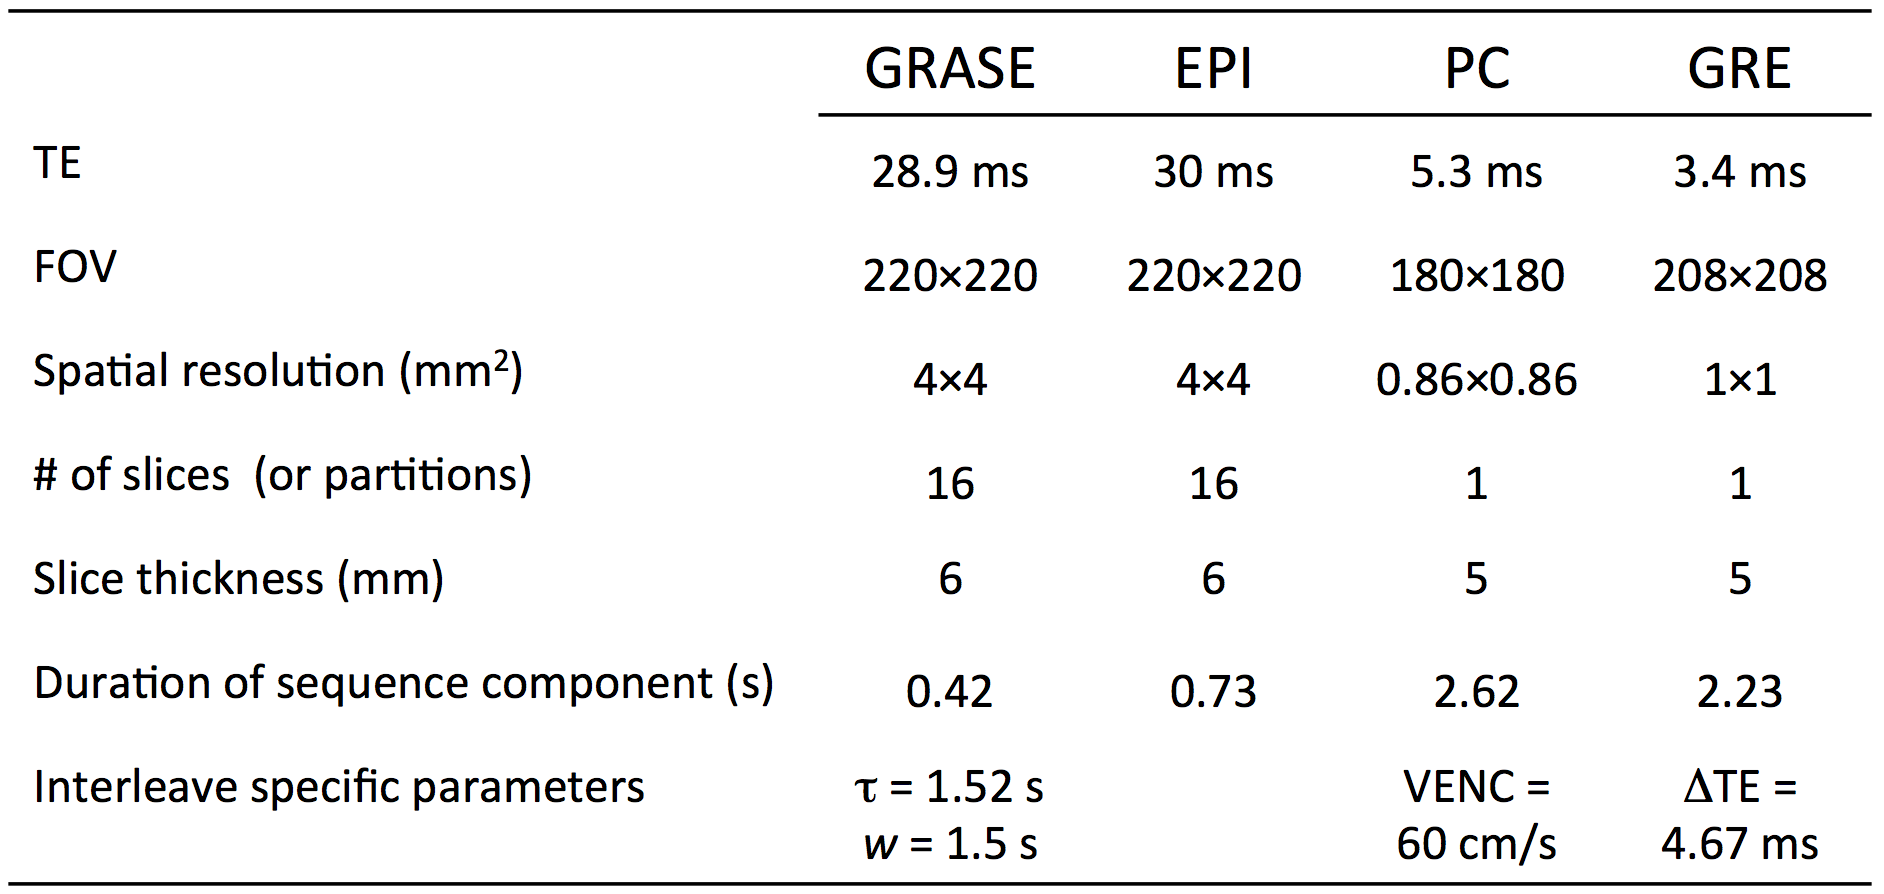
Measurement of perfusion, total CBF, BOLD, and Yv can be achieved by concatenating pCASL, phase contrast, EPI, and field mapping sequences, using a pulse sequence termed “OxBOLD” (Figure 1). Figure 2 shows the trajectory of longitudinal magnetization of brain tissues during the acquisition. Phase contrast occurs during sequence dead time required for signal recovery. Dual-echo GRE data are used to quantify global Yv in the superior sagittal sinus (SSS)9. Sequence parameters are shown in Table 1.
Performance of the Yv-based calibration model [Eq. 2] using hyperoxia was compared with the hypercapnia-based Davis model1 represented by:
$$$\frac{\Delta BOLD}{BOLD_0}=M\left(1-\left(\frac{CBF}{CBF_0}\right)^{\alpha-\beta}\right)$$$ [3],
(assuming isometabolic response to hypercapnia $$$\frac{CMRO_2}{CMRO_2\mid_0}\approx1$$$). OxBOLD data were acquired at 3T in five subjects throughout 5 minutes breathing 100% O2 (hyperoxia, HO) and in four of those subjects, during 5 minutes breathing 5% CO2 in room air (hypercapnia, HC). Baseline data were acquired for 5 minutes prior to HO and HC stimuli. Perfusion was quantified according to Wang, et al11 from the tag-control difference, assuming T1 of blood =1650 ms at baseline and HC12, and =1490 ms during HO13. M-maps were generated from [Eq. 3] for HC and [Eq. 2] for HO stimulus data using α=0.18 and β=1.5 14.
Results
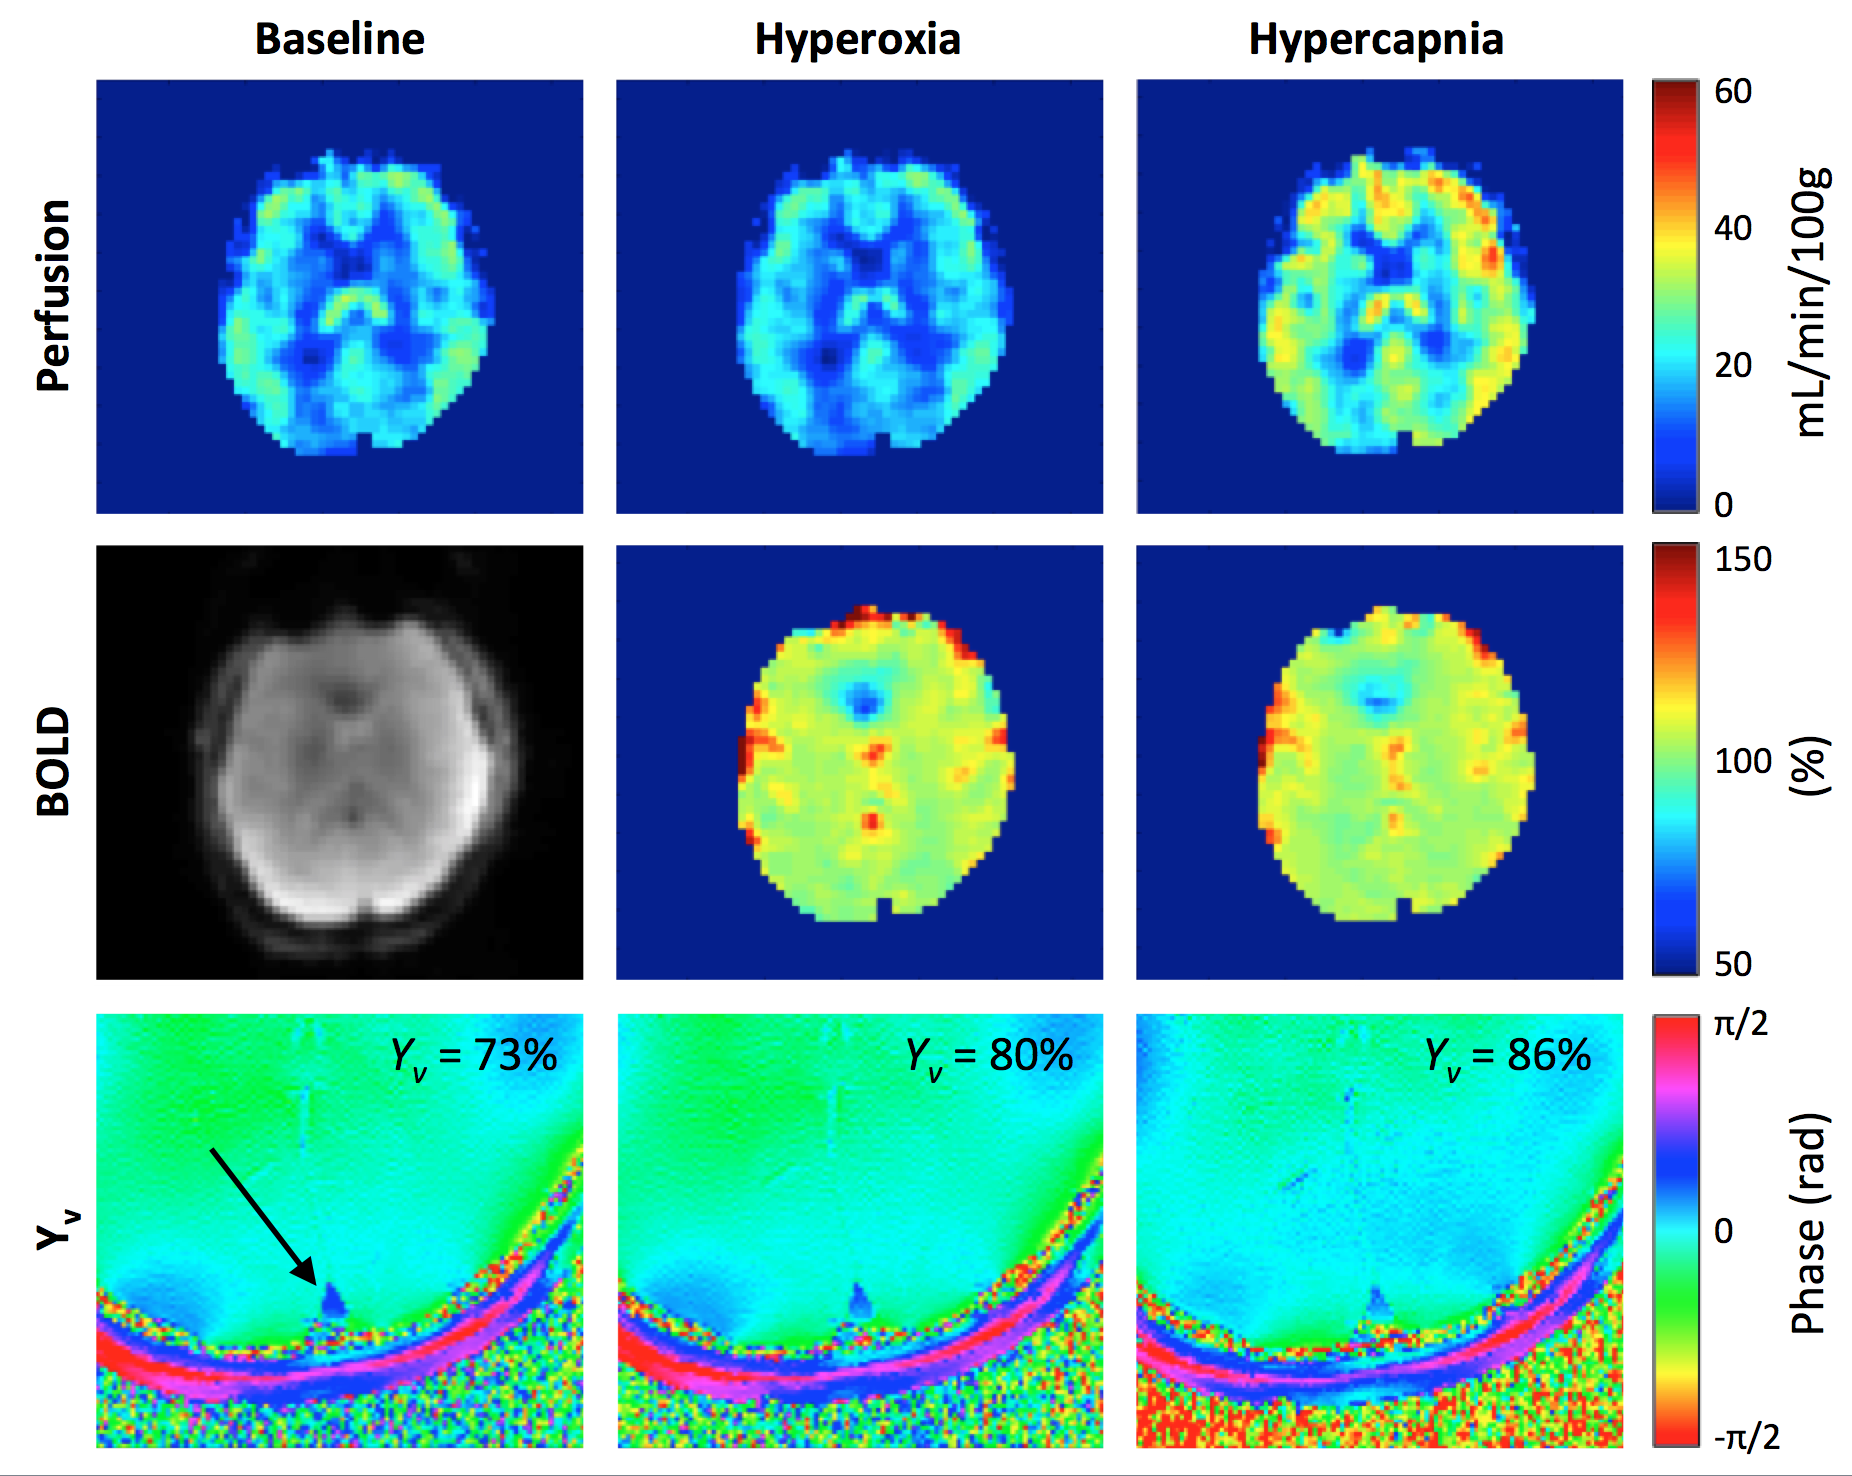
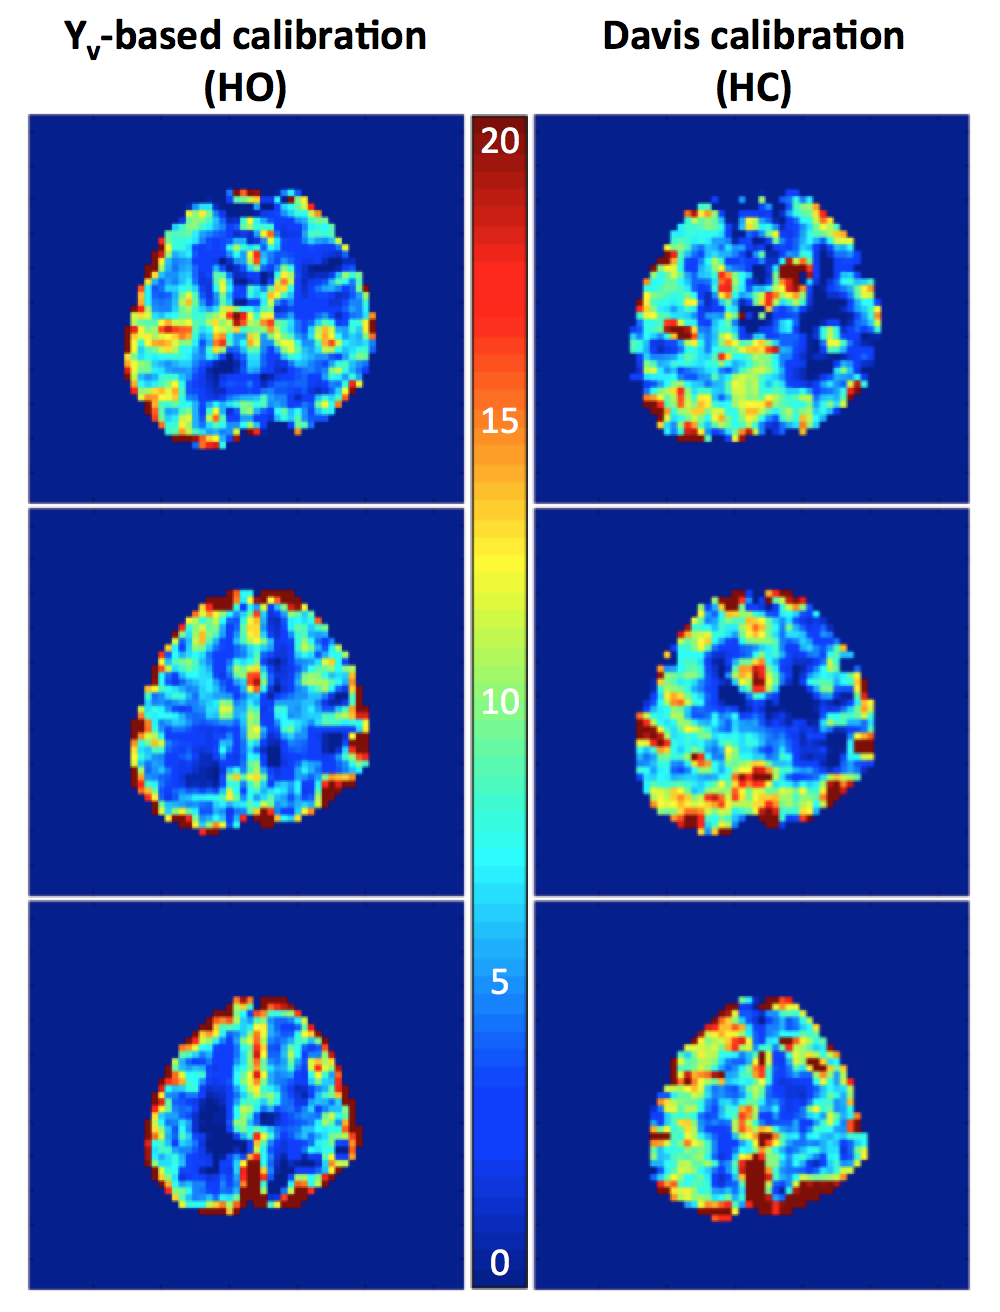
Average grey-matter M for HC was 9.3±1.3% (Davis model), and for HO was 11.2±1.4% (Yv-based model), with both M-maps demonstrating plausible anatomic contrast. Figure 3 shows baseline and response images for the quantified parameters, and Figure 4 shows M-maps from the HO and HC experiments.Discussion & Conclusions
This work suggests the feasibility of OxBOLD combined with the Yv-based model for hyperoxia calibrated fMRI. The improved OxBOLD sequence quantifies regional CBF from ASL, BOLD with whole-brain coverage, global oxygen extraction, and tCBF (which can be used to double-check the ASL response). Using the Yv-based model, average M-values and maps were similar to previous reports1,3, but the model does not rely on monitoring of PETO2, nor does it assume flow/CMRO2 changes. Although not explored here, the Yv-based model can be applied to HC by assuming uniform CMRO2 changes (quantified from OxFlow data), which relaxes the assumption of isometabolism imposed by the Davis model. Further benefits of using HO for calibration include that O2 is widely available in the hospital setting, HO is well-tolerated, and HO calibration allows for subsequent investigation of CMRO2 changes during breath-hold (mixed hypercapnic/hypoxic stimulus). Ongoing studies are investigating the repeatability of M-mapping using OxBOLD and CMRO2 changes during task activation.Acknowledgements
The project described was supported by the National Center for Research Resources, Grant UL1RR024134, and is now at the National Center for Advancing Translational Sciences, Grant UL1TR000003. The content is solely the responsibility of the authors and does not necessarily represent the official views of the NIH. Also supported in part by the Institute for Translational Medicine and Therapeutics’ (ITMAT) Transdisciplinary Program in Translational Medicine and Therapeutics, and NIH grant T32 HL007954.References
1. Davis TL, Kwong KK, Weisskoff RM, Rosen BR. Calibrated functional MRI: mapping the dynamics of oxidative metabolism. Proceedings of the National Academy of Sciences. 1998;95:1834–1839.
2. Boxerman JL, Hamberg LM, Rosen BR, Weisskoff RM. MR contrast due to intravascular magnetic susceptibility perturbations. Magn Reson Med. 1995;34:555–566.
3. Chiarelli PA, Bulte DP, Wise R, Gallichan D, Jezzard P. A calibration method for quantitative BOLD fMRI based on hyperoxia. NeuroImage. 2007;37:808–820.
4. Fernández-Seara MA, Techawiboonwong A, Detre JA, Wehrli FW. MR susceptometry for measuring global brain oxygen extraction. Magn Reson Med. 2006;55:967–973.
5. Bright MG, Murphy K. Reliable quantification of BOLD fMRI cerebrovascular reactivity despite poor breath-hold performance. NeuroImage. 2013;83:559–568.
6. Floyd TF, Clark JM, Gelfand R, Detre JA, Ratcliffe S, Guvakov D, Lambertsen CJ, Eckenhoff RG. Independent cerebral vasoconstrictive effects of hyperoxia and accompanying arterial hypocapnia at 1 ATA. Journal of Applied Physiology. 2003;95:2453–2461.
7. Zaharchuk G, Martin AJ, Dillon WP. Noninvasive Imaging of Quantitative Cerebral Blood Flow Changes during 100% Oxygen Inhalation Using Arterial Spin-Labeling MR Imaging. American Journal of Neuroradiology. 2008;29:663–667.
8. Fernández-Seara MA, Rodgers ZB, Englund EK, Wehrli FW. Calibrated bold fMRI with an optimized ASL-BOLD dual-acquisition sequence. NeuroImage. 2016;142:474–482.
9. Jain V, Langham MC, Wehrli FW. MRI estimation of global brain oxygen consumption rate. JCBFM. 2010;30:1598–1607.
10. Rodgers ZB, Jain V, Englund EK, Langham MC, Wehrli FW. High temporal resolution MRI quantification of global cerebral metabolic rate of oxygen consumption in response to apneic challenge. JCBFM. 2013;33:1514–1522.
11. Wang DJ, Zhang Y, Wolf RL, Roc AC, Alsop DC, Detre JA. Amplitude-modulated continuous arterial spin-labeling 3.0-T perfusion MR imaging with a single coil: Feasibility study. Radiology. 2005;235:218–228.
12. Alsop DC, Detre JA, Golay X, Günther M, Hendrikse J, Hernandez-Garcia L, Lu H, MacIntosh BJ, Parkes LM, Smits M, van Osch MJP, Wang DJ, Wong EC, Zaharchuk G. Recommended implementation of arterial spin-labeled perfusion MRI for clinical applications: A consensus of the ISMRM perfusion study group and the European consortium for ASL in dementia. Magn Reson Med. 2014;73:102–116.
13. Siero JCW, Strother MK, Faraco CC, Hoogduin H, Hendrikse J, Donahue MJ. In vivo quantification of hyperoxic arterial blood water T1. NMR Biomed. 2015;28:1518–1525.
14. Gauthier CJ, Hoge RD. A generalized procedure for calibrated MRI incorporating hyperoxia and hypercapnia. 2012;34:1053–1069.
Figures