4542
The Relationship between Diffusivity and Electrical Conductivity: Initial Results of an In Vivo Assessment by MRI1Department of Radiation Medicine, Hokkaido University, Sapporo, Japan, 2Philips Research Laboratories, Hamburg, Germany, 3Department of Neurosurgery, Hokkaido University, Japan
Synopsis
Background and Purpose
Electrical conductivity is an intrinsic property of a tissue to conduct electricity. It has been reported as dependent to sodium ion concentration and/ or mobility. Recent development of Electric Properties Tomography (EPT) has allowed noninvasive assessment of electrical conductivity of tissue in vivo from phase images of standard MRI scans. Promising results, such as potential utility of EPT for grading gliomas, have been observed. In this study, we sought to evaluate the role of diffusivity on electrical conductivity values, by using EPT and diffusion MRI.Methods
This study included 24 treatment-naïve patients with confirmed diagnosis of astrocytic and oligodendroglial tumors (8 Grade II, 8 Grade III, and 6 Grade IV). EPT was performed with a bFFE sequence with non-selective RF pulse (TR/TE/α/NEX=3.5 ms/ 1.7 ms/ 25°/2, Voxel size=1.3 x 1.2 x 1 mm3), using a 3T scanner (Achieva TX, Philips Medical Solutions, Best, the Netherlands). Diffusion kurtosis imaging (DKI) was performed using a spin-echo echo-planar imaging sequence and the following parameters: TR/TE = 5300/ 78 ms, NEX = 1, voxel size = 3 x 3 x 3 mm3, b = 0, 1000, 2000 s mm-2, number of diffusion gradient directions = 32. In addition to the aforementioned sequences, axial pre- and post-contrast-enhanced T1WI, T2WI, and FLAIR imaging were also performed. σ maps were reconstructed from the phase images of EPT, using an in-house software and the formula σ= (2μ0ω)-1ΔΦ, where μ0=magnetic permeability of the body, ω=Larmour frequency, Δ=Laplacian operator, and Φ=transceive phase. Mean kurtosis (MK), kurtosis fractional anisotropy (KFA), and mean diffusivity (MD) maps were reconstructed from the DKI image datasets, using DKE software. In each patient, the contrast-enhanced (CE) and non-contrast-enhanced (NCE) tumor components were segmented semiautomatically, from the pre- and post-contrast-enhanced T1WI, T2WI, and FLAIR images. These components were then superimposed onto the σ, MK, KFA, and MD maps coregistered with the other images. The minimum, maximum, mean, and mode values of each were then extracted for each tumor component; and correlation between σ and MK, KFA, and MD was tested, using Pearson's product moment correlation analysis.Results
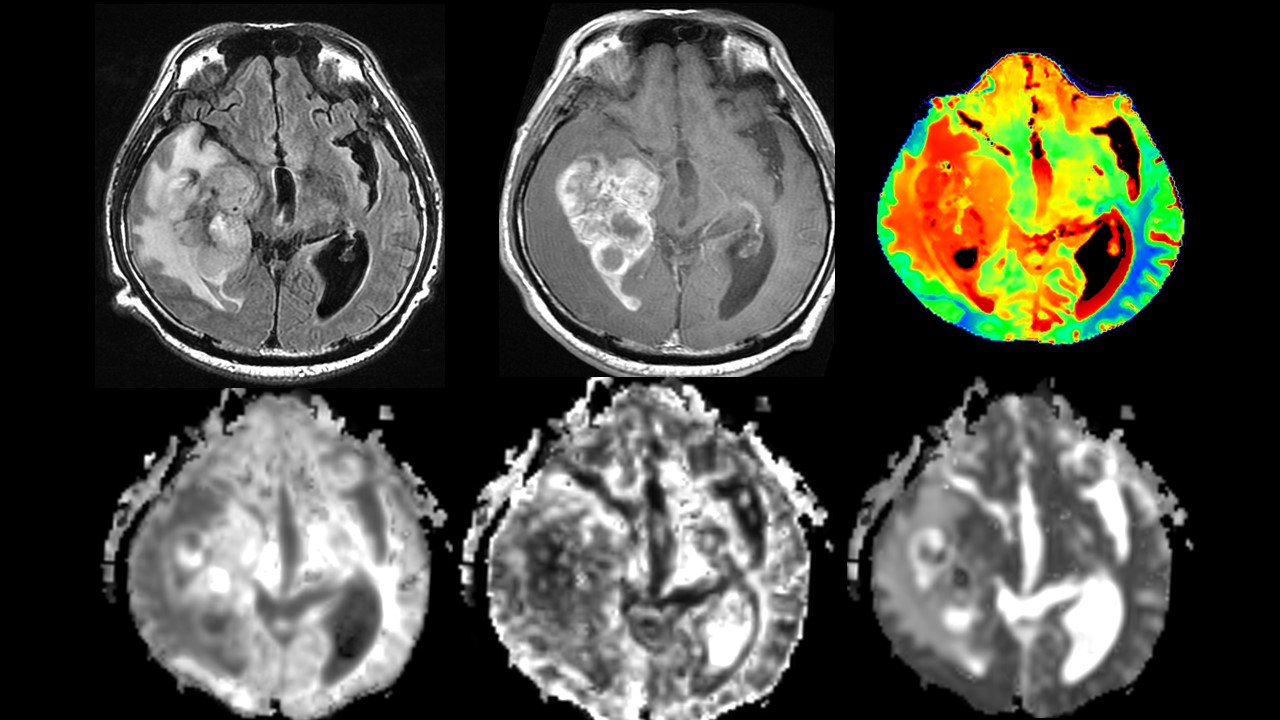
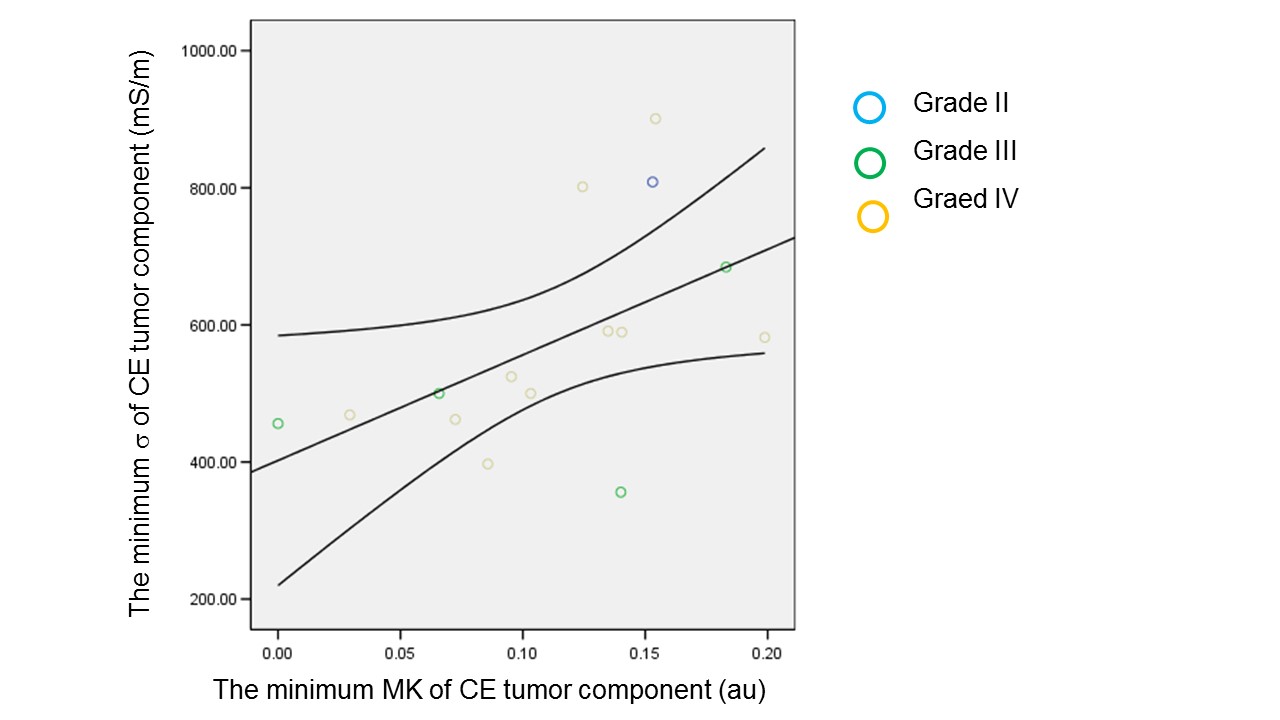
The representative images and maps of a glioblastoma (grade IV) patient are shown in Fig 1. The minimum of KFA and MK of the CE component showed significant positive correlation with the minimum σ value of the same tumor component (r =0.61, P = 0.02 and r = 0.53, P = 0.04, respectively) (Fig 2). Similarly, the minimum and maximum MK of the NCE tumor component revealed positive and negative correlation with minimum σ of the NCE tumor component (r = 0.56, P<0.01 and r = -0.45, P = 0.03). No significant correlation between MD and σ was observed. When tumor grade was included as a controlled variable, the correlation between the minimum MK of the CE tumor component and the minimum σ remained significant (r = 0.63, P=0.03).
Discussion
Our results of correlation between MK and KFA with σ of the tumor are thought to reflect the association between complexity of tissue microstructure and electrical conductivity. Lack of correlation between MD and σ may imply that ion diffusivity is not a major factor which determines electrical conductivity.Conclusions
Electrical conductivity has potential associations with complexity of tissue microstructure, which is a common feature in high grade tumors.Acknowledgements
This study was supported by the grant-in-aid for scientific research (KAKENHI-26461817) and the Global Institution for Collaborative Research and Education (GI-CoRE), Hokkaido University.References
1. Katscher U, Kim DH, Seo JK. Recent progress and future challenges in MR electric properties tomography. Comput Math Methods Med 2013; 2013: 546562
2. Tha KK, et al. Electrical Conductivity Characteristics of Glioma: Noninvasive Assessment by MRI and Its Validity. ISMRM 2016.
3. Diffusion Kurtosis Estimator. http://academicdepartments.musc.edu/cbi/dki/
3. H.P. Schwan. Electrical properties of tissue and cell suspensions, Adv. Biol. Med. Phys. 5, 147-209, 1957.
Figures