4541
Single-scan, whole-brain functional network mapping using optogenetic fMRI with CBV1Bioengineering, Stanford University, Stanford, CA, United States, 2Neurology and Neurological Sciences, Stanford University, Stanford, CA, United States, 3Neurosurgery, Stanford University, Stanford, CA, United States, 4Electrical Engineering, Stanford University, Stanford, CA, United States
Synopsis
Optogenetic fMRI studies have traditionally required significant scan averaging to achieve signal-to-noise ratios sufficient for whole-brain functional network mapping. As a result, more scan time is required, and measurements may not directly translate to accompanying behavioral paradigms that employ a single stimulation. Here, we used a SPION-based MRI contrast agent to enable single-scan functional network mapping with CBV during optogenetic stimulation of the thalamic submedial nucleus. Measurement of CBV led to significant activations detected at the site of stimulation and downstream mono- and polysynaptically connected regions. In comparison, single-scan BOLD measurements led to minimal detectable responses to stimulation.
Purpose
The combination of optogenetic stimulation with simultaneous fMRI readouts (ofMRI) is an effective method for mapping the brain-wide causal influence of specific genetically- and spatially-defined neuronal populations. However, a limitation shared by previous ofMRI studies has been the large number of scans needed before signal changes are detected1-3. To take full advantage of the ofMRI toolbox, whole-brain functional network mapping should ideally be achievable in a single scan. Here, we investigated whether measurement of cerebral blood volume (CBV) by use of a superparamagnetic iron oxide nanoparticle (SPION)-based contrast agent could enable robust single-scan detections during optogenetic brain stimulation. To address this question, we targeted excitatory neurons of the thalamic submedial nucleus. Although this region has a known role in descending pain modulation via the ventrolateral orbital (VLO) cortex, the brain-wide causal influence of submedial excitatory neurons has never been visualized directly. Optogenetic stimulation of thalamus has also been shown to induce widespread activity in both subcortical and cortical targets3-4, suggesting this region would be an appropriate target to determine whether single CBV scans can offer whole-brain functional network mapping.Methods
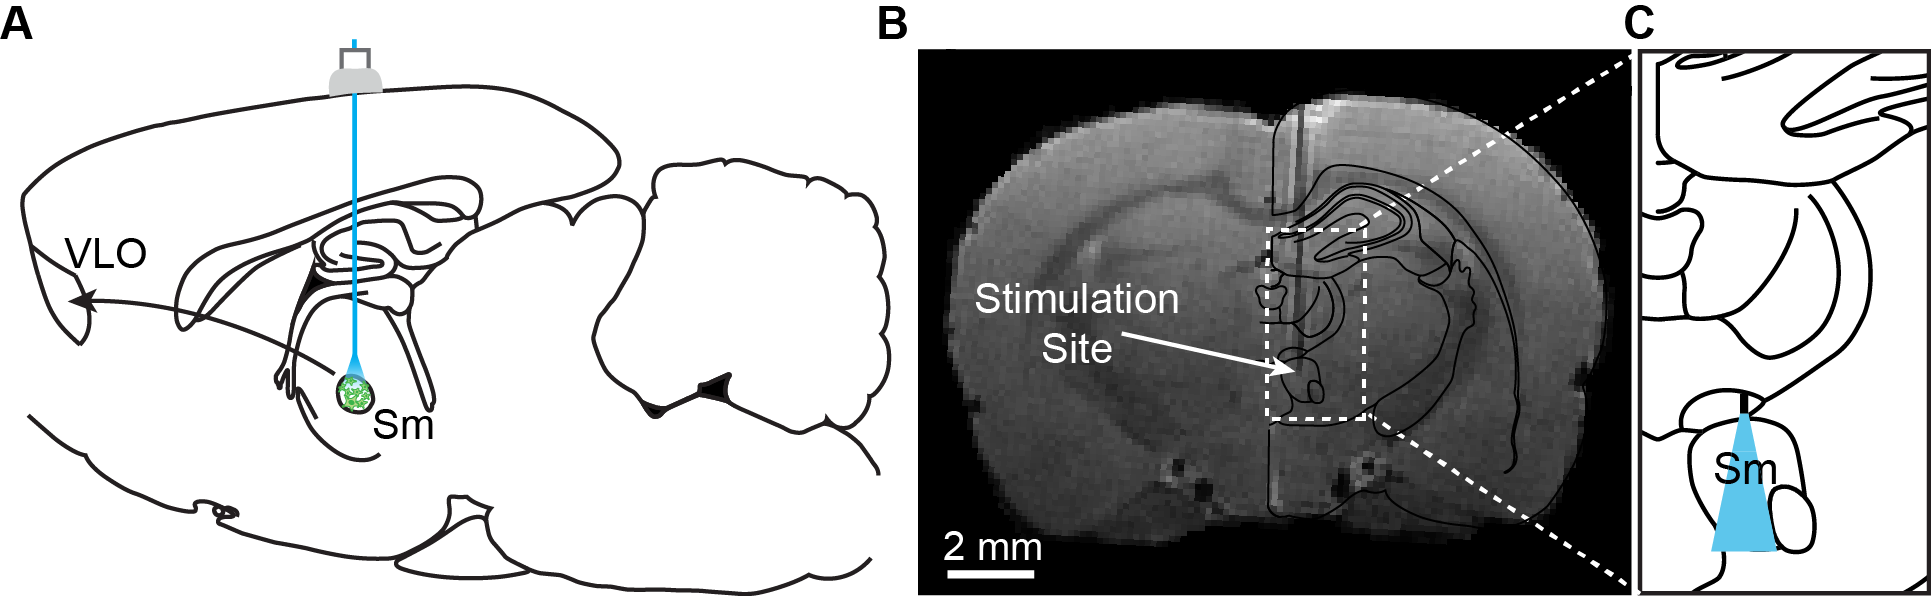
Two microliters of AAV5-CaMKIIa::ChR2(H134R)-EYFP virus were injected into the submedial thalamic nucleus of adult female Sprague-Dawley rats (16±4 weeks, n=13). In the same surgery, a 62.5 um diameter optical fiber implant was inserted at the virus injection site (-2.63 mm AP, +0.64 mm ML, -6.58 mm DV; Figure 1).
In vivo imaging was conducted at least 7 weeks after surgery to allow for full ChR2 expression. Animals were anesthetized during image acquisition with 1.7% isoflurane, and opaque tape was used to cover the animal’s eyes. fMRI data was acquired in a 7T Bruker BioSpin scanner with a four-shot spiral sequence (TR/TE=750/12 ms, FOV=35x35 mm2, matrix size=70x70). Prior to animal placement in the scanner, 15 mg/kg of the SPION contrast agent Feraheme was administered through the tail vein to visualize the CBV response. Optical stimuli were presented as a block-design paradigm, with six cycles of 20s stimulation trains presented every minute (30% duty cycle, 473 nm light, 2.5 mW). In a subset of subjects, a second series of experiments was conducted to compare single-scan activations between blood-oxygen-level-dependent (BOLD) and CBV measurements. Three consecutive scans of BOLD were collected, followed by three more scans measuring the CBV response after Feraheme injection.
Data were analyzed in SPM12 using a fourth-order gamma basis function to identify significant responses (P < 0.05, FWE-corrected). Regions of interest were delineated via a standard rat brain atlas5 to quantify responses.
Results
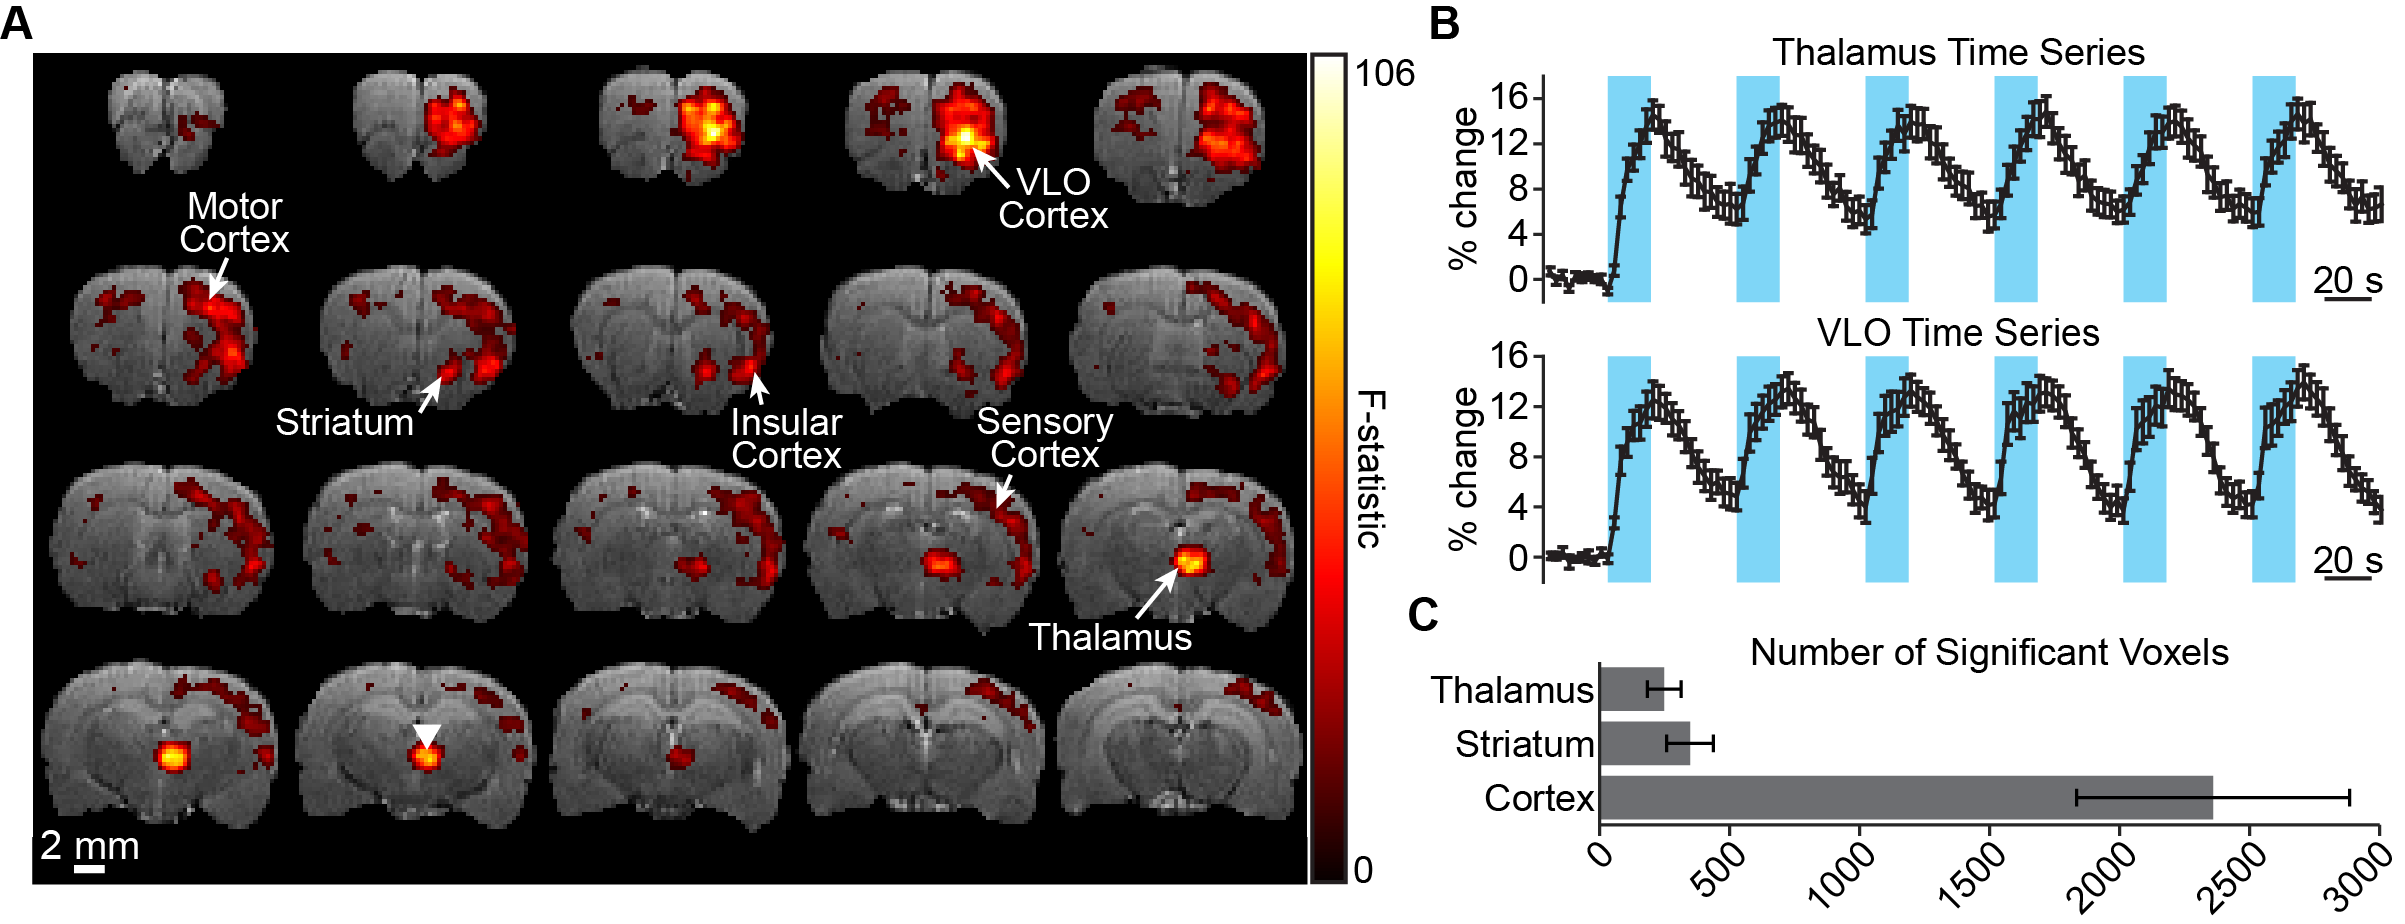
Figure 2A shows the significant CBV responses to optogenetic stimulation in a representative animal. The strongest signals are observed at the site of stimulation and VLO cortex, a projection site of the targeted nucleus6. This pattern was consistent across all animals tested. Time series from these regions also show that robust signal modulations could be measured from a single scan (Figure 2B). Other regions modulated by stimulation include striatum and motor/somatosensory cortex. Brain-wide quantification across animals emphasizes the large volume of detected activations (Figure 2C).
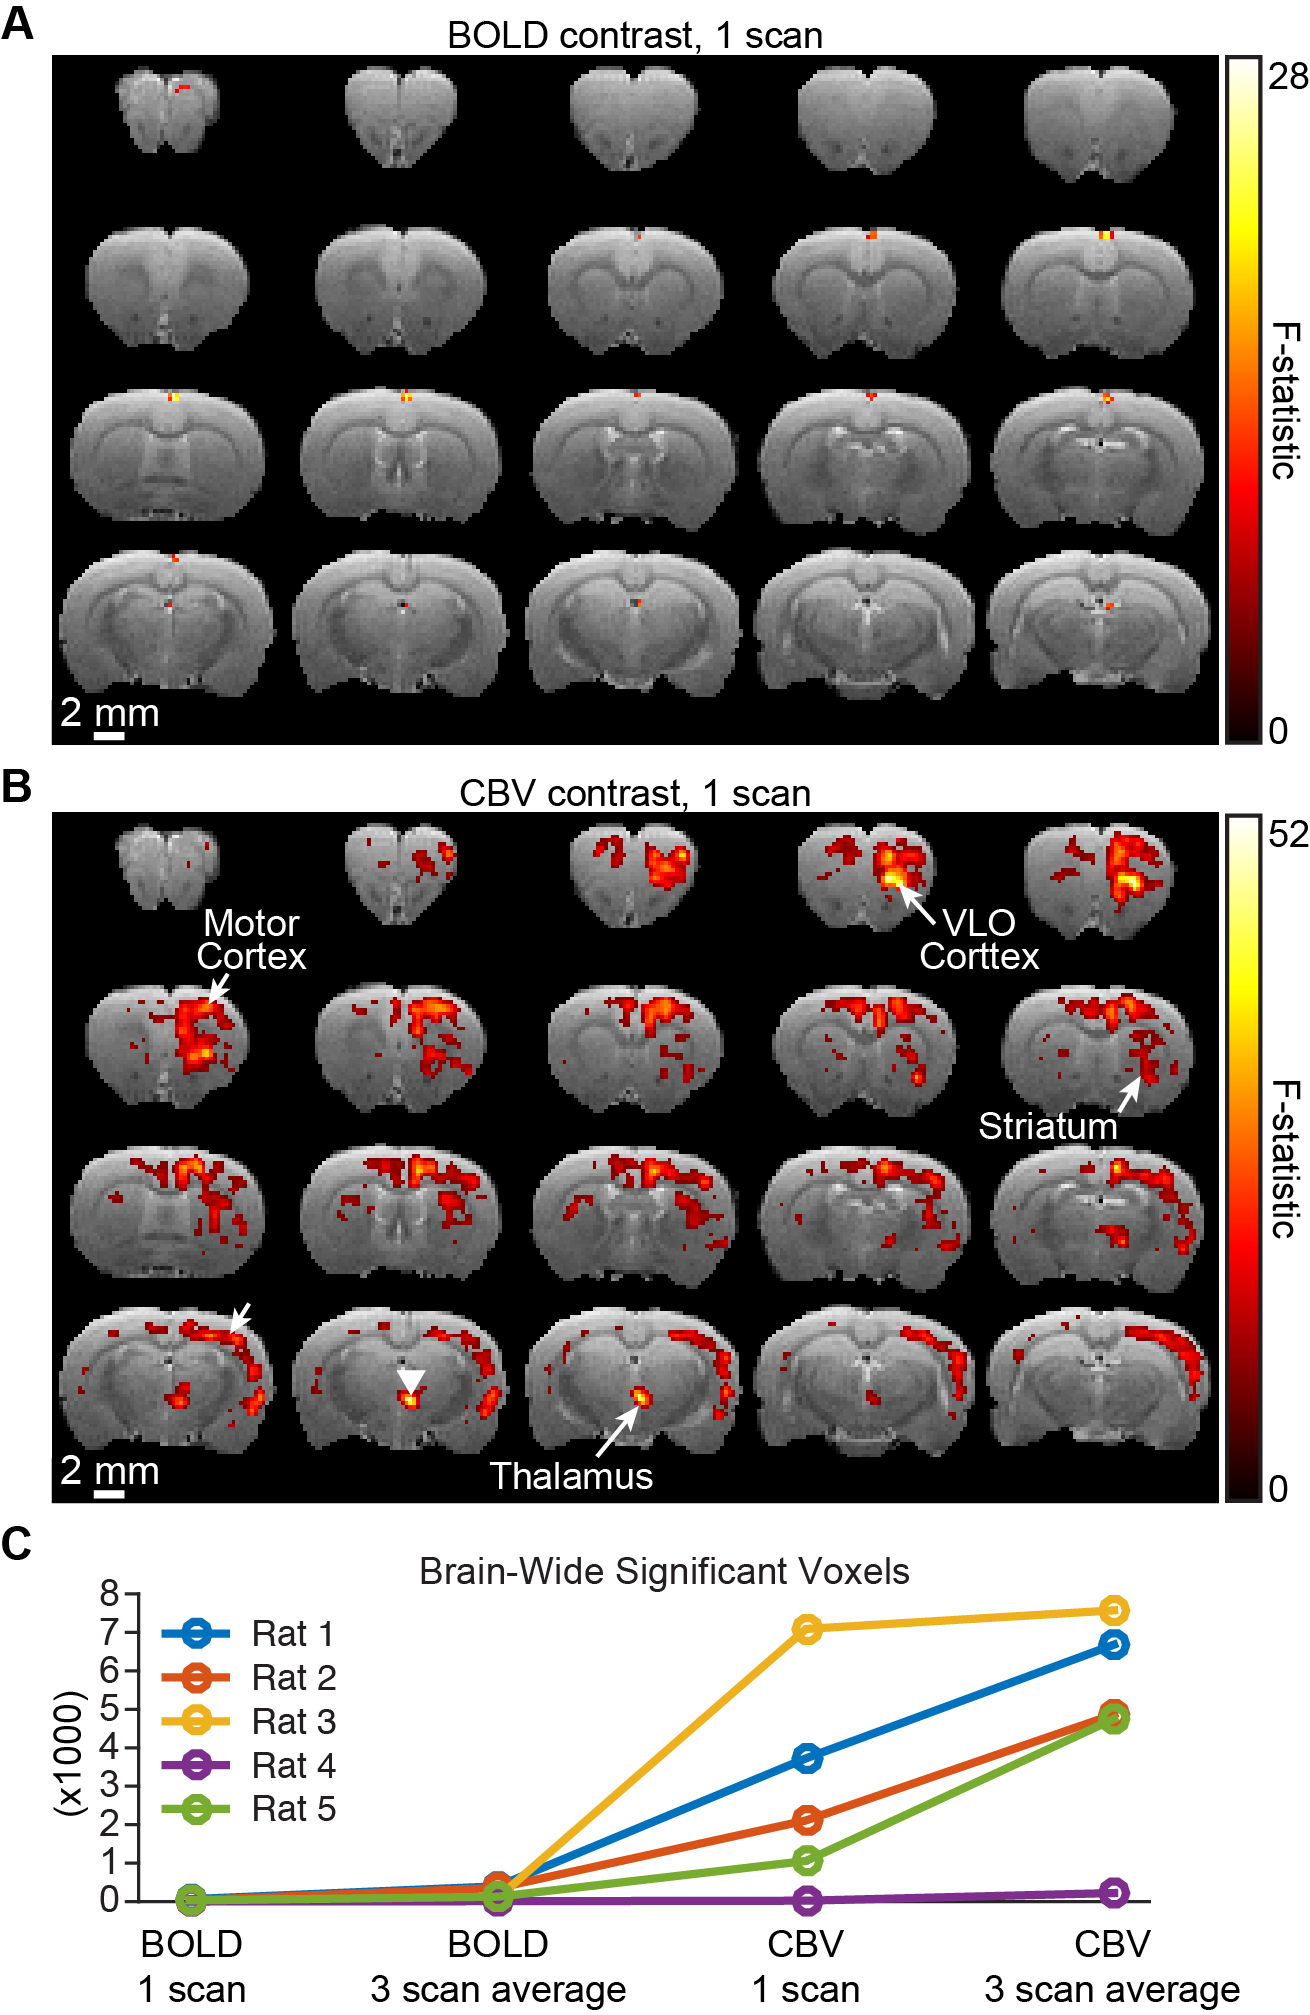
Figure 3 provides a representative comparison of single-scan BOLD and CBV measurements during the same experiment. Although only a small number of active voxels are detected in the BOLD scan, measurement of CBV results in detectable signal changes across the brain. Quantification of brain-wide activation volume confirms this trend across animals, and highlights that the improvement afforded by CBV extends far beyond the improvement achieved by averaging three scans (Figure 3C).
Discussion
These data confirm that CBV ofMRI is a viable method for single-scan functional brain network mapping. In particular, the improvement in sensitivity afforded by CBV means that brain-wide network dynamics can be visualized and analyzed resulting from only a single – in our case, six minute – scan. One important benefit of this capability is the reduction in scan time required for measuring the brain’s response to a particular stimulus. As a result, more stimulation parameters can be investigated to better understand the network of interest’s behavior. Recently, one ofMRI study used both BOLD and CBV to measure the brain’s response to dopaminergic neuron stimulation7. The authors observed similar activation patterns between the two contrasts, with CBV giving slightly more activation. Our study confirms and extends these findings, revealing a dramatic brain-wide increase in sensitivity afforded by CBV.Conclusion
This study confirms that use of a SPION-based contrast agent for CBV ofMRI is a viable method for single-scan functional brain network mapping. Future studies using this approach will benefit from reduced scan time and greater sensitivity compared to conventional BOLD imaging.Acknowledgements
We thank members of the Lee laboratory for valuable discussions and experimental assistance on the research presented here. This work was supported through funding from the NIH/NIBIB R00 Award (4R00EB008738), Okawa Foundation Research Grant Award, NIH Director’s New Innovator Award (1DP2OD007265), NSF CAREER Award (1056008), Alfred P. Sloan Foundation Research Fellowship, NIH/NINDS R01NS087159, NIH/NINDS R01NS091461, and NIH/NIA RF1AG047666.References
[1] Weitz, A.J., Fang, Z., Lee, H.J., Fisher, R.S., Smith, W.C., Choy, M.K., Liu, J., Lin, P., Rosenberg, M., and Lee, J.H. (2015). Optogenetic fMRI reveals distinct, frequency-dependent networks recruited by dorsal and intermediate hippocampus stimulations. NeuroImage 107, 229-241.
[2] Lee, H.J., Weitz A.J., Bernal-Casas, D., Duffy, B.A., Choy, M.K., Kravitz, A.V., Kreitzer, A.C., and Lee, J.H. (2016). Activation of direct and indirect pathway medium spiny neurons drives distinct brain-wide responses. Neuron 91 (2), 412-424.
[3] Liu, J., Lee, H.J., Weitz, A.J., Fang, Z., Lin, P., Choy, M.K., Fisher, R., Pinskiy, V., Tolpygo, A., Mitra, P., Schiff, N., and Lee J.H. (2015). Frequency-selective control of cortical and subcortical networks by central thalamus. eLife 4, e09215.
[4] Lee, J.H., Durand, R., Gradinaru, V., Zhang, F., Goshen, I., Kim, D.S., Fenno, L.E., Ramakrishnan, C., and Deisseroth, K. (2010). Global and local fMRI signals driven by neurons defined optogenetically by type and wiring. Nature 465, 788-792.
[5] Paxinos G. & Watson C. (2005). The rat brain in stereotaxic coordinates, 5th ed. New York: Academic Press.
[6] Yoshida, A., Dostrovsky, J.O., and Chiang, C.Y. (1992). The afferent and efferent connections of the nucleus submedius in the rat. Journal of Comparative Neurology 324, 115-133.
[7] Lohani, S., Poplawsky, A.J., Kim, S.G., and Moghaddam B. (2016). Unexpected global impact of VTA dopamine neuron activation as measured by opto-fMRI. Molecular Psychiatry, [advanced online publication].
[8] Aravanis, A.M., Wang, L.P., Zhang, F., Meltzer, L.A., Mogri, M.Z., Schneider, M.B., Deisseroth, K. (2007). An optical neural interface: in vivo control of rodent motor cortex with integrated fiberoptic and optogenetic technology. Journal of Neural Engineering 4, 143-156.
Figures