4540
Rapid and Quantitative Parametric Mapping for Mesial Temporal Lobe Epilepsy Using MR Fingerprinting1Center for Brain Imaging Science and Technology, Department of Biomedical Engineering, Zhejiang University, Hangzhou, People's Republic of China, 2Department of Neurology, The First Affiliated Hospital, School of Medicine, Zhejiang University, Hangzhou, People's Republic of China
Synopsis
A recently proposed MR fingerprinting (MRF) technique was used to acquire quantitative multi-parametric maps in about 3 minutes for diagnosis of mesial temporal lobe epilepsy in 20 patients. The results could improve the reliability and sensitivity of MRI evaluations in such patients compared with conventional MRI diagnosis methods.
Purpose
Mesial Temporal Lobe Epilepsy (MTLE) is a disorder of the nervous system characterized by focal seizures that originate in the hippocampus, which is one of main types of temporal lobe epilepsy [1]. As the most common type of MTLE, hippocampal sclerosis (HS) is associated with high intensity signal in T2 weighted images in many cases due to its prolonged T2 relaxation time in the atrophic hippocampus. Routine MRI-based epilepsy diagnosis including contrast imaging, hippocampal volumetric measurements, voxel-based morphometry methods, all of them are based on the assumption that contralateral region of hippocampus is normal, which implies a comparisons between two sides of hippocampus may not be efficient and significant for bilateral MTLE patients or unilateral MTLE patients with subtle HS.
Previous relaxometry studies of epilepsy patients demonstrated that both quantitative T1 and T2 values of epileptic focus in epilepsy patients are longer than those of healthy controls, which can be used to improve the accuracy of diagnosis of the subtle changes of tissue in MTLE patients [2]. However, conventional quantitative imaging methods such as inversion recovery sequence (for T1 map) and spin echo sequence (for T2 map) are rarely utilized in clinical applications due to their long acquisition time. In this study, a recently proposed MRF technique [3, 4] was utilized to obtain T1, T2 and proton density (PD) maps of whole brain simultaneously in about 3 minutes to quantitatively investigate the HS lesions of MTLE patients.
Method
The sequence based on an inversion-prepared FISP sequence (FISP-MRF) [4] was used for MRF scans, with 20 slices of thickness of 3 mm in both transverse and coronal orientations scanned that covered the temporary lobe of patients. 600 time points were acquired per slice with the total acquisition time about 3 minutes for 20 slices in each orientation. The final T1, T2 and PD maps were recognized simultaneously by our proposed sliding-window matching algorithm [5]. The in-plane spatial resolution of 1.3 × 1.3 mm2 was achieved for the reconstructed images in a field of view (FOV) of 250 × 250 mm2. A series of scans with routine protocols including T1-MPRAGE and T2-TSE images were also used for conventional MRI scans. All the measurements were performed on a 3T scanner (MAGNETOM Prisma, Siemens Healthcare, Erlangen, Germany) with 20-channel head coil.
20 MTLE patients (10 females and 10 males) with age ranging 15-55 years old participated in this study. All the patients were diagnosed with HS based on EEG and clinical presentation. The data of 20 healthy volunteers were acquired by the same FISP-MRF sequence as the control group to compare the T1 and T2 values of hippocampus with patients.
Results and Discussion
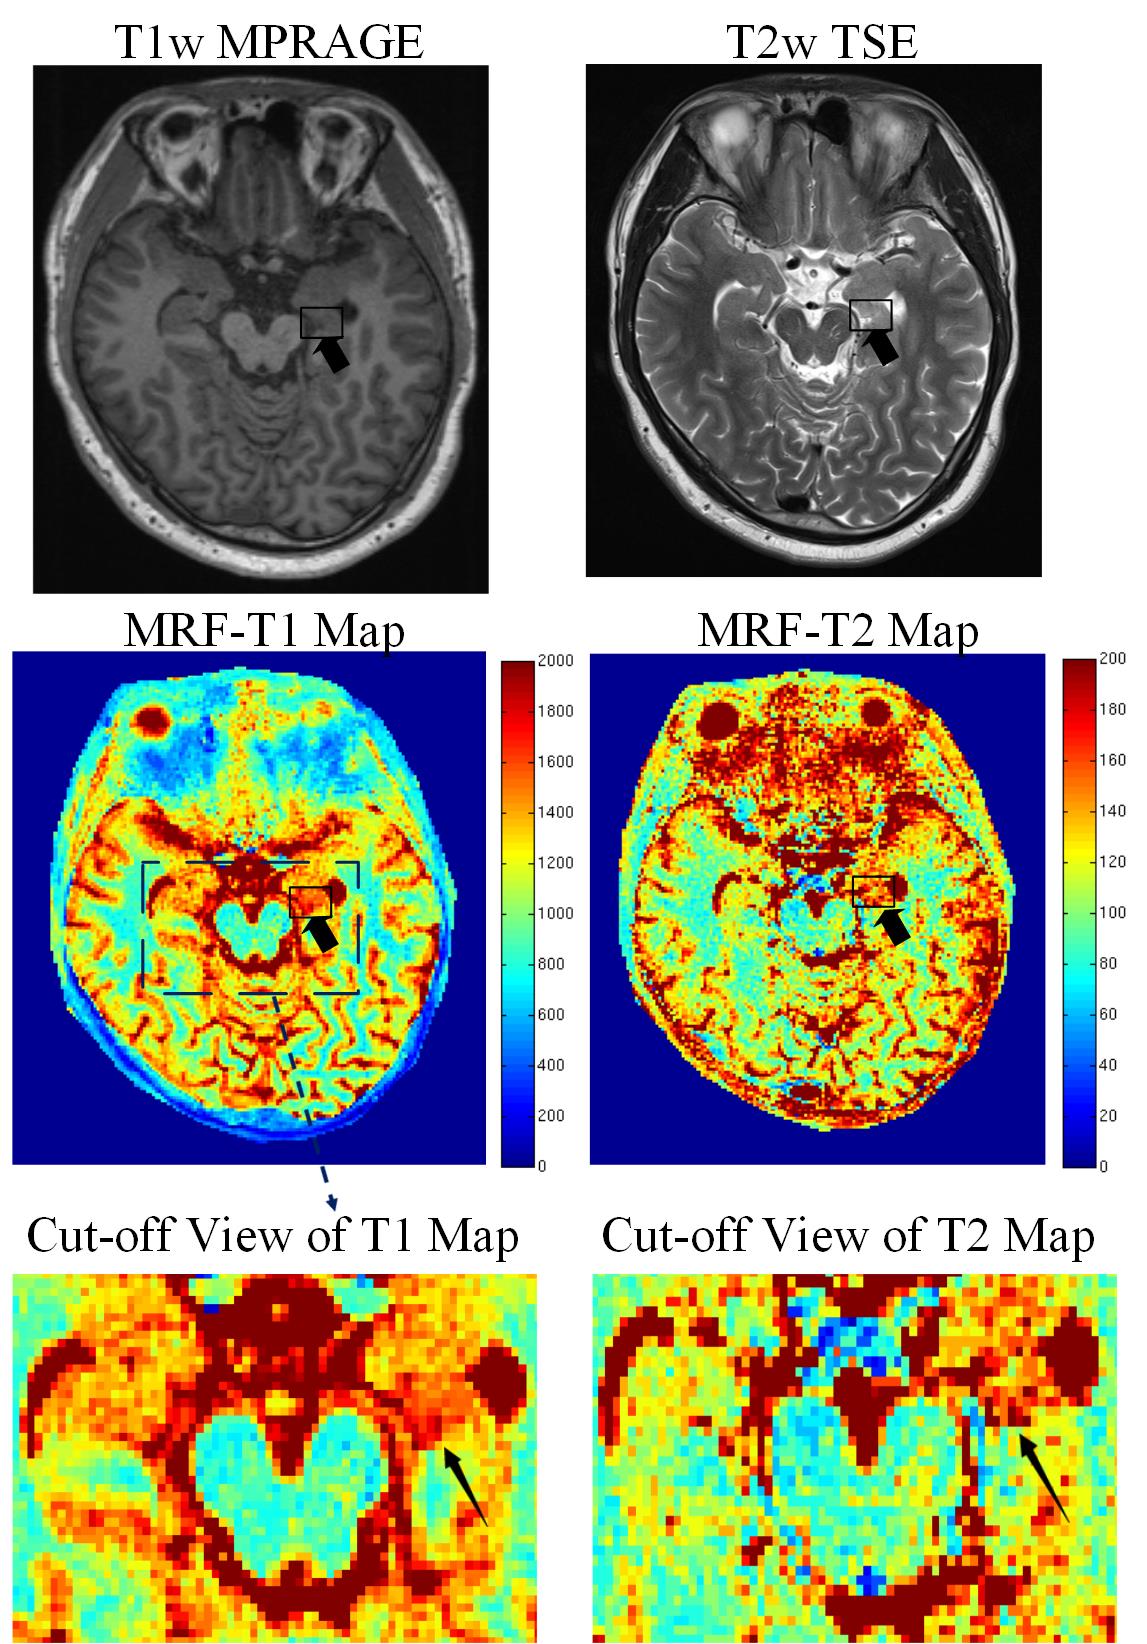
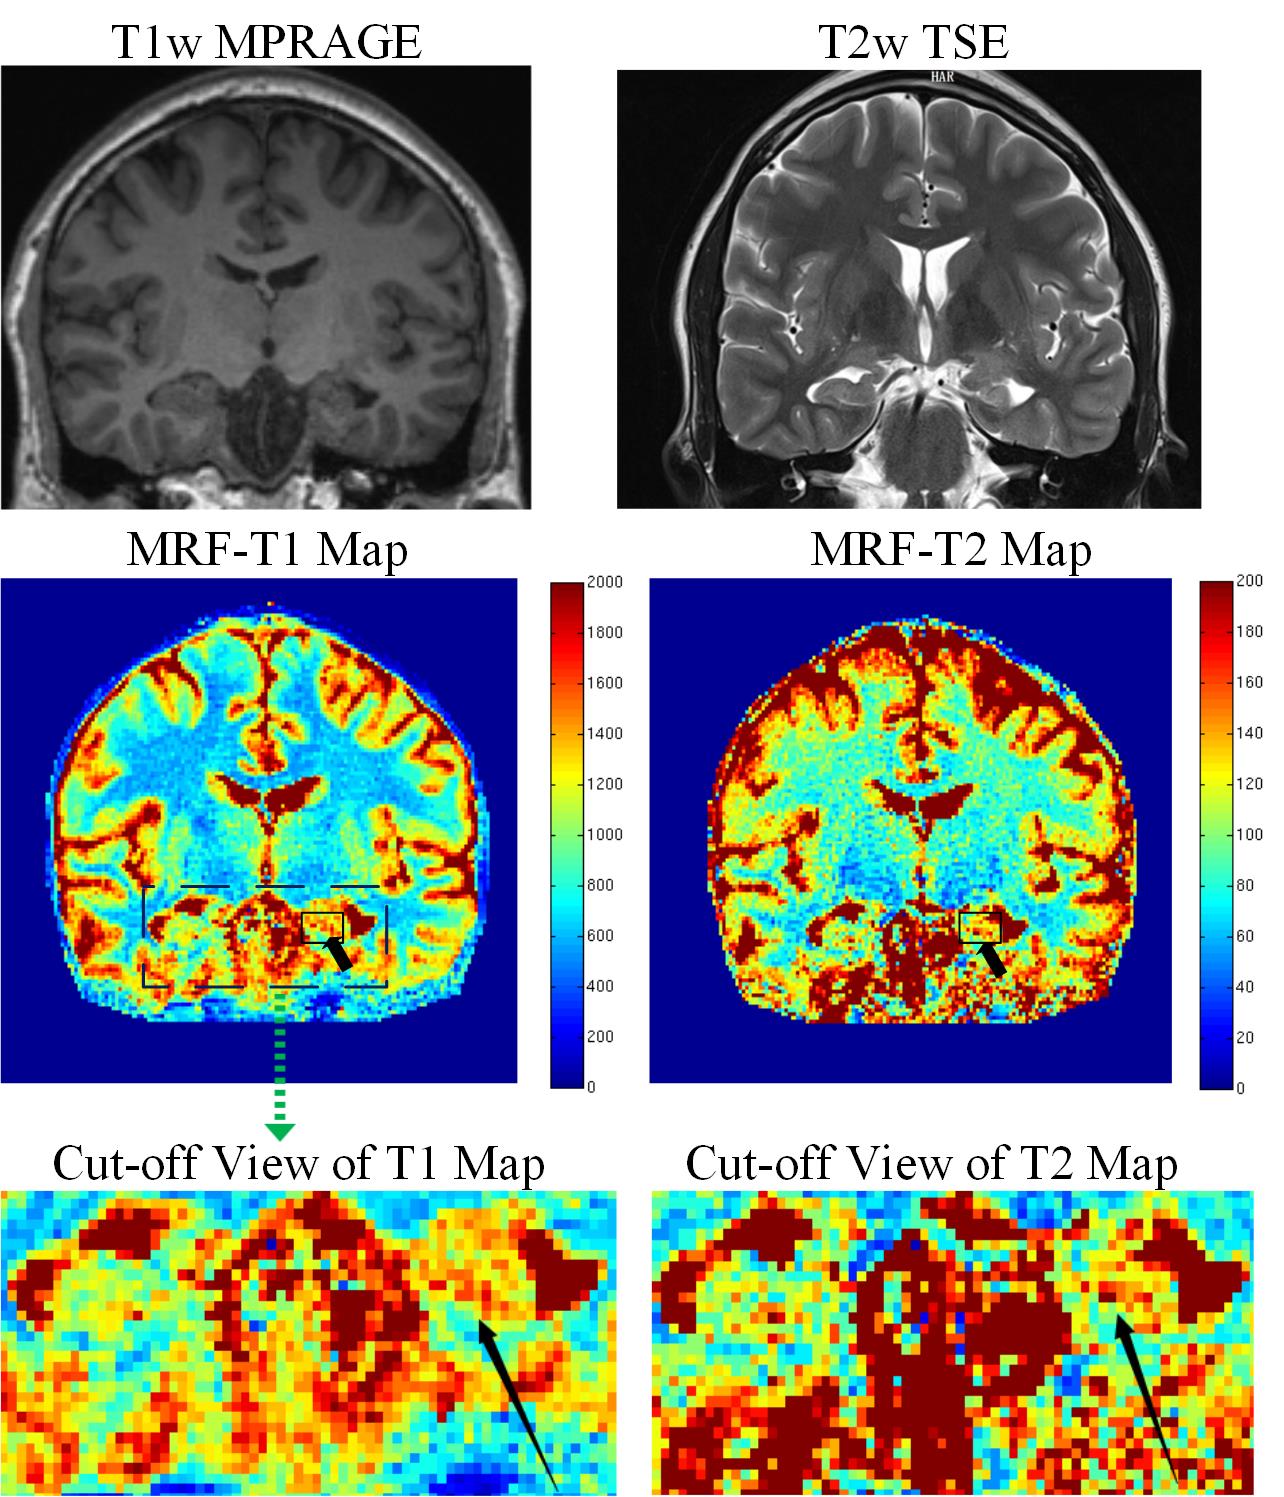
Figs.
1 and 2 show representative slices of the T1 weighted MPRAGE, T2 weighted TSE
and MRF results of a left-side unilateral MTLE patient, in transverse and
coronal positions, respectively. Cut-off views of hippocampi of both sides
are shown to see more details. It can be seen from all types of images that the
volume of temporal horn of lateral ventricle in left side increases because of the
atrophy of left hippocampus. As black boxes and arrows pointed in Figs. 1 and
2, T1 (with scale of 0~2000ms) and T2 (with scale of 0~200 ms) maps obtained by
FISP-MRF method provide detailed and quantitative information for higher T1 and
T2 values in the HS lesion compared with the contralateral hippocampus. The
prolonged relaxometry parameters reflect subtle changes of atrophic hippocampus.
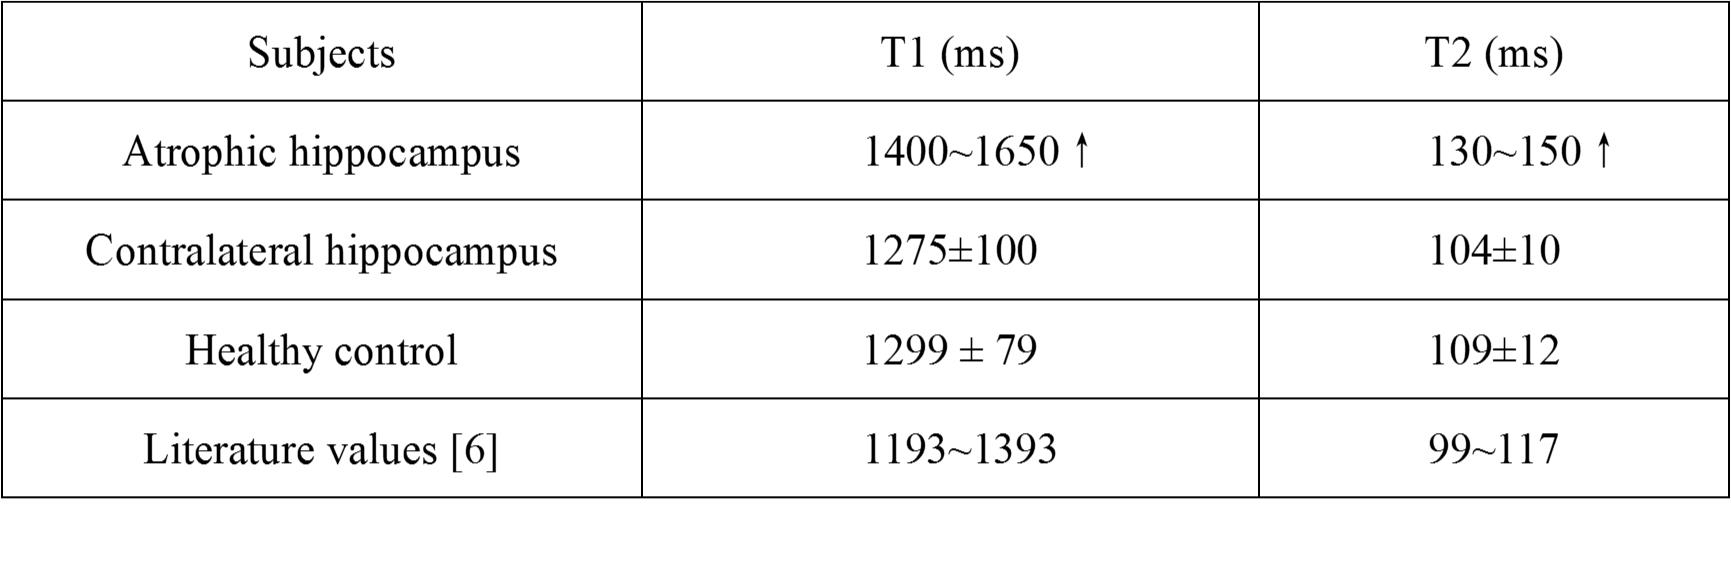
Furthermore, the quantitative imaging method also enables group analysis
between MTLE patients and healthy controls. Table 1 shows the comparison of T1
and T2 values between manually
selected possible HS lesions and contralateral tissue of 20 unilateral
MTLE patients, control group and literature values [6]. Note that
since 20 patients have different levels of HS, Tab.1 only shows the ranges of
T1 and T2 values of atrophic hippocampus. It can be seen that the relaxometry
parameters of the HS lesions are clearly out of range of normal tissue, while
both contralateral tissue of patients and temporal lobe of healthy volunteers
are within the range of literature values estimated by golden standard method.
The results demonstrate that MRF method can differentiate HS patients from
normals by displaying quantitative mappings rather than relying on contrast
images of routine scans.Conclusion
MRF method was applied for quantitative analysis of epilepsy, which provides T1 and T2 maps in short acquisition time with improving the accuracy and sensitivity of diagnoses. In this regard, MRF method could potentially aid multi-modality quantitative mapping of epilepsy patients in a clinical setting.Acknowledgements
No acknowledgement found.References
[1] Martin P, Bender B, Focke NK. Post-processing of structural MRI for individualized diagnostics. Quantitative imaging in medicine and surgery 2015; 5(2):188-203.
[2] Deoni S. Magnetic Resonance Relaxation and Quantitative Measurement in the Brain. Magnetic Resonance Neuroimaging: Methods and Protocols 2011:65-108.
[3] Ma D, Gulani V, Seiberlich N, Liu K, Sunshine JL, Duerk JL, Griswold MA. Magnetic resonance fingerprinting. Nature 2013;495(7440):187-192.
[4] Jiang Y, Ma D, Seiberlich N, Gulani V, Griswold MA. MR fingerprinting using fast imaging with steady state precession (FISP) with spiral readout. Magn Reson Med 2015;74(6):1621-1631.
[5] Cao X, Liao C, Wang Z, Chen Y, Ye H, He H, Zhong J. Robust Sliding-window Reconstruction for Accelerating the Acquisition of MR Fingerprinting. Magn Reson Med. 2016; DOI: 10.1002/mrm.26521.
[6] Wansapura J, Holland S, Dunn R, Ball W. NMR relaxation times in the human brain at 3.0 tesla. J Magn Reson Imaging 1999;9:531-538.
Figures