4539
The Anomalous Diffusion γ-parameter depends on local magnetic susceptibility differences when quantified in human brain tissue by MRI1SAIMLAL Dept., Morpho-functional Sciences, Sapienza University of Rome, Rome, Italy, 2CNR ISC UOS Roma Sapienza, Rome, Italy, 3MIRCen, Commissariat à l'Energie Atomique, France, Italy, 4Physics Department, CNR ISC UOS Roma Sapienza, Rome, Italy, 5ImpAct Team, Lyon Neuroscience Research Center, Lyon, France, France, 6SAIMLAL Dept., Morphogenesis & Tissue Engineering, Sapienza University of Rome, Rome, Italy, 7NeuroImaging Laboratory, Santa Lucia Foundation, Rome, Italy, 8Physics Dept., CNR ISC UOS Roma Sapienza, Rome, Italy
Synopsis
Motivated by previous results obtained in vitro, we investigated the dependence of the anomalous diffusion γ-parameter on local magnetic susceptibility differences (Δχ) in human brain. We performed diffusion weighted experiments varying diffusion gradient strengths in eight healthy subjects at 3.0T and measured the rate of relaxation (R2*). We found significant strong linear correlations between γ and R2* both in white and gray matter selected regions. Conversely, DTI-parameters did not correlate with R2*. Consequently AD-γ depends on Δχ due to differences in myelin orientation and iron content. This makes AD-imaging even more appealing for clinical neuroimaging investigations.
Purpose
This work was aimed at testing the dependence of the Anomalous Diffusion γ-parameter, evaluated using Diffusion Weighted (DW)-data at increasing diffusion gradient strengths (Gdiff), on the distribution of local magnetic susceptibility differences (Δχ) in human brain.Introduction
It is well known that DW signal decay is proportional to the Fourier Transform of the motion propagator1. Recently, referring to the theoretical framework of Continuous Time Random Walk2, we highlighted that the stretching γ-exponent of the function which best fits to DW-data acquired at high b-values is practically the Anomalous Diffusion (AD)-parameter that quantifies superdiffusion processes. However, the behavior of water in biological tissues with obstructions and restrictions is sub-diffusive rather than super-diffusive. Therefore we named this process ‘pseudosuperdiffusion’, because spins associated to water molecules do not perform a real super-diffusive motion, but their magnetization is further attenuated because of the additional dephasing due to internal gradients (Gint), originating by Δχ at the interfaces between compartments3-6. The human brain presents Δχ inhomogeneity in both White Matter (WM), owing to the local differences in myelinated axons orientation and Gray Matter (GM), due to different iron concentrations. Δχ inhomogeneity induces magnitude and phase variations in MRI signal, to which the rate of relaxation (R2*) is sensitive7,8. The assessment of Δχ in human brain is profitable since iron deposition is a hallmark of neurodegeneration9. Here we quantified AD-γ and investigated the correlation with R2* in 8 healthy volunteers.Methods
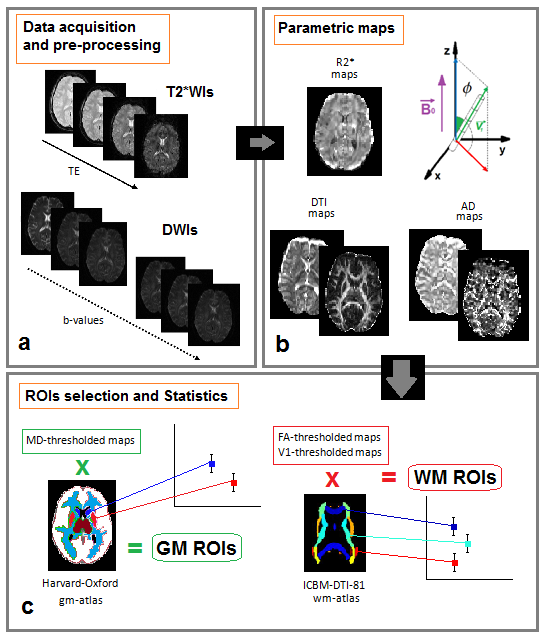
Eight healthy volunteers (4 males/4 females, mean ageSD=25$$$\pm$$$1years) were enrolled in the study, providing informed written consent. MRI was performed at 3.0T at Siemens Allegra Magnetom Scanner (Siemens Medical Solutions, Erlangen, Germany), equipped with a circularly polarized transmit-receive coil. T2*-weighted images (T2*WIs) were collected at TE=(10,20,35,55)ms with Echo Planar Imaging (EPI) sequence; DW-images (DWIs) were collected using 20 diffusion directions at b-values (100,200,300,400,500,700,800,1000,1500,2000,2500,3000,4000,5000)s/mm2, plus the b=0 (b0)-image, with a DW-Double-Spin-Echo-EPI (TR/TE=6400ms/107ms; Δ/δ=72ms/35ms). Thirty-two axial slices 3mm-thick, parallel to the anterior-posterior commissure were acquired (matrix size=128x128, in-plane resolution=1.8x1.8 mm2). Signal-to-Noise Ratio of DWIs was approximately 55 for GM, 25 for WM, and it was above 4 for the highest b-value10. Data-analysis is illustrated in Fig.1. We considered directional dependence of the -exponent and calculated AD-metrics following the method reported in De Santis et al.11. Standard atlases of WM and GM were adapted to subject’s native space, to extract Regions Of Interest (ROIs), and compute mean values$$$\pm$$$SD of the extracted parameters (Fig.1c). Δχ values of WM and GM ROIs12 and iron concentrations ([Fe]) of GM ROIs13 were taken from literature. Pearson’s correlation tests were performed, with P-values<0.05 considered as statistically significant.Results
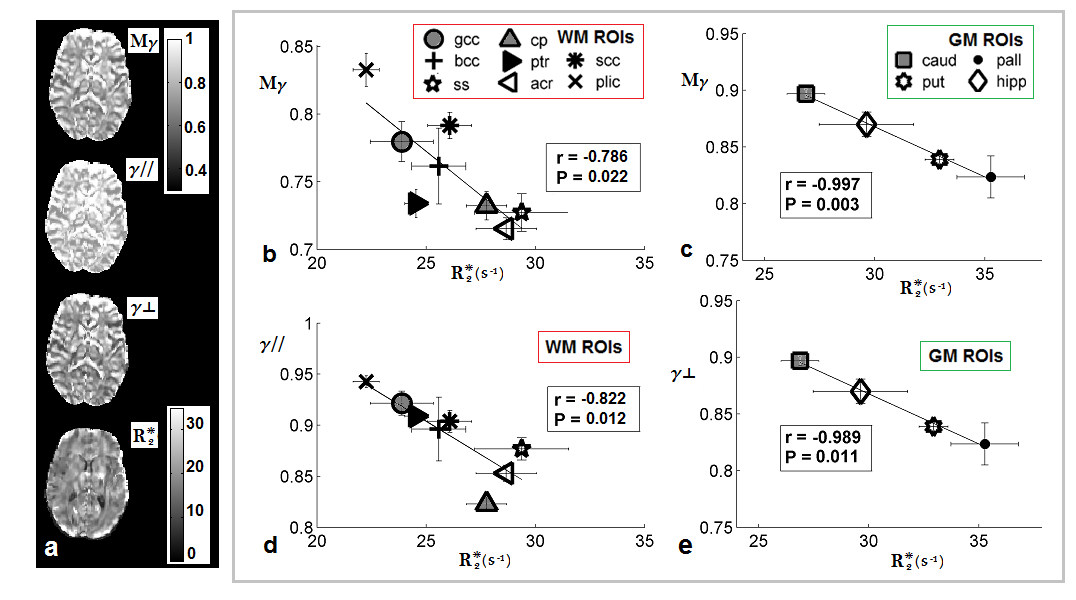
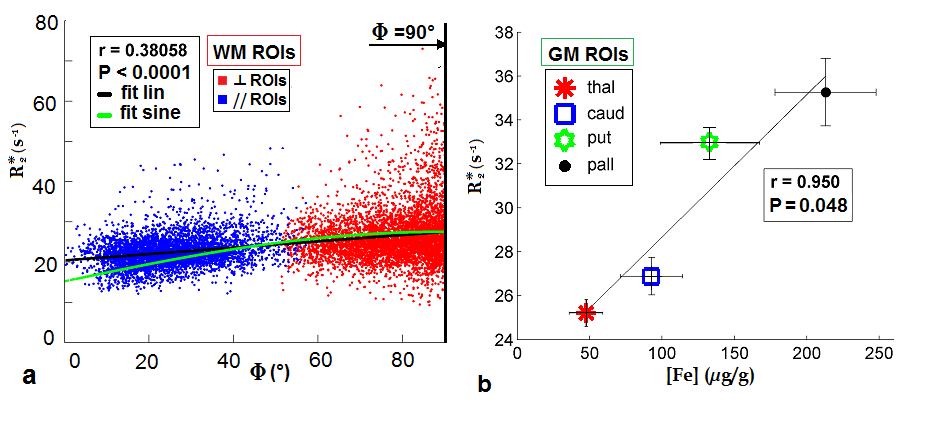
As shown in Fig.2 strong negative correlations between AD-metrics and R2* were found in both WM ROIs and GM ROIs (respectively, in WM Mγ:r=-0.786, P=0.022; γ//:r=-0.822,P=0.012; in GM Mγ:r=-0.997,P=0.003; γ$$$\bot$$$:r=-0.989,P=0.011). Conversely, DTI-metrics did not correlate with R2*. We also found a significant, albeit moderate(r=-0.381,P<0.0001), linear correlation between R2* and the orientation angle Ф in WM (Fig.3a) and a strong linear correlation (r=-0.950,P=0.05) between R2* and [Fe] in GM (Fig.3b). Furthermore we found a negative linear trend between R2*and Δχ in WM ROIs and a positive linear trend in GM ROIs, and an opposite trend of AD-parameters vs Δχ compared to R2*.Discussion
Previous in vitro experiments on phantoms with controlled Δχ3,4 showed that AD-γ was related to Gint. It was suggested that the use of diffusion gradients in MRI mimics superdiffusion of water molecules, and that water exhibits a pseudo-superdiffusion because of the indistinguishable additional phase shift associated to spins, due to Gint at the interfaces of regions with Δχ. In this work we found strong linear correlations between AD-metrics and R2* in both WM and GM ROIs in healthy human brain, on the contrary of DTI-metrics. Since we tested that R2* reflected differences in myelin orientation and iron content (in agreement with literature7,8), and we found that AD-metrics correlated with R2* and showed a linear trend vs Δχ in both WM and GM ROIs, we suggest that AD-metrics reflects local Δχ inhomogeneity in human brain. These results may have a clinical impact in the field of neuroimaging aimed at monitoring both microstructural changes in myelin and alterations due to iron accumulation. Indeed, abnormal iron deposition is linked to oxidative stress and neurodegenerative processes in human brain9.Conclusion
We found that the Anomalous Diffusion γ-parameter depends on local magnetic susceptibility inhomogeneity when evaluated by MRI in human brain at 3.0 T.Acknowledgements
No acknowledgement found.References
1. Callaghan, P.T. (1993). Principles of Nuclear Magnetic Resonance Microscopy, Oxford Science Publications, 328-419; 2. Metzler, R. Klafter, J. (2000). The random walk’s guide to anomalous diffusion: a fractional dynamics approach. Phys Rep. 339:1–77; 3. Palombo, M., Gabrielli A., De Santis S., et al. (2011). Spatio-temporal anomalous diffusion in heterogeneous media by nuclear magnetic resonance. Journ Chem Phys. 135, 034504; 4. Palombo, M., Gabrielli A., De Santis S. and Capuani S. (2012). The γ parameter of the stretched-exponential model is influenced by internal gradients: validation in phantoms. JMR 216:28-36; 5. De Santis, S., Rebuzzi, M. Di Pietro G., et al. (2010). In vitro and in vivo MR evaluation of internal gradient to assess trabecular bone density. Phys in med biol 55(19):5767; 6. Di Pietro, G., Palombo M. and S. Capuani. (2014). Internal magnetic field gradients in heterogeneous porous systems: comparison between Spin-Echo and Diffusion Decay Internal Field (DDIF) method. Appl Magn Res 45(8):771-784; 7. Rudko, D. A., Klassen L. M., de Chickera S. N., et al. (2014). Origins of R2∗ orientation dependence in gray and white matter. PNAS 111(1): E159-E167; 8. Gelman, N., Gorell J. M., Barker P. B., et al. (1999). MR imaging of human brain at 3.0 T: preliminary report on transverse relaxation rates and relation to estimated iron content. Radiology 210(3): 759-767; 9. Zecca, L., Youdim M. B., Riederer P., et al. (2004). Iron, brain ageing and neurodegenerative disorders. Nature Reviews Neuroscience 5(11): 863-873; 10. Jones, D. K., Knösche T. R. and Turner R. (2013). White matter integrity, fiber count, and other fallacies: the do's and don'ts of diffusion MRI. Neuroimage 73:239-254; 11. De Santis, S., Gabrielli A., Bozzali M., et al. (2011). Anisotropic anomalous diffusion assessed in the human brain by scalar invariant indices. MRM 65(4):1043-1052; 12. Li, W., Wu B. and Liu C. (2011). Quantitative susceptibility mapping of human brain reflects spatial variation in tissue composition. Neuroimage 55(4):1645-1656; 13. Hallgren, B. and Sourander P. (1958). The effect of age on the non-heme iron in the human brain. Journal of neurochemistry 3(1):41-51
Figures