4537
Learning how to see the invisible - using machine learning to find underlying abnormality patterns in reportedly normal MR brain images from patients with epilepsy1Translational Imaging Group, Centre for Medical Image Computing, University College London, London, United Kingdom, 2Department of Clinical and Experimental Epilepsy, UCL Institute of Neurology, London, United Kingdom, 3Epilepsy Society MRI Unit, Chalfont St Peter, United Kingdom
Synopsis
The visual identification of subtle abnormalities in MR brain images that underlie focal epilepsies is a challenging problem. In this study, we used machine learning techniques to uncover patterns of abnormality that exist within reportedly normal brain images from individuals with epilepsy. Our results demonstrated that abnormalities exist in MR images reported to be normal by a human reader, and that these abnormalities exist in a different spatial pattern to that seen in visually apparent cases. We obtained novel insights into why visual assessment may be ineffective in these visually normal cases and provide suggestions on how to improve this situation.
Introduction
Focal epilepsy is a serious neurological disease characterised by recurrent seizures. In patients who do not respond to medication neurosurgical treatment can be considered. If the abnormal, ‘epileptogenic’ region within a patient’s brain can be identified and then surgically removed it is often possible to completely cure a patient’s epilepsy1.
Visual inspection of MRI scans is normally used to identify these areas, providing accurate localisation in about 2/3 of cases. In the remaining third no abnormality is visually apparent2. Such patients are known as MR negative. It is now thought that these MR negative images do contain abnormalities but they are too subtle to be picked up visually3.
This study sought to demonstrate that feature importance measurements can be used to gain insight into why visual assessment is failing in MR negative cases. The subjects in this study had temporal lobe epilepsy (TLE) and the task of correctly lateralising the seizure origin (to the left or right temporal lobe) was considered.
Methods
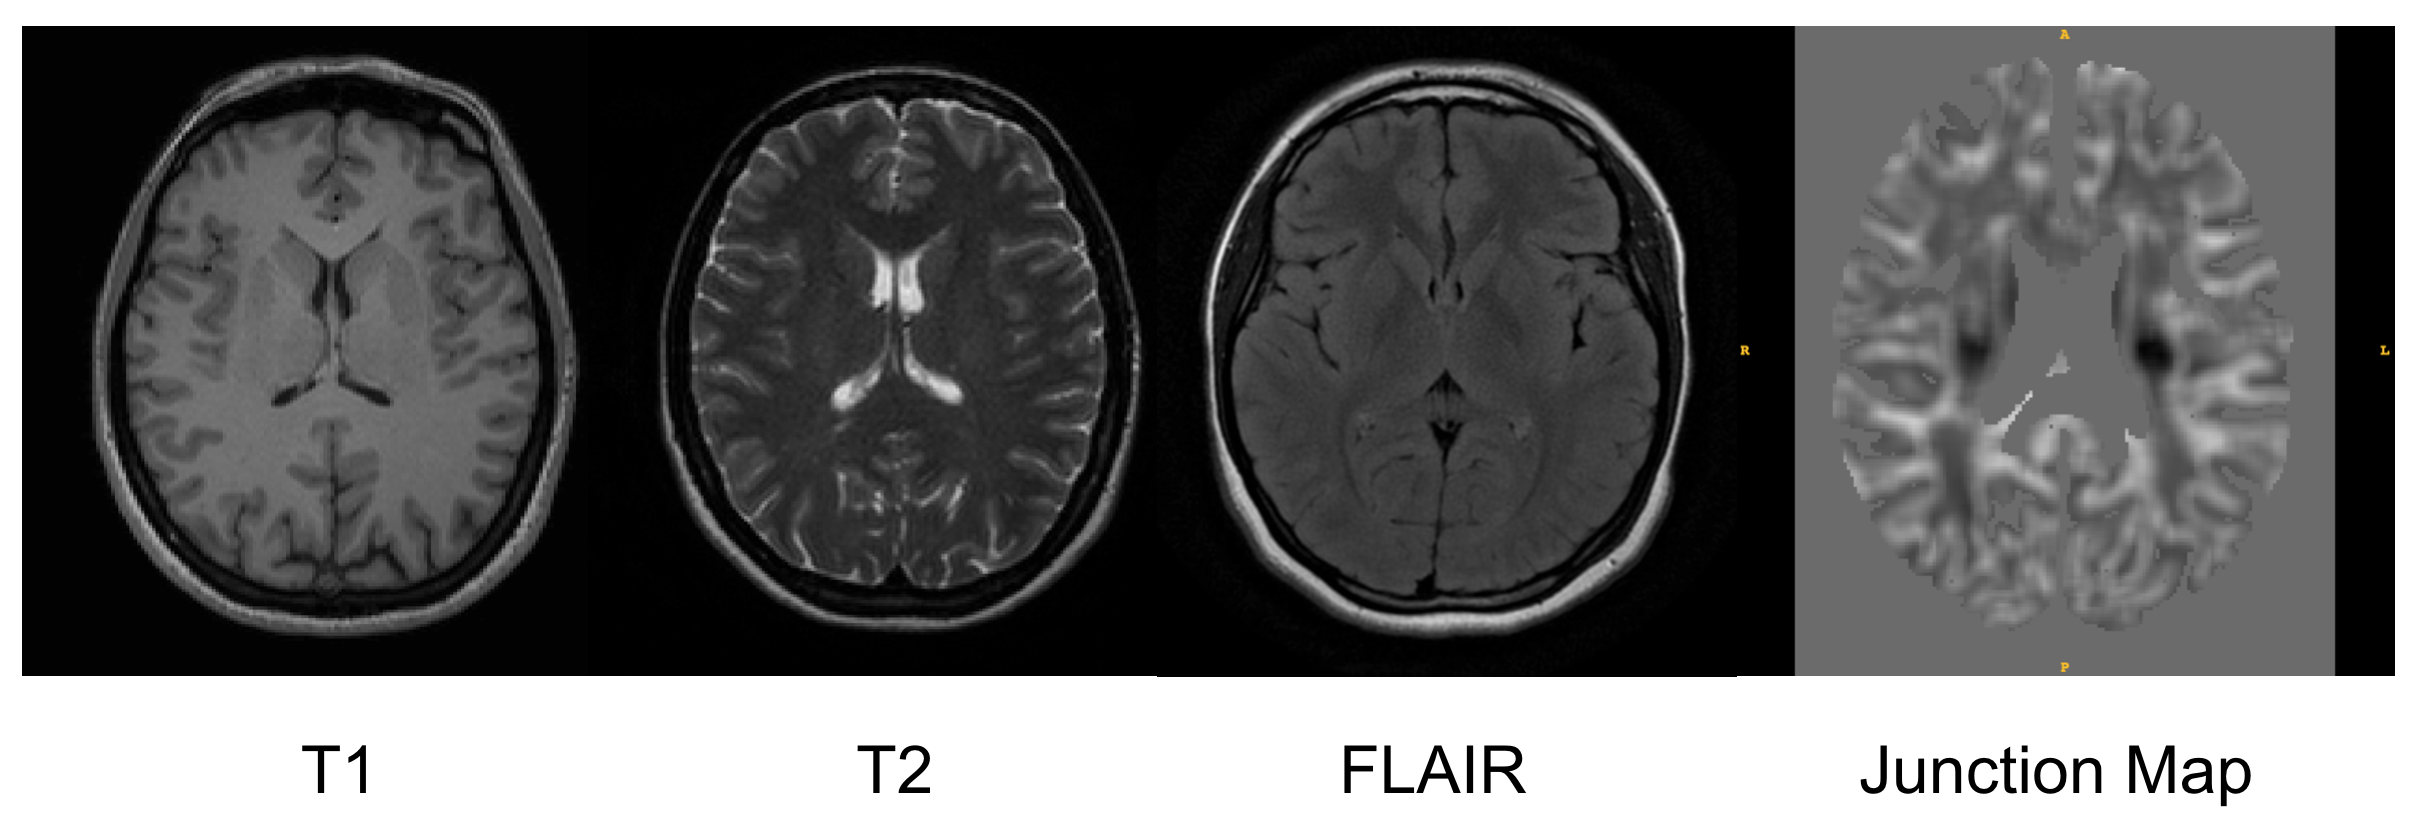
A dataset containing 99 subjects with TLE was used in this MR study (82 MR positive, 17 MR negative). All the subjects had a known lateralisation of seizure origin (from clinical assessment, EEG, and sometimes imaging studies) and had image volumes from 3 different MR modalities available (T1, T2, FLAIR) along with Junction Maps4,5 - see Figure 1. All MR negative images had been reported as normal by a consultant neuroradiologist.
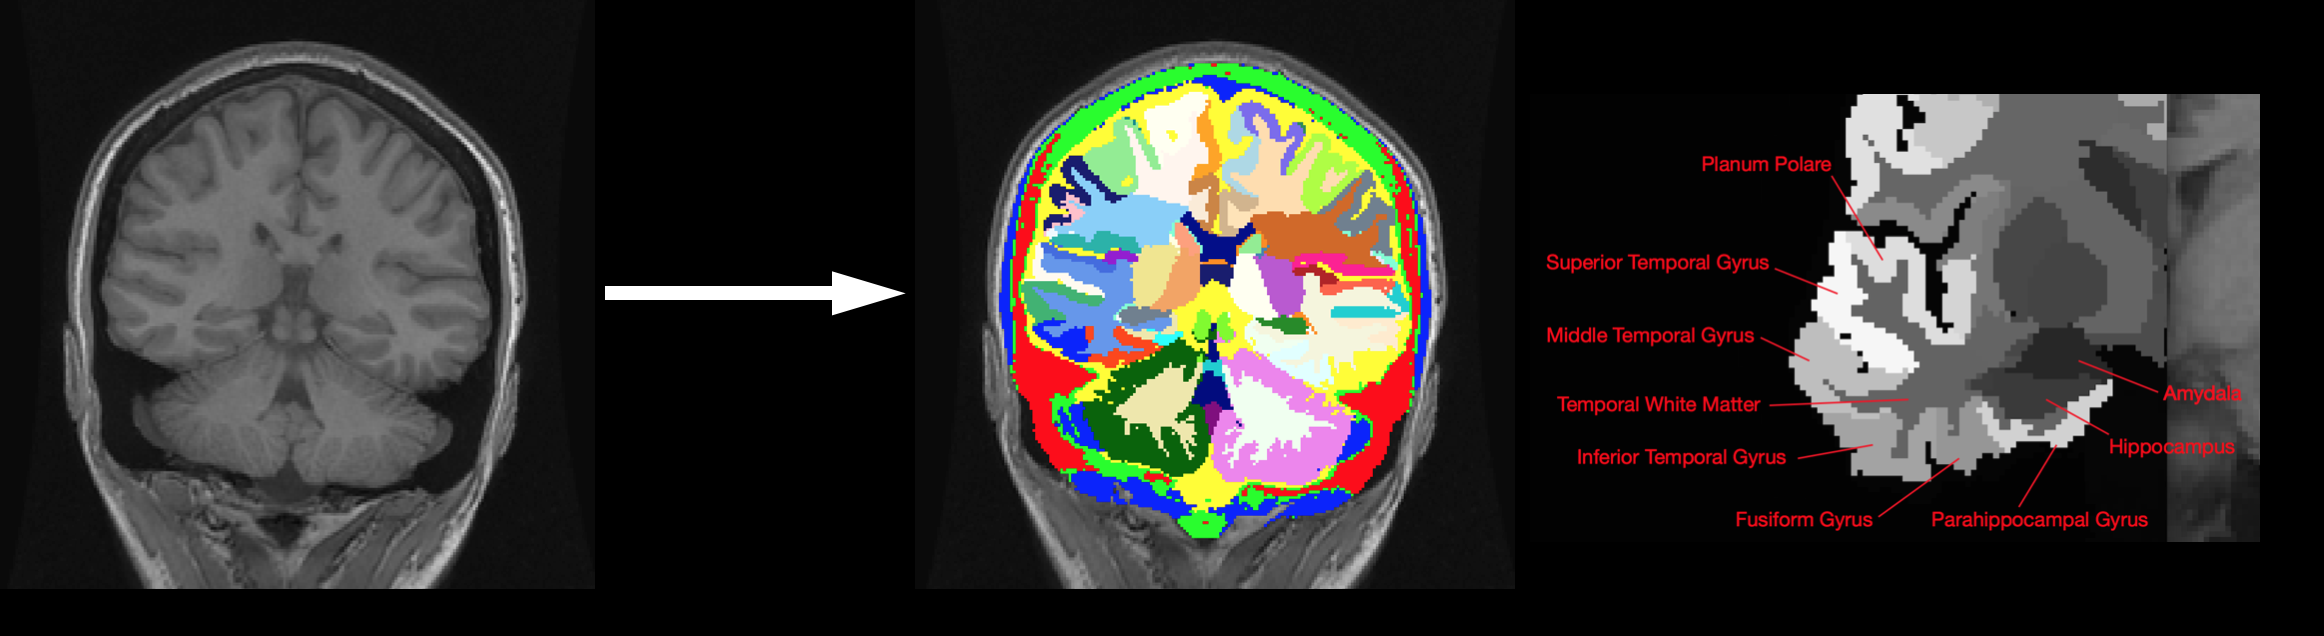
Each brain was parcellated using the GIF method6 (Figure 2). Features from each modality originating from each of the 13 temporal lobe regions parcellated by GIF were used. Each region had each of the following features computed:
1) Normalised mean intensity difference between left and right
2) Normalised intensity standard deviation difference between left and right
3) Ratio of region volume between left and right
A random forest classifier was then trained on these features (10,000 trees). A relative measurement of feature importance was obtained for each feature by measuring the drop in Gini impurity provided by a split in that feature (weighted by the chance of reaching that split) averaged across each tree in the forest. This produced an ordered list of the features ranked by importance along with quantitative measurements of each feature's importance. Using this information we created visualisations, which we call Importance Maps, demonstrating the spatial pattern of abnormality across the temporal lobe. Importance Maps were generated from the MR positive cases and the MR negative cases separately. The accuracy of a non-linear support vector machine using ascending numbers of the ordered features (top N features for N = 1,…,118) for lateralisation was then assessed using Bolstering7.
Results
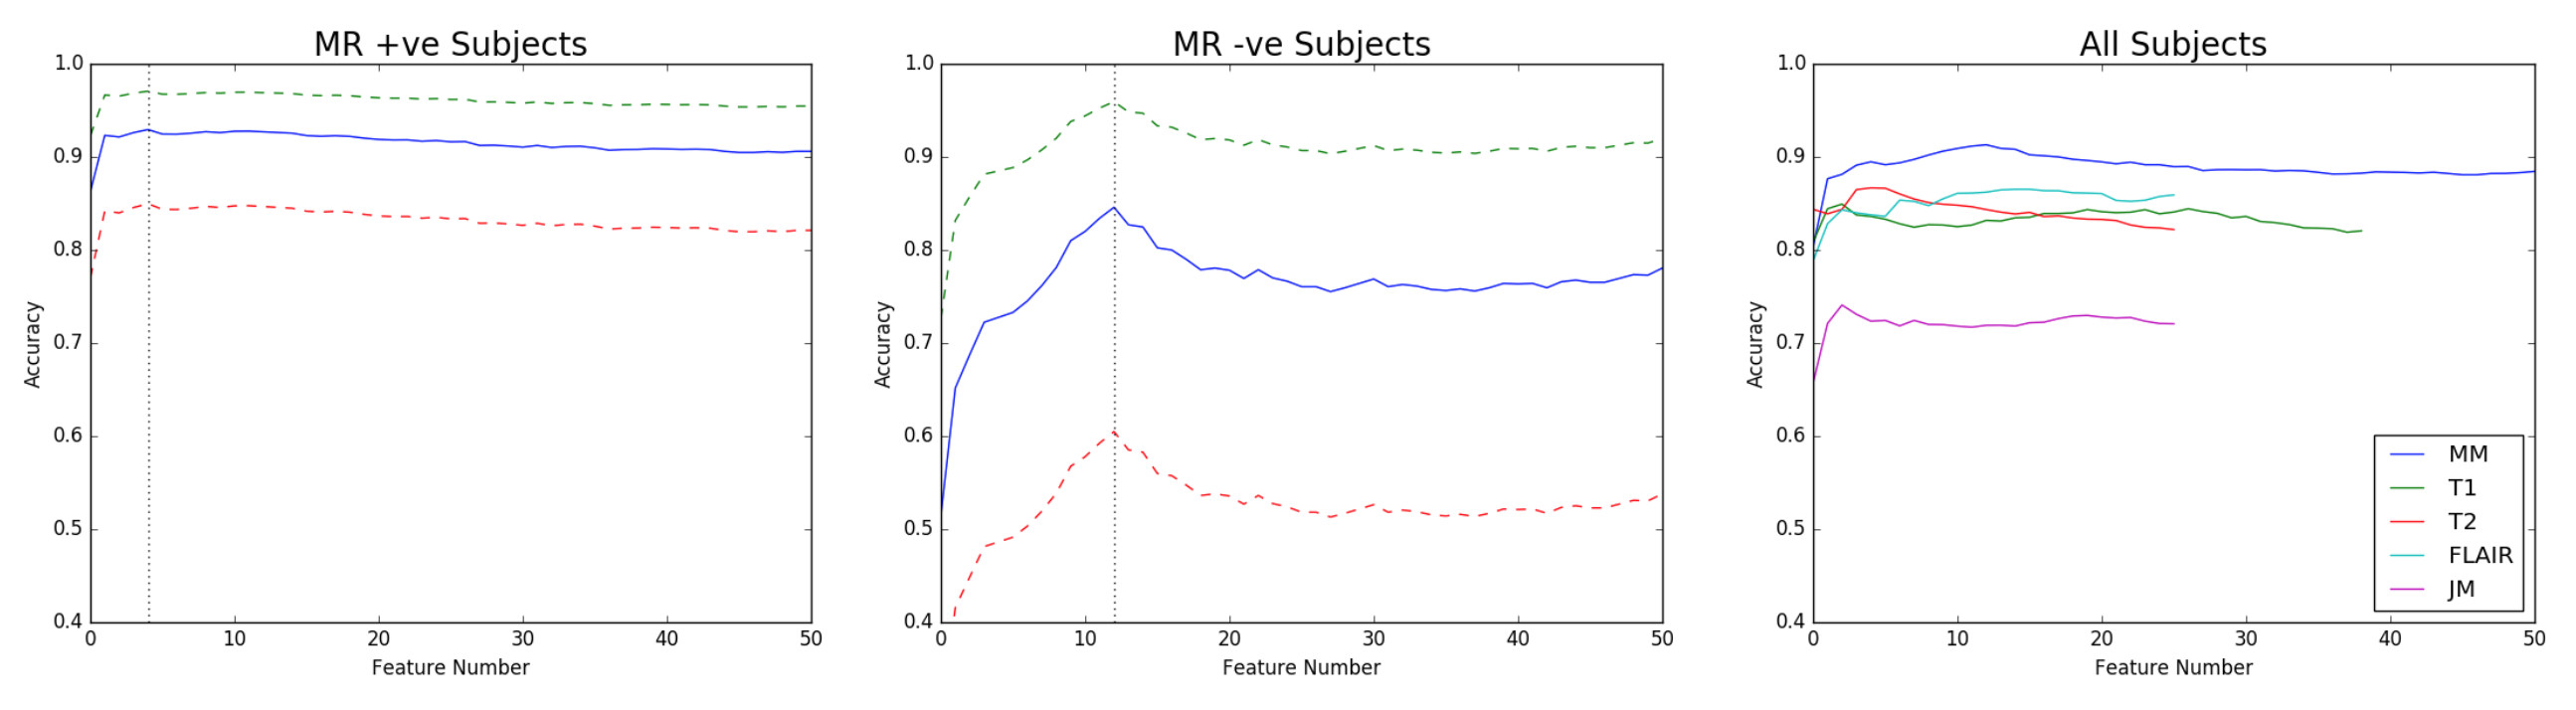
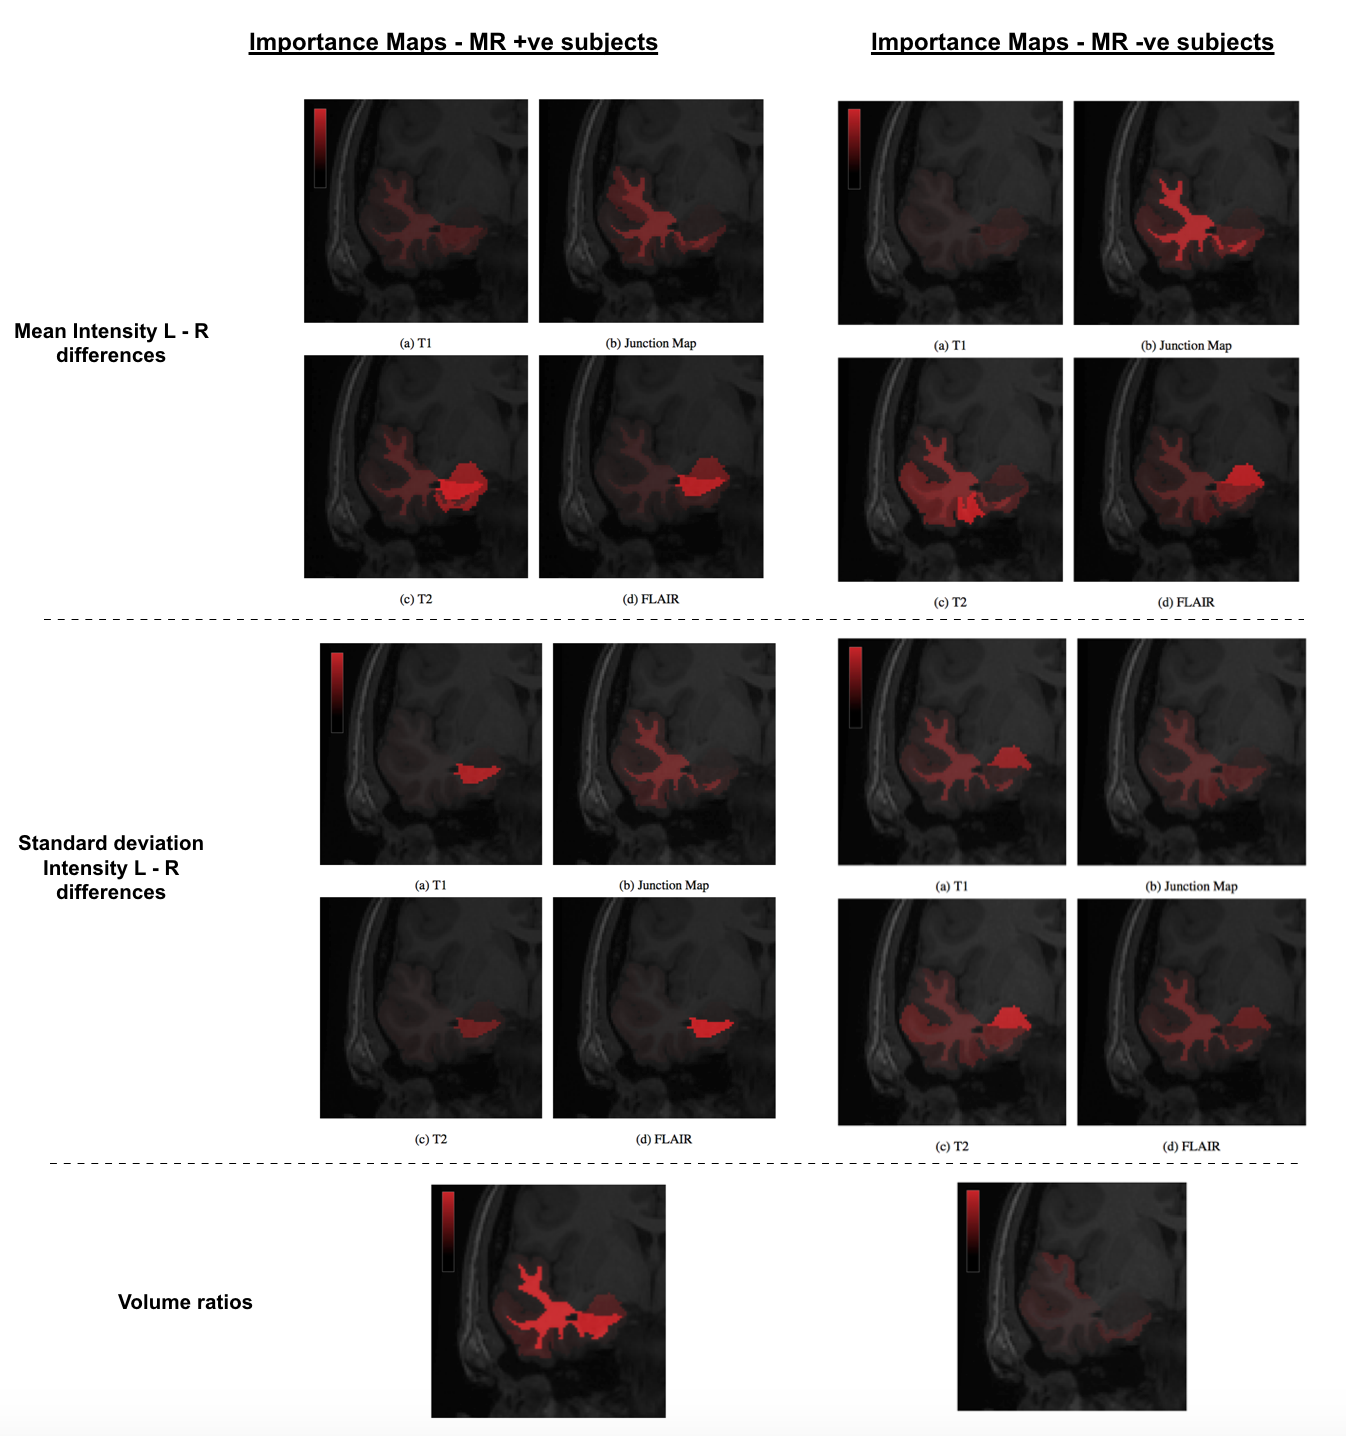
Figure 3 demonstrates the accuracies achievable in the MR positive and MR negative subgroups by a non-linear SVM as well as the accuracy achieved in the whole dataset using individual modalities. A maximum mean accuracy of 92.9% was achievable in the MR positive subjects and 84.6% in the MR negative subjects. Figure 4 shows all the Importance Maps generated for each type of image feature from different parts of the temporal lobe in the MR positive and the MR negative subgroups. Three immediate observations can made:
1) All the volume changes typically seen in MR positive cases across the temporal lobe are essentially absent in MR negative cases.
2) The typical abnormalities in the hippocampus seen here in the MR positive cases are absent in the MR negative cases.
3) Abnormalities in the amygdala, by contrast, are much more discriminative in the MR negative cases than the MR positive cases. T2 and FLAIR signal features from the amygdala appear particularly important.
Discussion
The most important results from this study are the patterns of abnormality visible in the Importance Maps. These maps (in conjunction with the demonstrated lateralisation accuracies possible using the features) not only demonstrate that abnormalities exist in at least some of the apparently visually normal MR negative images, but also that this pattern of abnormality has a number of important differences from the readily recognised pattern seen in the MR positive cases.
The hippocampus is often focused on by radiologists performing lateralisation visually8 since hippocampal sclerosis is a common cause of TLE. The observed differences between these Importance Maps suggest that human readers should focus more attention on certain non-hippocampal areas, such as the amygdala and fusiform gyrus, in cases of TLE that seem difficult to lateralise visually. More generally, this demonstrates that feature importance measurements such as this can provide an elegant way of characterising patterns of image abnormality that have previously eluded visual detection.
Acknowledgements
This work is supported by the EPSRC-funded UCL Centre for Doctoral Training in Medical Imaging (EP/L016478/1) and the Department of Health’s NIHR-funded Biomedical Research Centre at University College London Hospitals.
We are grateful to the Wolfson Foundation and the Epilepsy Society for supporting the Epilepsy Society MRI scanner. This work is also supported by the EPSRC, the MRC and the EU-FP7 project VPH-DARE@IT. GPW was supported by an MRC Clinician Scientist Fellowship (MR/M00841X/1).
References
1. Spencer S, Huh L. Outcomes of epilepsy surgery in adults and children. The Lancet Neurology. 2008 Jun 30;7(6):525-37.
2. Duncan JS, Winston GP, Koepp MJ, Ourselin S. Brain imaging in the assessment for epilepsy surgery. The Lancet Neurology. 2016 Apr 30;15(4):420-33.
3. Bien CG, Szinay M, Wagner J, Clusmann H, Becker AJ, Urbach H. Characteristics and surgical outcomes of patients with refractory magnetic resonance imaging–negative epilepsies. Archives of Neurology. 2009 Dec 1;66(12):1491-9.
4. Huppertz HJ, Grimm C, Fauser S, Kassubek J, Mader I, Hochmuth A, Spreer J, Schulze-Bonhage A. Enhanced visualization of blurred gray–white matter junctions in focal cortical dysplasia by voxel-based 3D MRI analysis. Epilepsy research. 2005 Nov 30;67(1):35-50.
5. Huppertz HJ, Wellmer J, Staack AM, Altenmüller DM, Urbach H, Kröll J. Voxel-based 3D MRI analysis helps to detect subtle forms of subcortical band heterotopia. Epilepsia. 2008 May 1;49(5):772-85.
6. Cardoso MJ, Modat M, Wolz R, Melbourne A, Cash D, Rueckert D, Ourselin S. Geodesic information flows: spatially-variant graphs and their application to segmentation and fusion. IEEE transactions on medical imaging. 2015 Sep;34(9):1976-88.
7. Mendelson AF, Zuluaga MA, Hutton BF, Ourselin S. Bolstering Heuristics for Statistical Validation of Prediction Algorithms. InPattern Recognition in NeuroImaging (PRNI), 2015 International Workshop on 2015 Jun 10 (pp. 77-80). IEEE.
8. Woermann FG, Vollmar C. Clinical MRI in children and adults with focal epilepsy: a critical review. Epilepsy & Behavior. 2009 May 31;15(1):40-9.
Figures