4524
Increased regional cerebral venous oxygen saturation in mild traumatic brain injury is correlated with neurophysiological function: a magnetic susceptibility mapping study1Radiology Department, Tianjin First Central Hospital, Tianjin, People's Republic of China, 2Department of Nuclear Medicine, Cangzhou Central Hospital
Synopsis
The aim of this study is to explore the changes of regional cerebral venous oxygen saturation (SvO2) in patients with mild traumatic brain injury (mTBI) using susceptibility mapping (SWIM). SWIM was reconstructed from magnitude and phase data of SWI to measure the susceptibility of cerebral veins in mTBI patients and healthy controls. The results suggested that overall regional cerebral SvO2 was higher in mTBI patients than controls. The regional cerebral SvO2 shows that decreased to normal levels along with an increase in elapsed time post trauma and a high-SvO2 condition is an evidence of neurophysiological deficit.
PURPOSE
Mild traumatic brain injury (mTBI) affects over 1.7 million people each year in the United States1. The most common imaging for mTBI is routine MRI exam. However, in most cases, MRI exams appear normal. Previous studies have shown that an abnormal cerebral venous oxygen saturation (SvO2) value could reflect changes in the energy demand of traumatized cerebral tissues2. Therefore, the early detection of cerebral SvO2 may play an important role in better diagnosing mTBI. Recently, susceptibility mapping (SWIM) has been introduced to evaluate cerebral SvO23. However, no existing literature has reported the relationship between cerebral SvO2 levels and different periods of elapsed time post trauma (ETPT), and between SvO2 levels and neurophysiological function. In this study, we aim to assess the changes in regional cerebral SvO2 in mTBI patients using SWIM and to investigate the correlation between this parameter, ETPT, and neurophysiological function.METHODS
48 mTBI patients and 32 healthy controls (HCs) participated in this study. The inclusion criteria were made based on the definition of mTBI by the American Congress of Rehabilitation Medicine4. The patients were then divided into an axonal injury (AI) group (16 patients) and non-AI group (32 patients) depending on the imaging-based evidence of AI. MRI data were collected on a MAGNETOM Trio Tim 3T MR scanner (Siemens, Erlangen, Germany) and included a routine head scan and susceptibility-weighted imaging (SWI). The parameters of SWI were: TR/TE=27/20ms; field of view=230×200mm2; receiver bandwidth=120 Hz/pixel; flip angle=15°; number of slices=56; acquisition time=179 sec; voxel resolution=0.5×0.5×2mm³. SWIM was reconstructed based on both the phase and magnitude data using an in-house-developed SMART (Susceptibility Mapping and Phase Artifacts Removal Toolbox, Detroit, Michigan, USA) software. The susceptibility of bilateral cerebral veins (cortical veins, thalamostriate veins, septum pellucidum veins, internal veins, basal veins) and the straight sinus were measured using another in-house-developed software SPIN (signal processing in nuclear magnetic resonance, Detroit, Michigan, USA) (Fig. 1). The changes of regional cerebral SvO2 were calculated using the susceptibility of veins in mTBI patients and HCs according to the equations [ ∆Xvein-tissue=∆Xdo.Hct (1-Y) and ΔYnp = -(1-Yn)ΔXnp/Xn ]3. The agreement between the vein susceptibility from the HCs in our study and that of the normal subjects as reported by Doshi et al.2was calculated using Pearson’s correlation. The differences in vein susceptibility among AI, non-AI, and HC groups were explored using non-parametric testing. The difference in the ETPT and the Rivermead Post-Concussion Symptoms Questionnaire (RPQ) scores between the AI and non-AI groups was calculated using the Mann-Whitney U test and an independent-sample t-test. The correlations between the susceptibility of the cerebral veins in the AI and non-AI groups and either ETPT or RPQ scores were calculated using a Pearson’s or Spearman’s correlation.RESULTS
The susceptibility of cerebral veins was highly consistent with that of normal controls as reported by Doshi et al.’s study2 (r=0.914, P=0.011) (Fig. 2). There was a significant difference in the susceptibility of the straight sinus among the three groups (p=0.000) (Fig. 3). The susceptibility of the straight sinus in the non-AI (256±35, P=0.000) and AI (265±61, P=0.004) groups was significantly lower than that in the HC group (311±43) (Fig. 4). The SvO2 of the straight sinus in non-AI and AI patients increased by 5.32% and 4.42%, respectively. In the non-AI group, the susceptibility of the straight sinus significantly positively correlated with ETPT (r=0.514, P=0.006) and in the AI group, the susceptibility of the straight sinus negatively correlated with the RPQ scores (r=-0.582, P=0.018) (Fig. 5).DISCUSSION
Our results do not indicate a significant difference in the susceptibility of the straight sinus between the AI and non-AI patient groups. The reason for this may be that the time at which the change is measured is critical. Since the ETPT for the non-AI group was 51 hours and was much shorter than the 110 hours in the AI group, the oxygenation levels may have recovered to a level similar to that of the AI group. This is supported in part by the fact that we found that susceptibility in the non-AI group increased with increasing ETPT. In other words, in the non-AI group, the SvO2 decreased with increasing ETPT. Our study also suggests that increased cerebral SvO2 indicates impaired neurophysiological functioning. This may be due to reduced consumption of oxygen at the tissue level after injury which may translate into impaired neurophysiological function.CONCLUSION
The results of this study suggest that SWIM is a useful tool to assess cerebral SvO2. A decreased susceptibility of the straight sinus (indicating increased SvO2) appears to correlate with brain function deficits in mTBI patients.Acknowledgements
The contribution of each author to the work was listed as followed: Chao Chai (C.C.): substantial contributions to conception and design, acquisition of data, or statistical analysis and interpretation of data; drafting the abstract; Chao Zuo (C.Z.): acquisition of data, or analysis and interpretation of data; Linlin Fan (L.L.F.): contributions to conception and design; statistical analysis and interpretation of data; Tianyi Qian (T.Y.Q.): analysis and interpretation of data; E Mark Haacke (E.M.H.): substantial contributions to conception and design; analysis and interpretation of data; revising it critically for important intellectual content; Wen Shen (W.S.) and Shuang Xia (S.X.): substantial contributions to conception and design; agreement to be accountable for all aspects of the work in ensuring that questions related to the accuracy or integrity of any part of the work are appropriately investigated and resolved.References
1. Faul M, Xu L, Wald M, Coronado V. Traumatic Brain Injury in the United States: Emergency Department Visits, Hospitalizations, and Deaths, 2002–2006. Atlanta (GA): Centers for Disease Control and Prevention, National Center for Injury Prevention and Control, 2010.
2. Doshi H, Wiseman N, Liu J, et al. Cerebral hemodynamic changes of mild traumatic brain injury at the acute stage. PLoS One 2015;10(2):e0118061.
3. Haacke EM, Tang J, Neelavalli J, Cheng YC. Susceptibility mapping as a means to visualize veins and quantify oxygen saturation. J Magn Reson Imaging. 2010 Sep;32(3):663-76.
4. American Congress of Rehabilitation Medicine. Definition of mild traumatic brain injury. J Head Trauma Rehabil 1993;8:86-88.
Figures
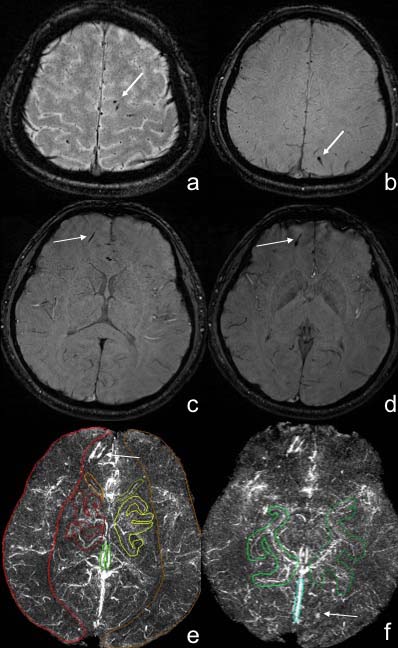
Fig. 1 The measurement of the susceptibility value of major cerebral veins in mTBI patients using SWIM
Fig. a-d male, 25 years old, stuck by vehicle, Some dot-like, strip-like low signal was shown in the subcortex of bilateral parietal lobes, right frontal lobe in the SWI images, which was diagnosed as axonal injury (white arrows). Fig. e-f showed the volume of interests of cerebral veins for the measurement of susceptibility in SWIM images. The axonal injury lesions showed high signal (white arrows).
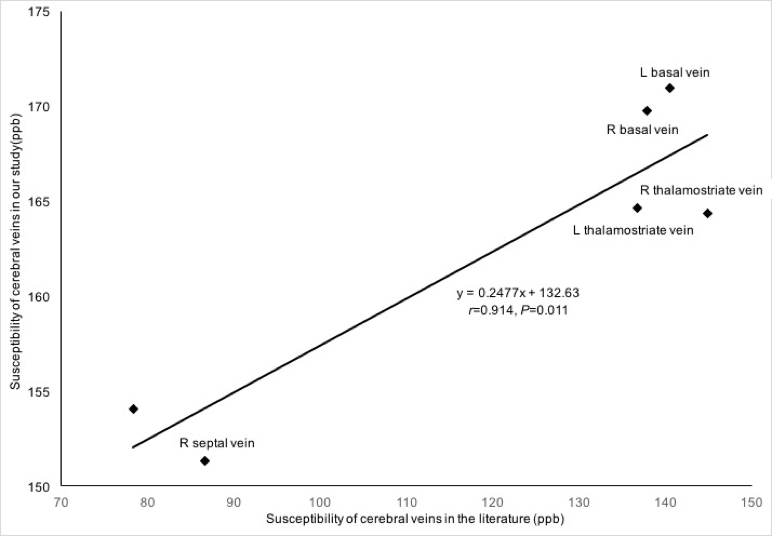
Fig. 2 The correlation between the susceptibility of cerebral veins in our study and in Doshi et al.’s study.
The susceptibility of each major cerebral vein including bilateral septal veins, thelamostriate veins, and basal veins from HCs measured in our study were highly consistent with the susceptibility measured in Doshi et al.’s study. (r=0.914, P=0.011)
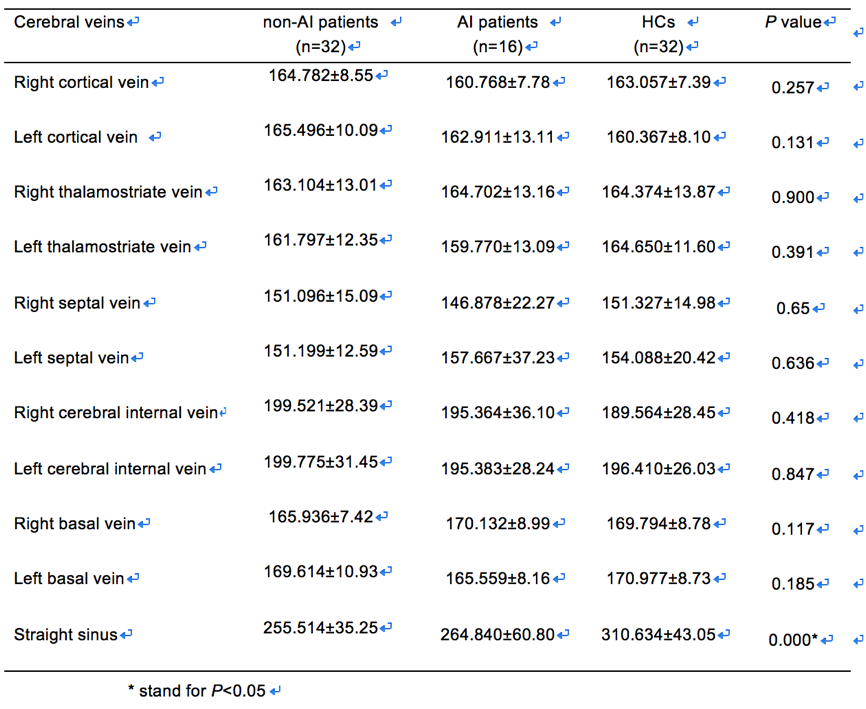
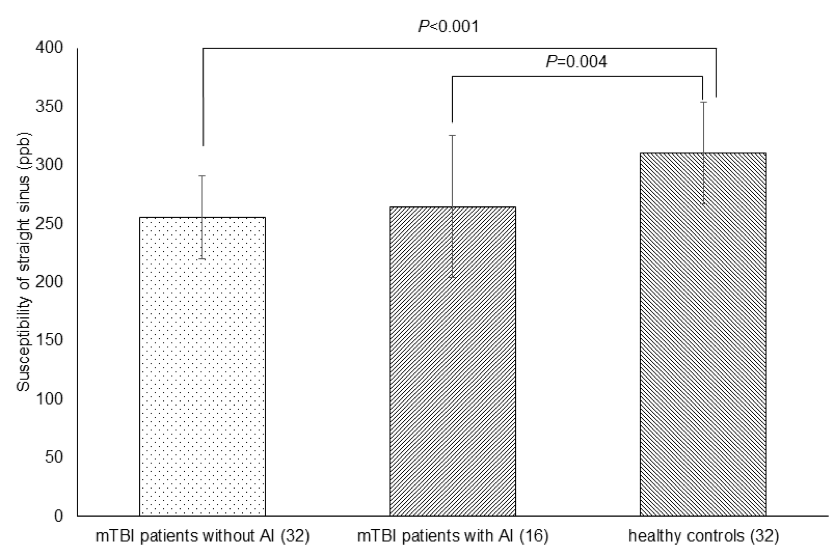
Fig. 3 The difference in susceptibility of straight sinus among non-AI and AI patients and HCs
The susceptibility of the straight sinus in the non-AI group (256±35) was significantly lower than that of the healthy control group (311±43) (P<0.001); the susceptibility of the straight sinus in the AI group (265±61) was significantly lower than that of the HC group (311±43) (P=0.004).
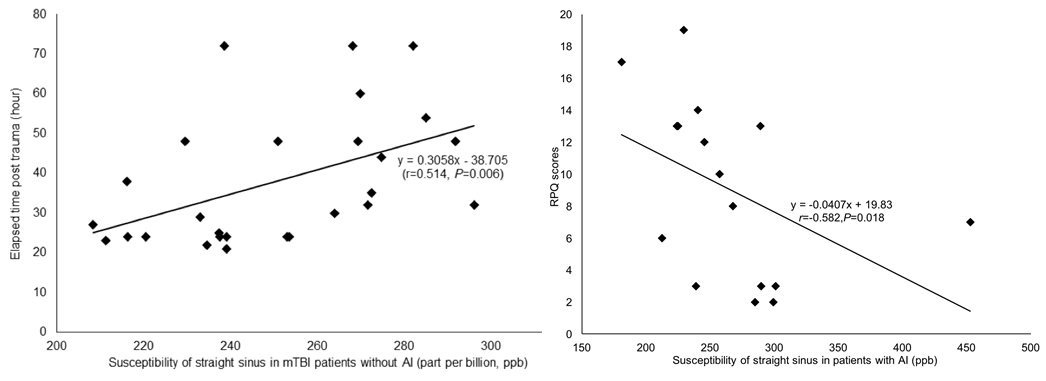
Fig. 4 The correlation between the susceptibility of straight sinus in non-AI patients and AI patients, ETPT and RPQ scores
In the non-AI group, the susceptibility of the straight sinus significantly positively correlated with the ETPT (r=0.496, P=0.007). In the AI group, the susceptibility of the straight sinus significantly negatively correlated with RPQ scores (r=-0.582, P=0.018).