4522
Mapping of endogenous glucose content on the detection of hypometabolic syndrome in experimental traumatic brain injury by glucoCEST1Radiology and Imaging Sciences, National Institutes of Health, Bethesda, MD, United States, 2National Library of Medicine, National Institutes of Health, 3Radiology and Imaging Sciences, National Institutes of Health
Synopsis
The current study investigated the feasibility of using glucoCEST technique, without delivering exogenous glucose as contrast agent, to measure the endogenous glucose content in brain by optimizing the saturation power and duration. The glucoCEST data were compared to the gold-standard 14C-2-deoxyglucose autoradiography for testing the sensitivity and specificity in the detection of hypometabolic syndrome in a rat model of diffuse traumatic brain injury (TBI). The glucoCEST showed comparable results to the 2DG-autoradiography showing glucose uptake largely decreased after TBI. Our findings suggest that glucoCEST could be a robust and reliable imaging modality capable of monitoring glucose metabolism non-invasively.
PURPOSE
GlucoCEST technique has been shown capable of detecting glucose uptake and metabolism in brain tumor by intravenous delivery of high concentration of glucose solution as the contrast agent in both preclinical1 and clinical study2. The current study further investigated the feasibility of using glucoCEST technique, without delivering exogenous glucose as contrast agent, to measure the endogenous glucose content in brain. We evaluated a series of magnetization transfer (MT) saturation power and duration combination for optimizing the sensitivity and specificity of glucoCEST in the detection of hypometabolic syndrome in a rat model of diffuse traumatic brain injury (TBI). The glucoCEST data were compared and correlated to the gold-standard 14C 2-deoxyglucose (14C-2DG) autoradiography for validating the glucose metabolic changes following TBI.METHODS
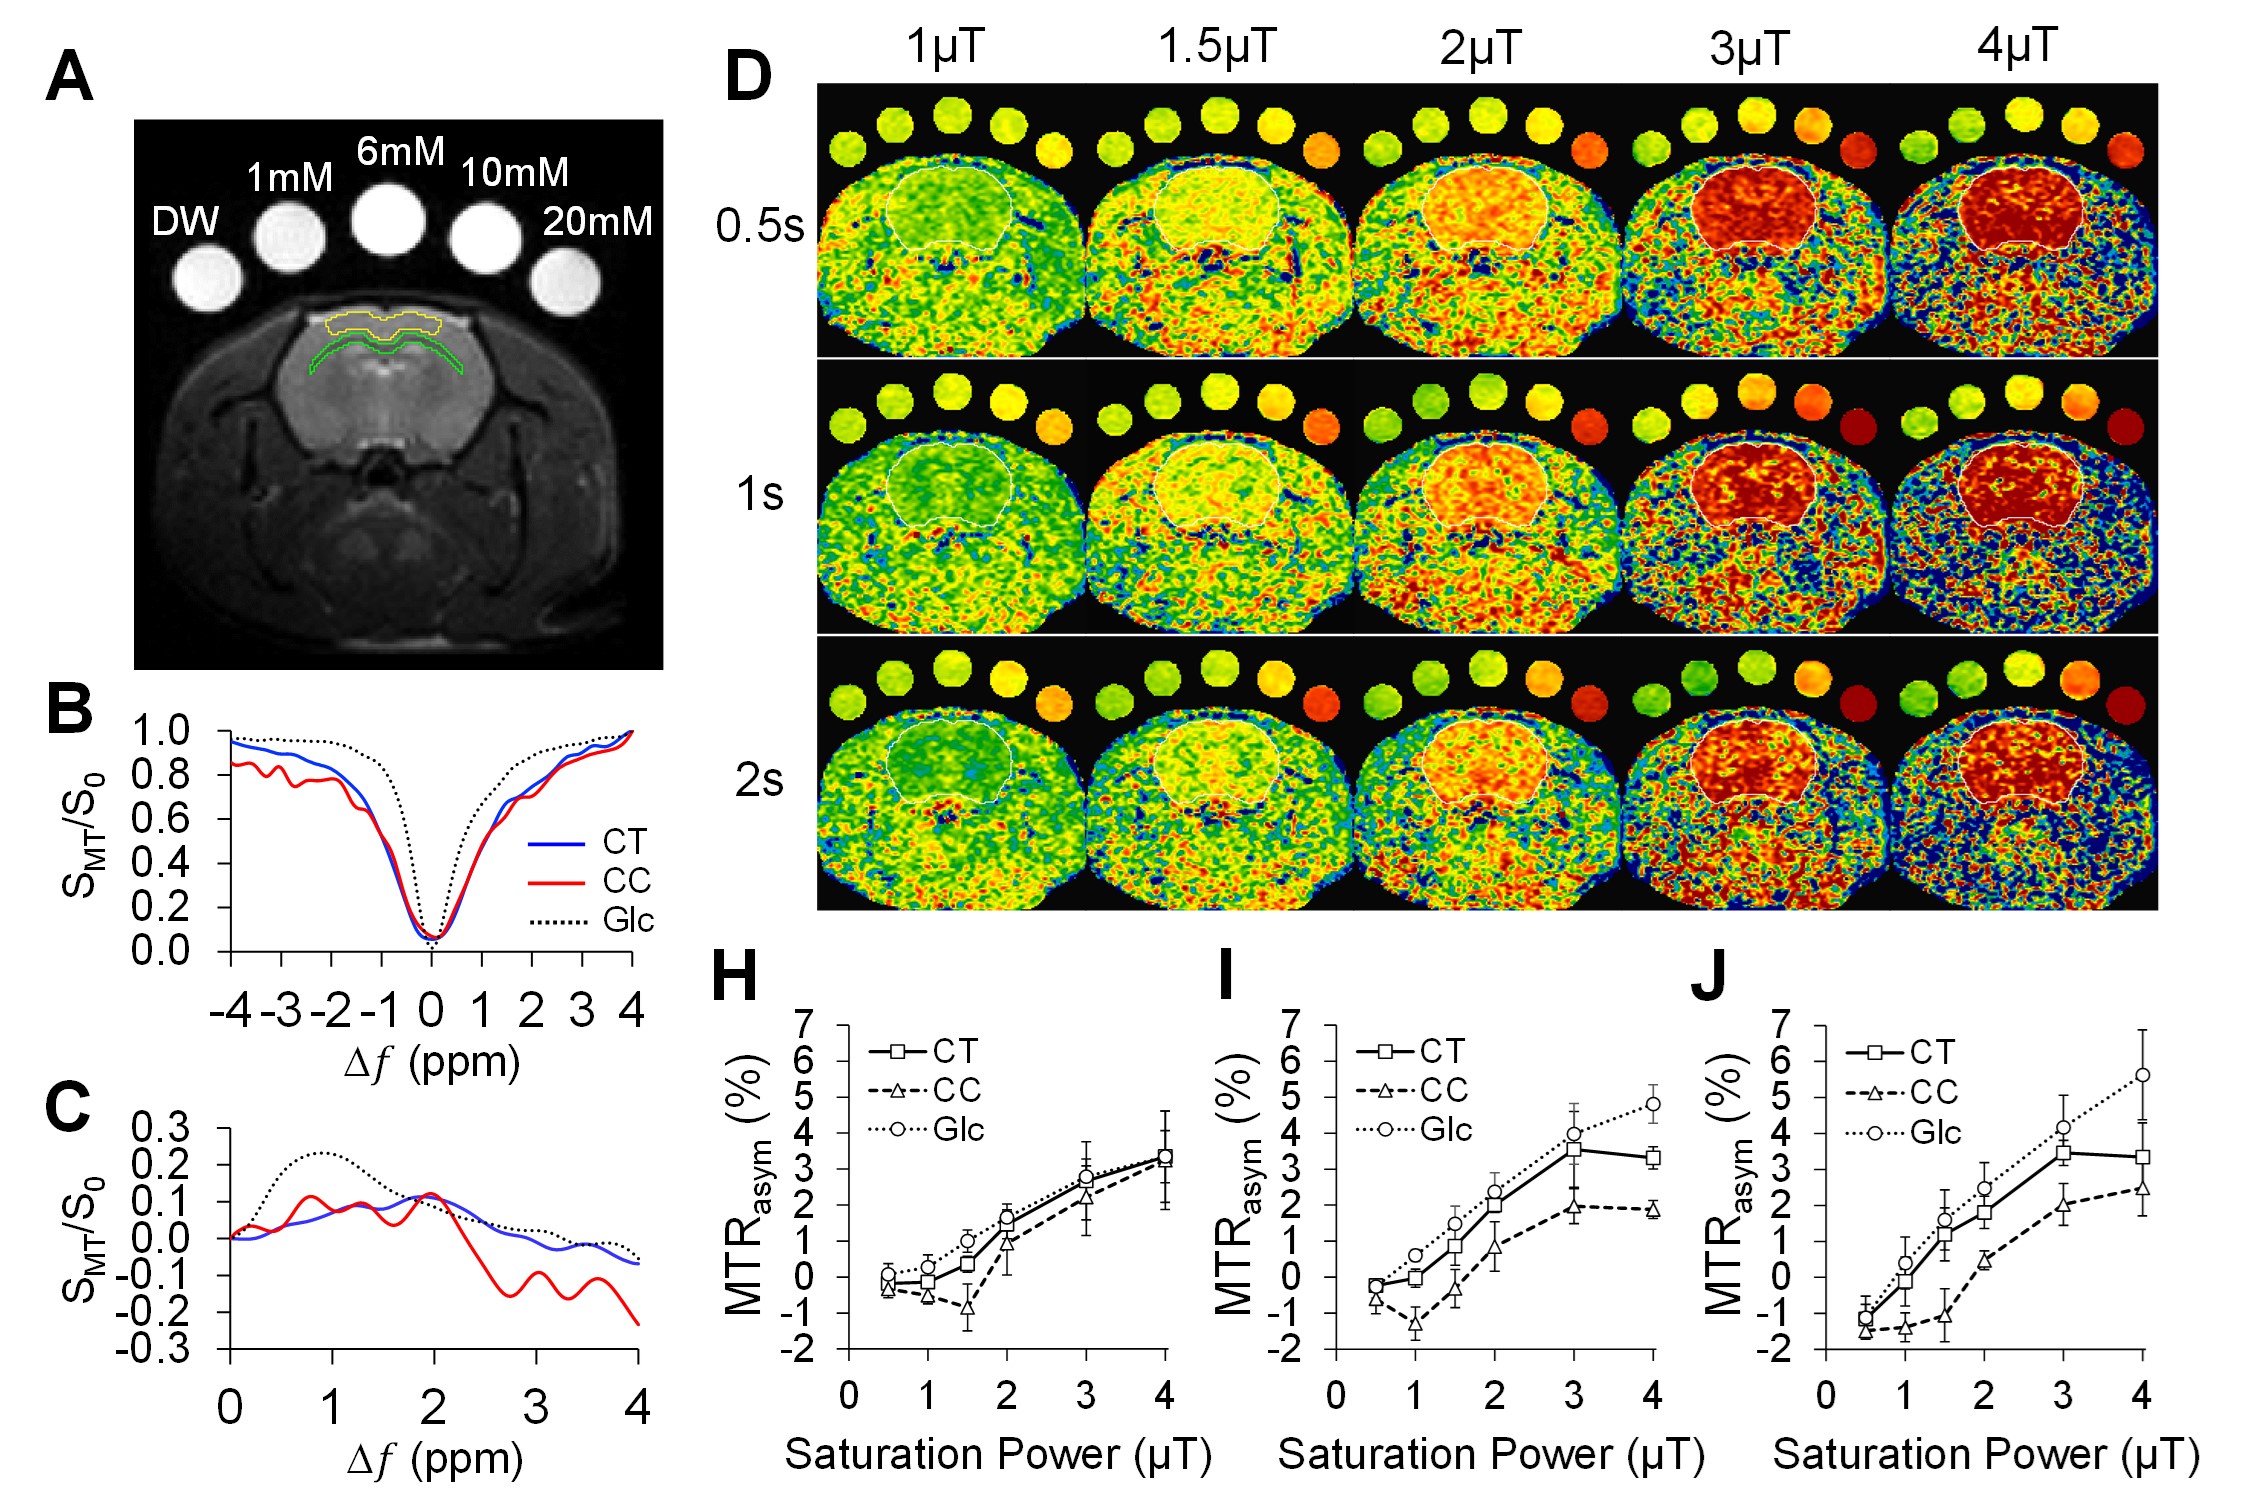
Six female 10-week-old SD rats had mild TBI using a 2m height/450g weight drop model. Another six rats without injury were served as the normal controls. GlucoCEST were acquired in vivo using a Bruker 9.4T scanner after 2 week of TBI by 2D fast spin echo with (SMT) and without (S0) MT saturation pulses (TR/TE 2.1s/10.4ms; in plane resolution: 200µm2, thickness: 0.8mm). The averaged field deviation was 0 ± 52.6 Hz by applying second order mapshim. The MT preparation pulses were arrayed for saturation power (1, 1.5, 2, 3, 4 μT) and saturation duration (0.5, 1, 2s) to test the sensitivity and specificity for glucose detection in brain. The MT offset frequences (Δω) were set from -1.6kHz to +1.6kHz with 100Hz stepping to sample 33 points in covering the frequency offset range from -4ppm to +4ppm to detect the proton metabolites of glucose.2 Procedure according to the WAter Saturation Shift Referencing (WASSR) method was applied to correct the B0 and B1 field inhomogeneity of the CEST data.3 The asymmetry of magnetization transfer ratio (MTRasym) were derived by calculating the area under the curve at 1.2ppm, 2.1ppm, 2.9ppm for mapping the cerebral glucose levels. After each scan, 3 rats were randomly selected and processed for 14C-2DG autoradiography. Data were examined by pearson correlation and one-way ANOVA using Prism v6.0 and Matlab scripts.RESULTS
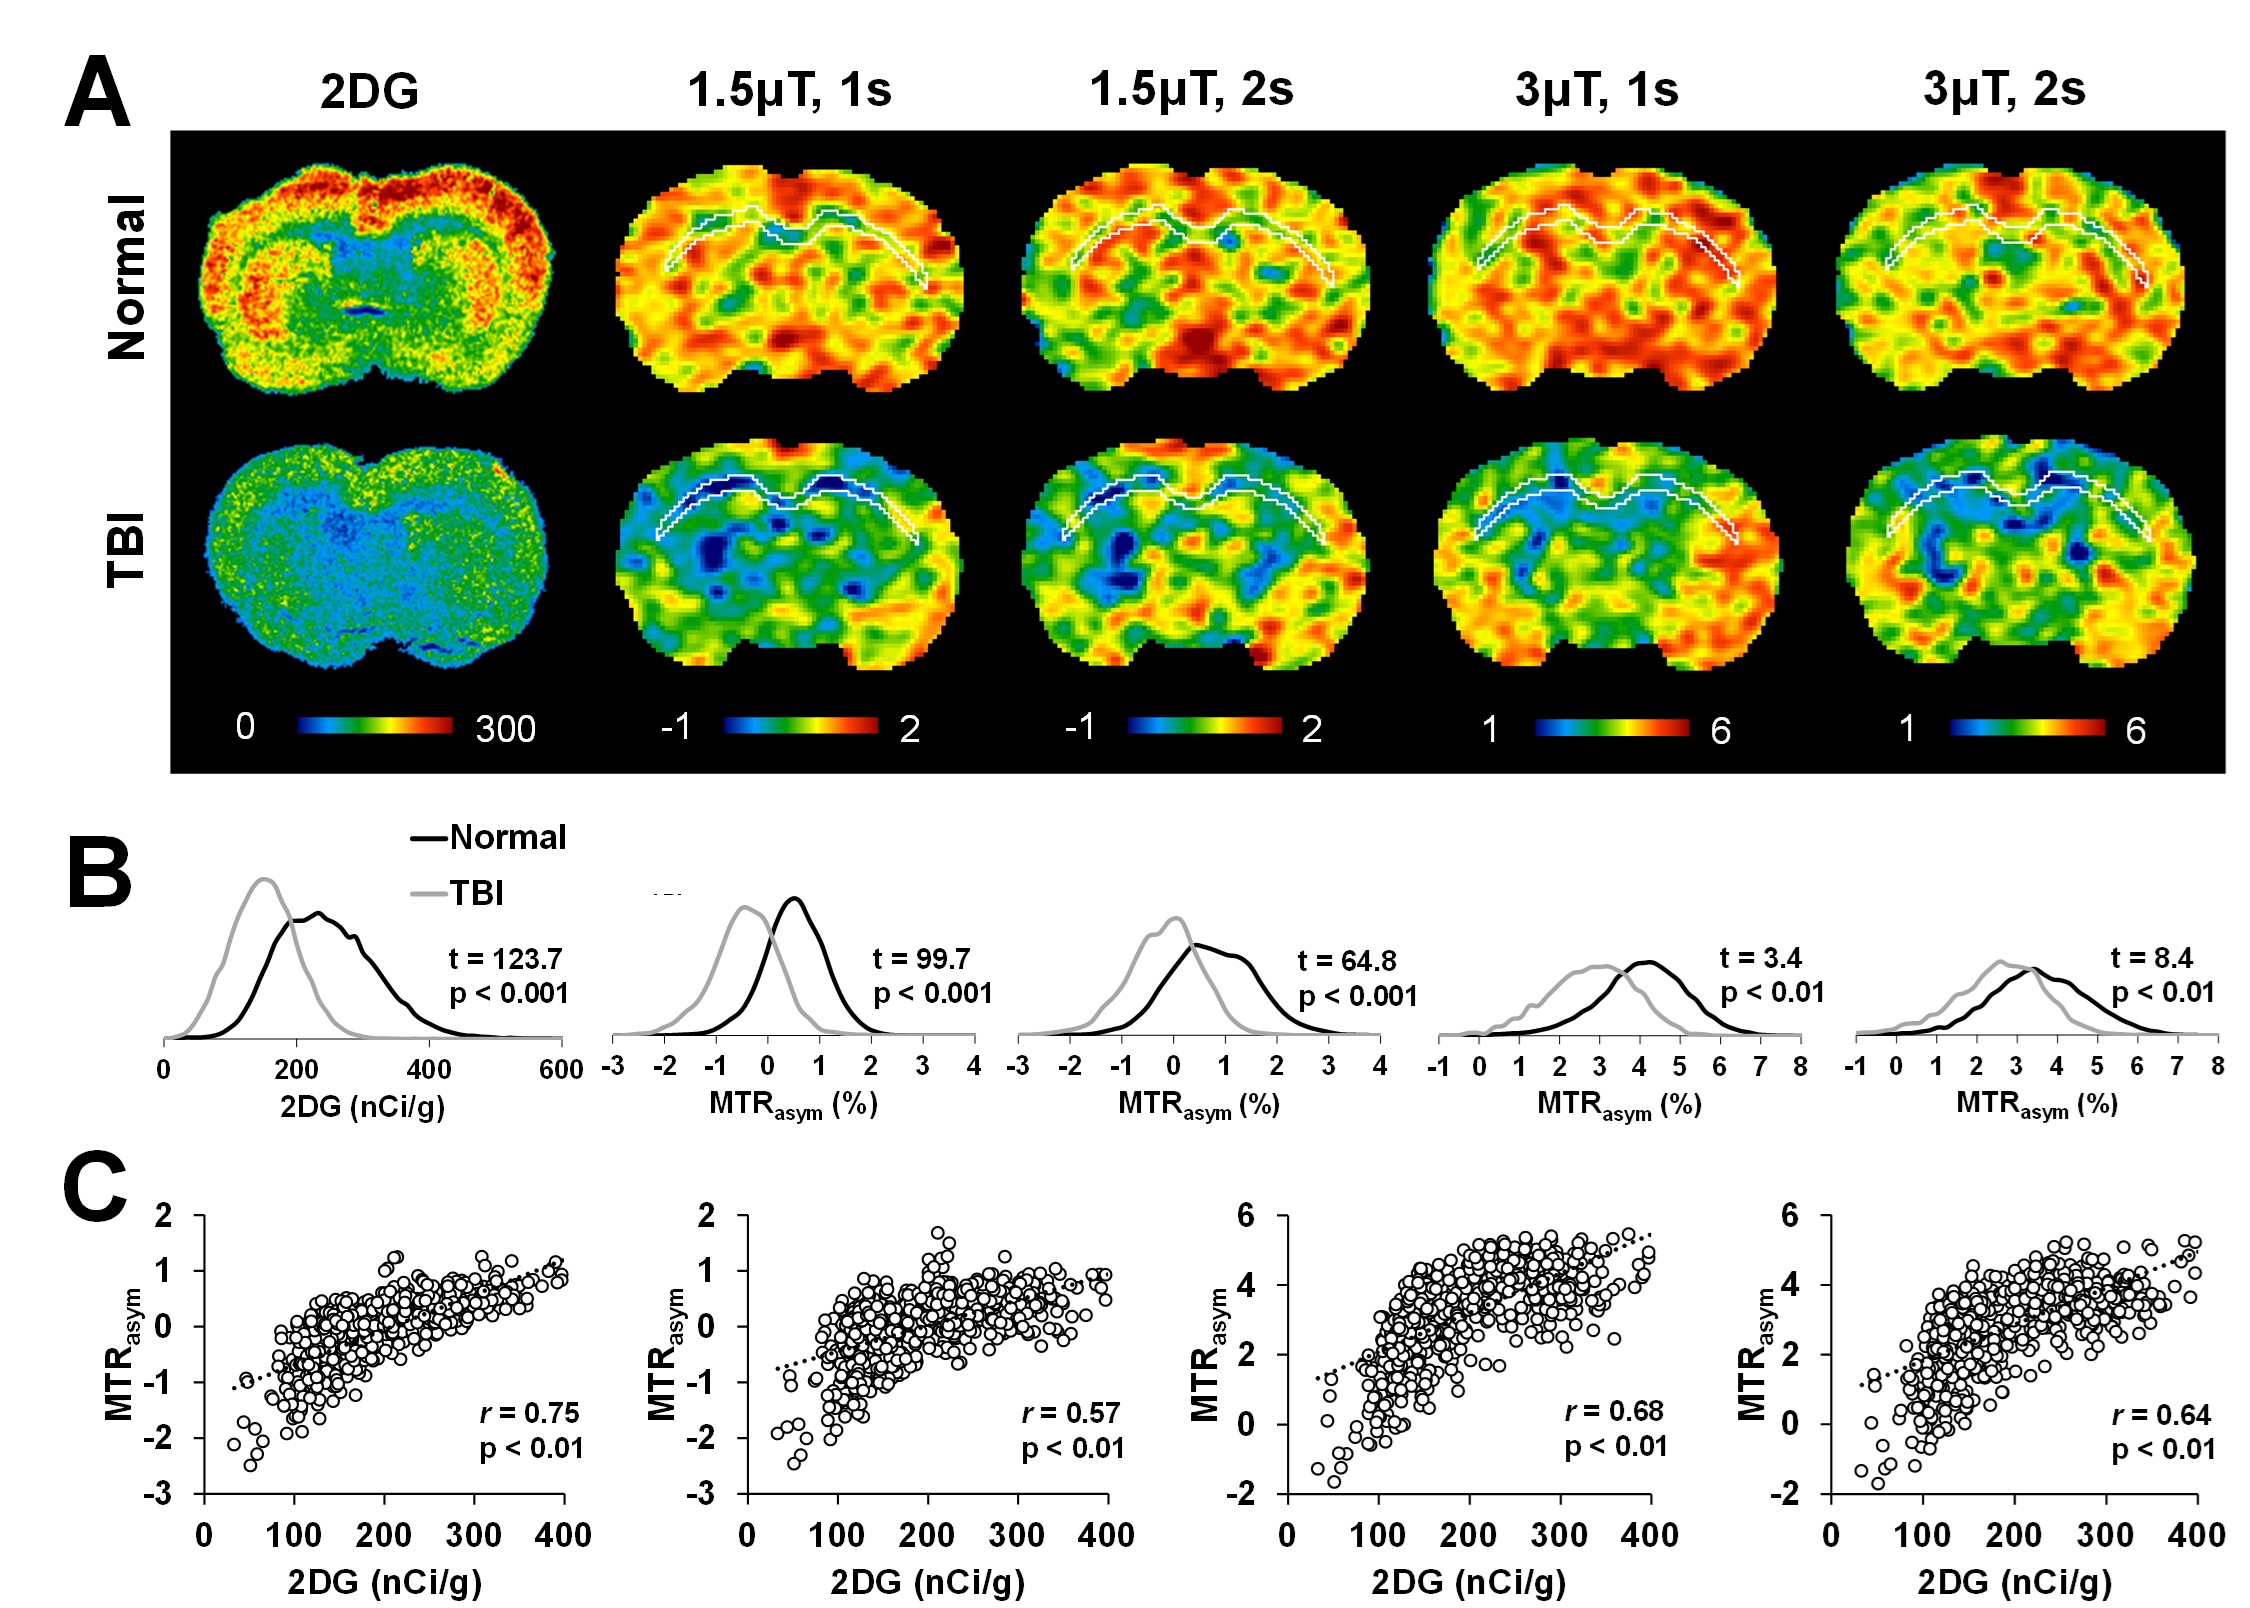
Figure 1 illustrates the behaviors of the in vivo glucoCEST signal changes in the rat brain. The Z-spectrum (Fig. 1B) and MTRasym (Fig. 1C) curves of the brain demonstrated the CEST signals from hydroxyl groups resonating at 1.2, 2.1 and 2.9 ppm. The glucoCEST contrast changes in response to different saturation power and duration (Fig 1D), where the contrast between CT and CC increased in proportional to the increased saturation power from 1μT to 3μT, but not beyond 3μT (Fig. 1H-J). 2s saturation duration delivered better contrast between CT and CC, but it deteriorated the image quality when accompanied with high saturation power (3 and 4 μT). After TBI, a wide spread of decreased glucose metabolism was seen in both 2DG autoradiography and glucoCEST maps (Fig. 2A). The 1.5μT and 1s group showed the best contrast before and after TBI and had the highest correlation (r = 0.76, p < 0.01) to the changes in 2DG autoradiography (Fig. 2B, C).DISCUSSION AND CONCLUSION
Mild TBI is usually termed “silent epidemic”, in part because the inarticulate hypometabolic syndrome lasts long for years that the current imaging technologies are insensitive to recognize it.4 In the current study, the glucoCEST data were in parallel to the 14C-2DG autoradiography and detected the hypometabolic syndrome after TBI. Our results support the hypothesis that glucoCEST is capable of delivering the sensitivity for detecting the endogenous glucose content by optimizing the saturation power and duration without the use of exogenous contrast agent. GlucoCEST has strong potential to be the robust and reliable non-invasive imaging modality for endogenous glucose monitoring in the brain.Acknowledgements
No acknowledgement found.References
[1] Walker-Samuel, Nat.Med, 2013;
[2] Xu, Tomography. 2015;
[3] Kim, MRM, 2009;
[4] Rusnak, Nat.Rev.Neu., 2013
Figures