4519
Longitudinal Quantitative Susceptibility Changes after Mild Traumatic Brain Injury1Radiology, Medical College of Wisconsin, Milwaukee, WI, United States, 2Neurosurgery, Medical College of Wisconsin, Milwaukee, WI, United States
Synopsis
We present findings of longitudinal quantitative susceptibility mapping measurements on a cohort of contact sport athletes that were imaged longitudinally (24 hour, 8 day, 6 month) following diagnosed sport-related concussions (N=22). A cohort (N=29) of contact sport controls was imaged longitudinally using the same protocol and allowed stability assessment stability of the measurement. In regions of high stability, changes in susceptibility after injury were assessed in comparison to an atlas constructed from the control data. Substantial susceptibility variations after injury were found in the deep brain nuclei, which recovered and stabilized in the following two measurement points.
Introduction
Quantitative susceptibility mapping (QSM) provides a direct measurement of tissue magnetism1. In the case of severe traumatic brain injury, severe hemorrhages provide large paramagnetic offsets. In the case of mild complicated traumatic brain injury, QSM can provide valuable information in differentiating calcifications from micro-hemorrhages, both of which would appear dark on T2*w imaging sequences, but have opposite signal polarities on QSM (calcifications are diamagnetic, hemorrhages are paramagnetic)2.
Here, we explore QSM value in assessing uncomplicated mTBI. This, is by definition, a challenging task, given that uncomplicated mTBI indicate a lack of findings on routine MRI or CT imaging. The goal of this study to utilize a controlled population study to assess group differences in susceptibility. Utilizing longitudinal control data, we were able to construct an estimate of measurement variability, both within and across subjects. Effects of concussion were assessed within regions of high reproducibility by comparing the injured and control datasets.
Methods
Contact sport athletes were enrolled into a study approved the local institutional review board. 26 control and 22 injured subjects participated in the study. All participants were to be imaged at 3 time points, 24 hours, 8 days, and 6 months post injury (if injured). Though not all subjects completed all 3 time points, all acquired data was included in the analysis, except for one exam that failed manual image quality control checks. In total 103 imaging sessions were analyzed (44 injured and 59 control)
QSM data was acquired as part of a broad and advanced multi-modal MRI protocol. In order to fit within the allocated scan slot, the QSM acquisition was limited to 4 minutes. Data was acquired on a GE Healthcare MR750 3T MRI using a Nova 32ch RF receive array and a body RF transmission assembly. QSM images were acquired with the following parameters: data matrix = 384x260x72, FOV=25.6, slice-thick=2mm, 4 echoes, last echo time = 24.4ms, TR = 58.7 ms, 3x1 auto-calibrated parallel imaging.
Masking was performed using SPM3 to compute white-matter, gray-matter, and CSF segmentations, which were then combined to form a composite mask. After computation of the induction field from the complex echo images, PDF background removal algorithm4 was applied to leave the residual tissue field estimate. Finally, QSM inversion was performed using the MEDI5 algorithm within a volume parcellation scheme, which reduces vulnerability to streaking artifacts6. Group analyses were performed by performing nonlinear registrations of all subjects to MNI standard space.
Results
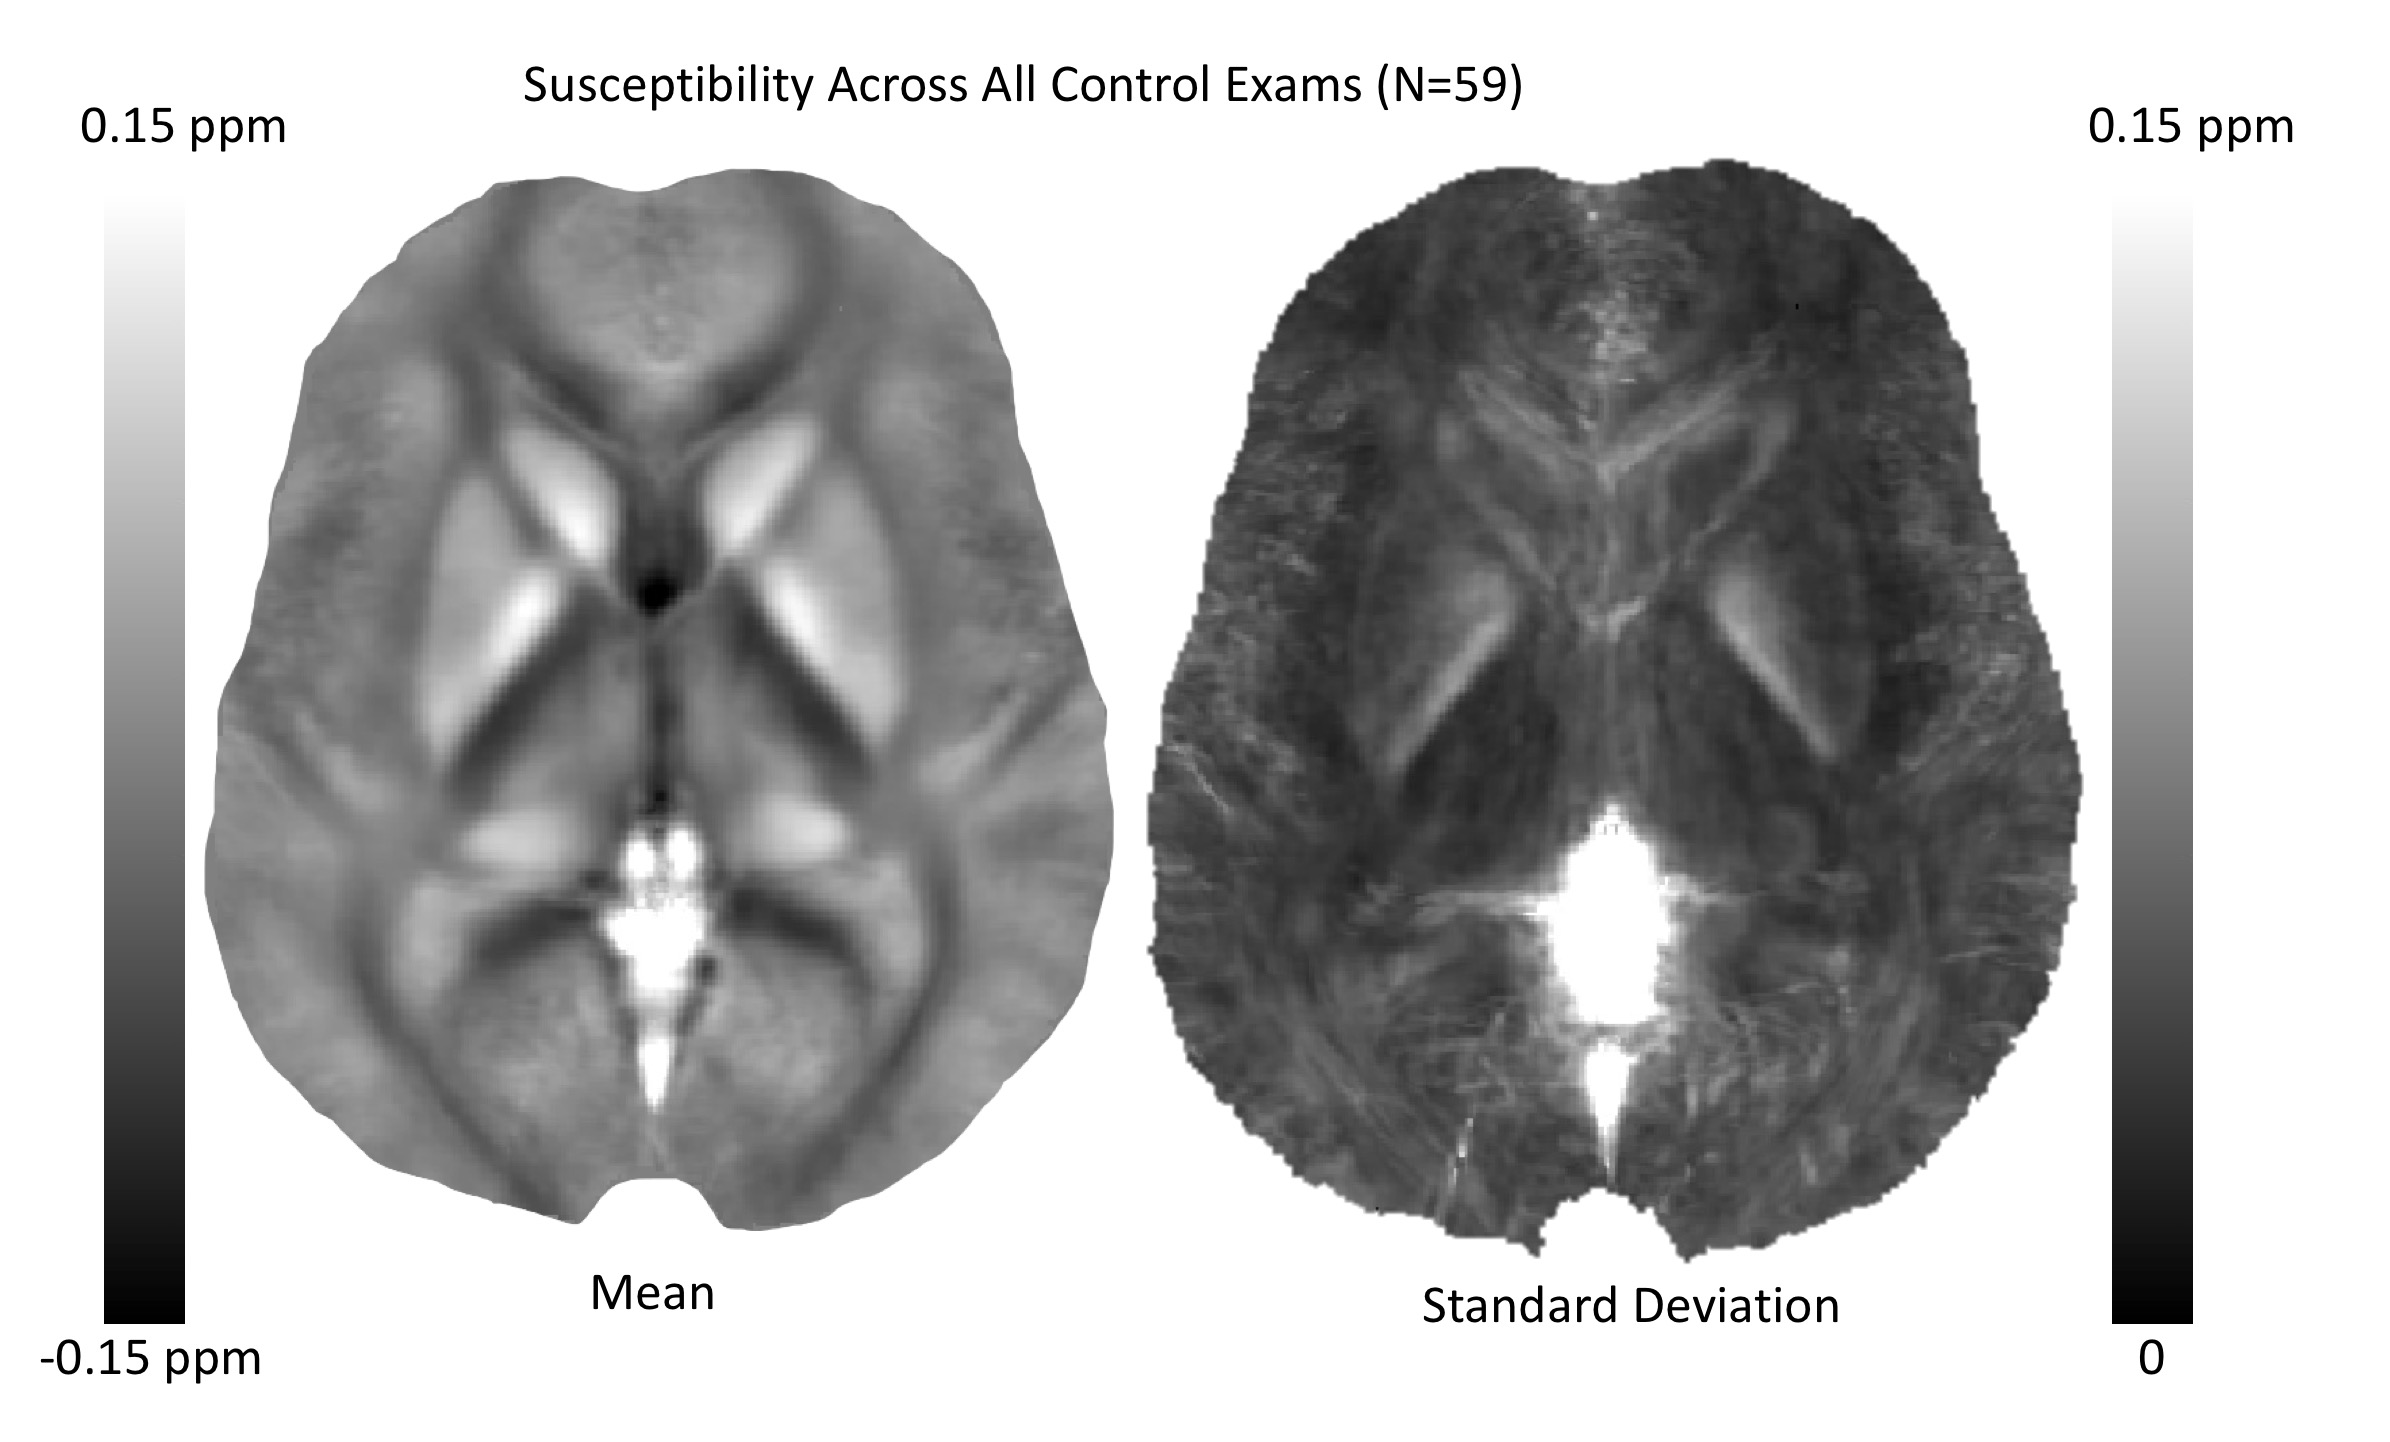
Figure 1 presents the mean and standard deviation of QSM maps computed across all control exams. There are clear consistent trends within a variety of white matter tracks (diamagnetic, dark) and deep brain nuclei (paramagnetic, white). However, it is also clear than many of the finer tissue features are washed out in the mean.
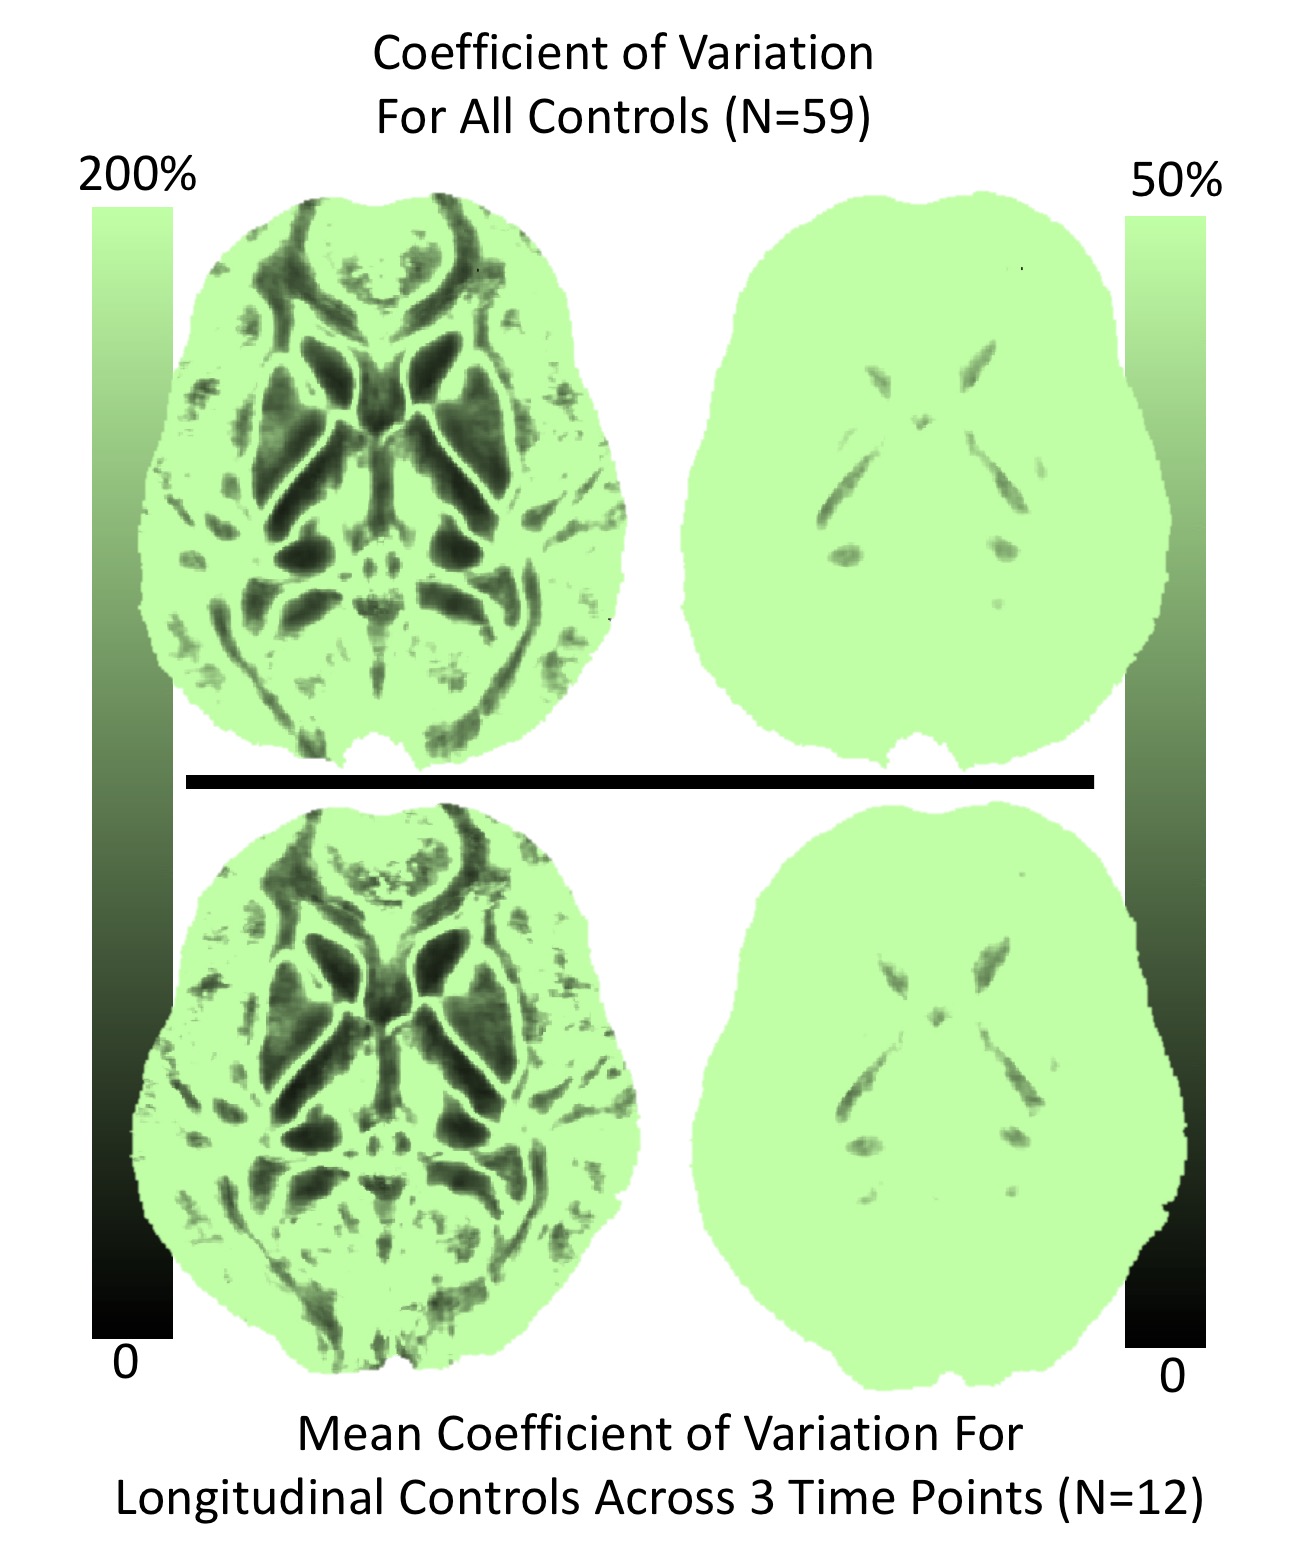
Figure 2 explores the map stability further by computed coefficients of variation (CV) across all control subjects (top row) and the mean CV across all controls that completed all 3 longitudinal scans. Thus, the top row includes inter-subject CV (top) and intra-subject CV (bottom). Interestingly, the results show that the intra-subject variability is nearly equivalent to that across all subjects. As seen in Figure 2, the vast majority of the brain shows very high CV – far too high to allow for any anticipated effect sizes in the injured group. The right column shows a narrowly windowed CV mask, that indicates region of low CV in the deep gray nuclei and a set of white matter tracks (somewhat agreeing with the mean man in Figure 1).
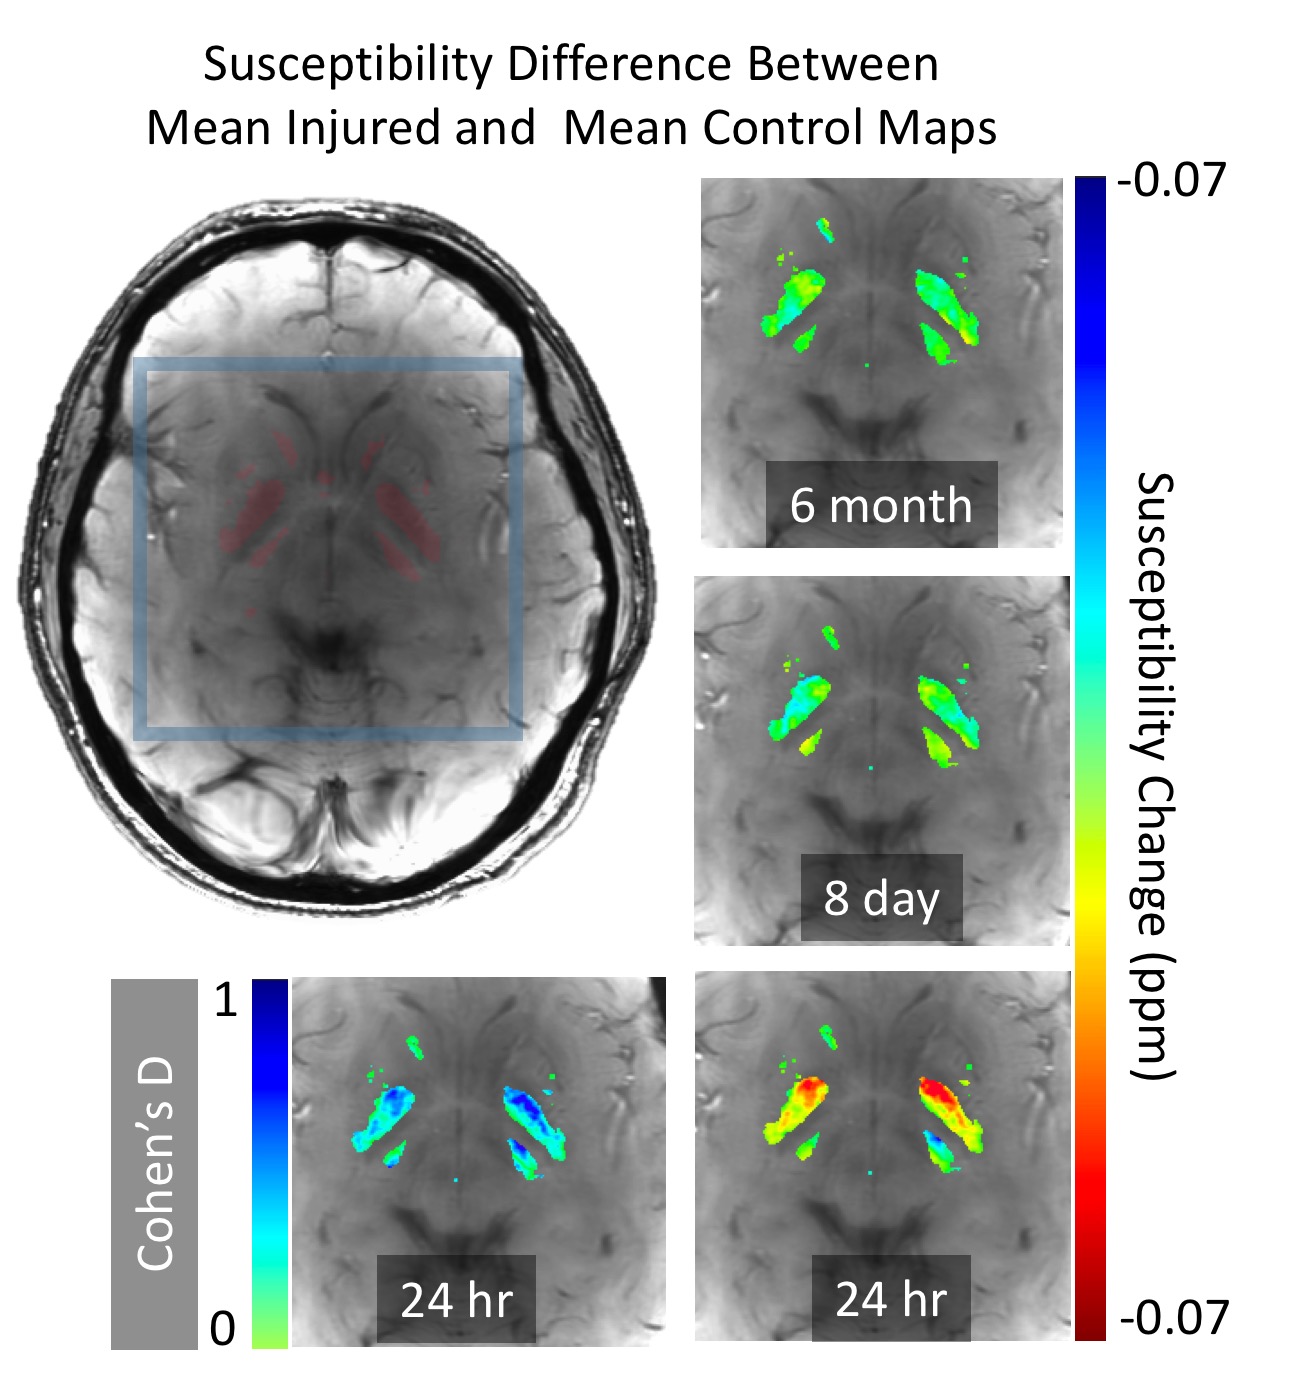
Figure 3 presents differences between the mean injured group at different time points and the control mean map. There is a clear effect (reduced susceptibility) in the basal ganglia at the 24hr post-injury point, which stabilizes by the time of the 8 day assessment. Using standard deviation estimates of the two groups, a Cohen’s D statistic is plotted, showing strong effect size (>0.5) across a large region within the nuclei.
Discussion
Much of the brain volume shows substantial inter- and intra-subject instability of QSM measurements. However, our analysis has identified regions of the brain where adequate reproducibility allows for effect size measurements, even in the relatively small cohort studied here. In one of these regions, the basal ganglia, we have identified a substantial group-averaged post-concussion susceptibility reduction. At this point, we cannot theorize on the physiological source of this reduction (reduced iron, reduced blood volume). However, ongoing studies in our research program are likely to enable more highly powered QSM assessments to elucidate and expand upon these observations.Acknowledgements
This work was funded by grants from the GE-NFL Head Health Challenge and the Advancing a Healthier Wisconsin Research and Education Program.References
[1] Wang, Y., & Liu, T. (2015). Quantitative susceptibility mapping (QSM): Decoding MRI data for a tissue magnetic biomarker. Magnetic Resonance in Medicine, 73(1), 82–101.
[2] Liu, W., Soderlund, K., Senseney, J. S., Joy, D., Yeh, P.-H., Ollinger, J., et al. (2016). Imaging Cerebral Microhemorrhages in Military Service Members with Chronic Traumatic Brain Injury. Radiology, 278(2), 536–545.
[3] SPM: http://www.fil.ion.ucl.ac.uk/spm/
[4] Liu, T., Khalidov, I., de Rochefort, L., Spincemaille, P., Liu, J., Tsiouris, A. J., & Wang, Y. (2011). A novel background field removal method for MRI using projection onto dipole fields (PDF). NMR in Biomedicine, 24(9), 1129–1136.
[5] Liu, J., Liu, T., de Rochefort, L., Ledoux, J., Khalidov, I., Chen, W., et al. (2012). Morphology enabled dipole inversion for quantitative susceptibility mapping using structural consistency between the magnitude image and the susceptibility map. Neuroimage, 59(3), 2560–2568.
[6] Anderson, C., Nencka, A., Muftuler, T., Schmainda K., Koch, K. Volume-Parcellated Quantitative Susceptibility Mapping, Proc ISMRM, 2016, #1108
Figures