4517
9.4 Tesla in vivo Quantitative Susceptibility Mapping (QSM) detects thalamic calcium influx associated with repeated mild traumatic brain injury (mTBI)1Buffalo Neuroimaging Analysis Center, Department of Neurology, Jacobs School of Medicine and Biomedical Sciences, University at Buffalo, The State University of New York, Buffalo, NY, United States, 2MRI Clinical and Translational Research Center, Jacobs School of Medicine and Biomedical Sciences, University at Buffalo, The State University of New York, Buffalo, NY, United States, 3Department of Neurosurgery, Jacobs School of Medicine and Biomedical Sciences, University at Buffalo, The State University of New York, Buffalo, NY, United States, 4Department of Neurobiology, A. I. Virtanen Institute for Molecular Sciences, University of Eastern Finland, Kuopio, Finland
Synopsis
This work investigated if Quantitative Susceptibility Mapping (QSM) can detect thalamic Ca2+ influx associated with an alteration of the N-methyl-D-aspartate receptor in a rodent model of mild TBI (mTBI). We found significant concentrations of calcium after repeated mTBI, but not after single mTBI, suggesting that persistent calcium deposits represent a primary pathology of repeated injury.
Introduction
A key event in the pathophysiology of traumatic brain injury (TBI) is the dynamic molecular alteration of the N-methyl-D-aspartate receptor structure and function1, with the concomitant thalamic influx of substantial amounts of Ca2+.2 Detection of this calcium influx in vivo would provide a window into the biochemical mechanisms of TBI that has significant clinical implications for the objective assessment of injury severity and drug development.
In the present work, we investigated if the novel, calcium-sensitive9 technique Quantitative Susceptibility Mapping (QSM)3-6 can detect diamagnetic calciumphosphates7-9 associated with Ca2+ influx in mild TBI (mTBI).
Methods
Animal model: In this IACUC-approved study, we employed the lateral fluid percussion injury (FPI) model10, which replicates clinical TBI without skull fracture. We performed a 5mm craniotomy (right hemisphere) in 12 adult, male Wistar rats. Application of a single 1.7atm pressure pulse modeled single mTBI (s-mTBI, four rats), repeated pressure pulses once/week over four weeks modeled repeated mTBI (r-mTBI, five rats); 3 rats were taken as shams; 2 control rats had no surgery. We performed Neurological Severity Score (NSS) assessments at 24 hours post-injury to confirm negligible functional impairment.
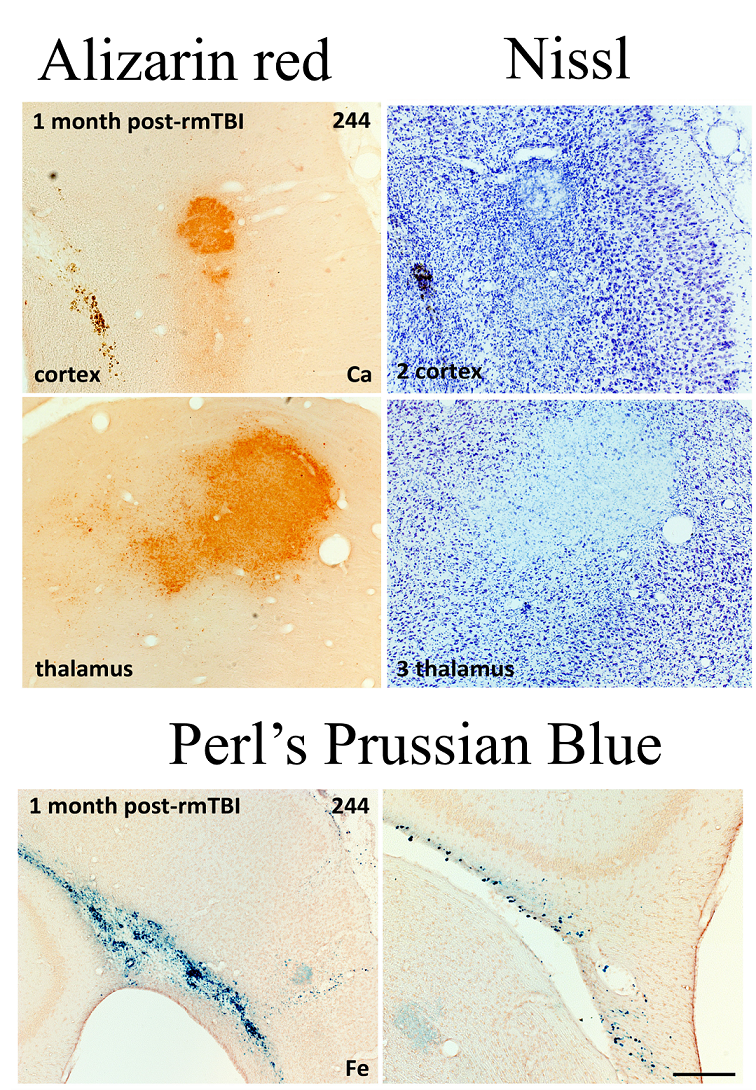
Data acquisition and analysis: We performed MRI at 9.4T (four-channel Rx-array; Isoflurane/O2) at one week and one month after the first injury using a multi-echo gradient echo sequence (TE1=2.31ms, ΔTE=3.10ms, TR=100ms, tip=19°, 16 echoes, BW=50kHz, FOV=30x30x14mm3, matrix=135x208x97). Susceptibility maps were reconstructed with best-path unwrapping11, multi-echo multi-channel phase combination12, R2*-weighted field-mapping13, V-SHARP14-16, and QUASAR-HEIDI17. We assessed volumes of lateral ventricles and bilateral hippocampus and segmented focal diamagnetic lesions in the thalamus on QSM. After the second MRI, rats were perfused with gadobutrol (Gadavist, Bayer) for MR-microscopy18 (MRM; FLASH, TE=4.14ms, TR=18.6ms, averages=8, 36µm isotropic) with a cryogenic coil (CryoProbe, Bruker Biospin) and histology (calcium: Alizarin red; iron: Perl’s Prussian Blue; neurons: Nissel). We used paired and two-sample t-test, respectively, for comparisons.
Results
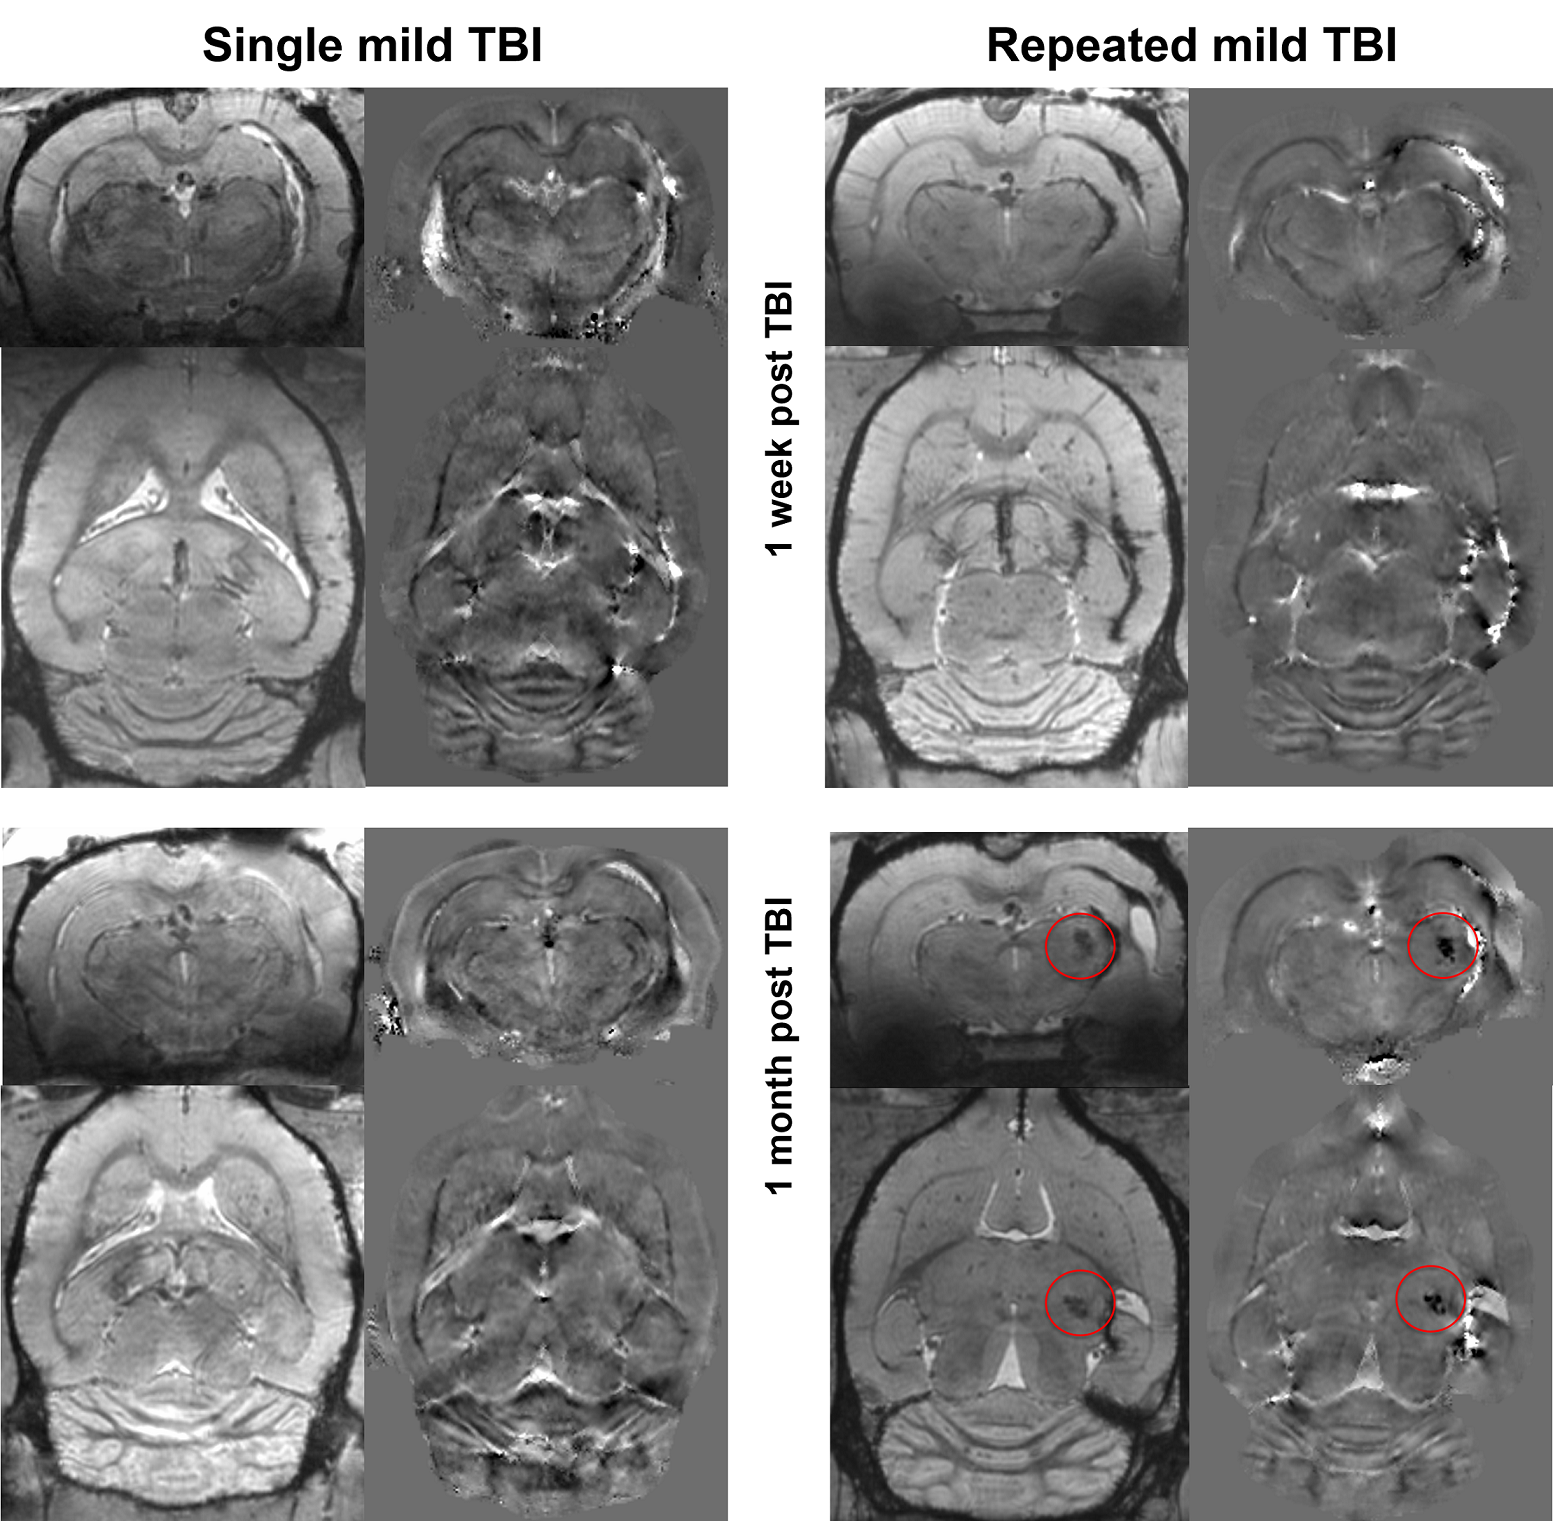
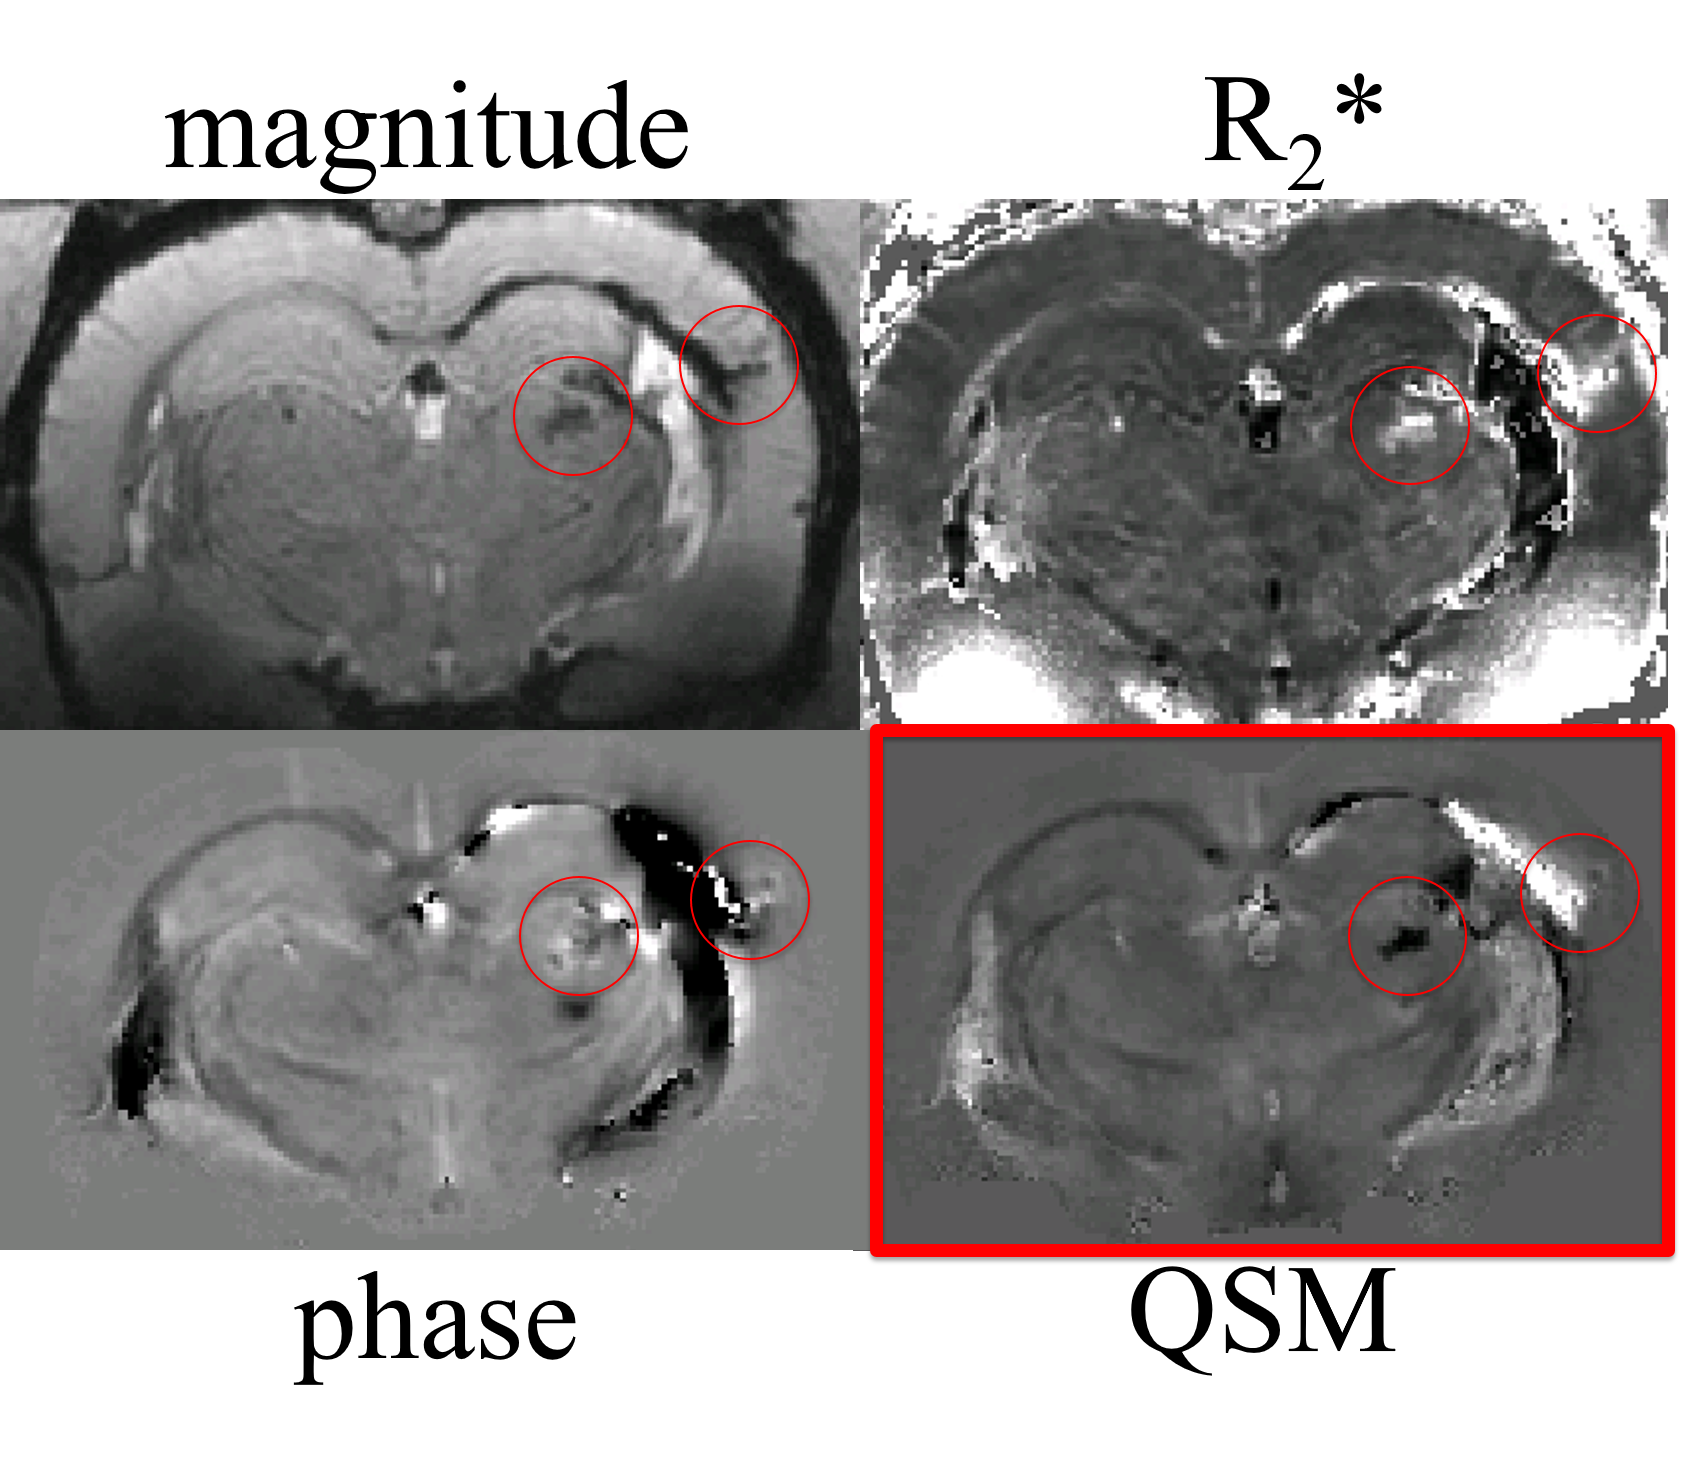
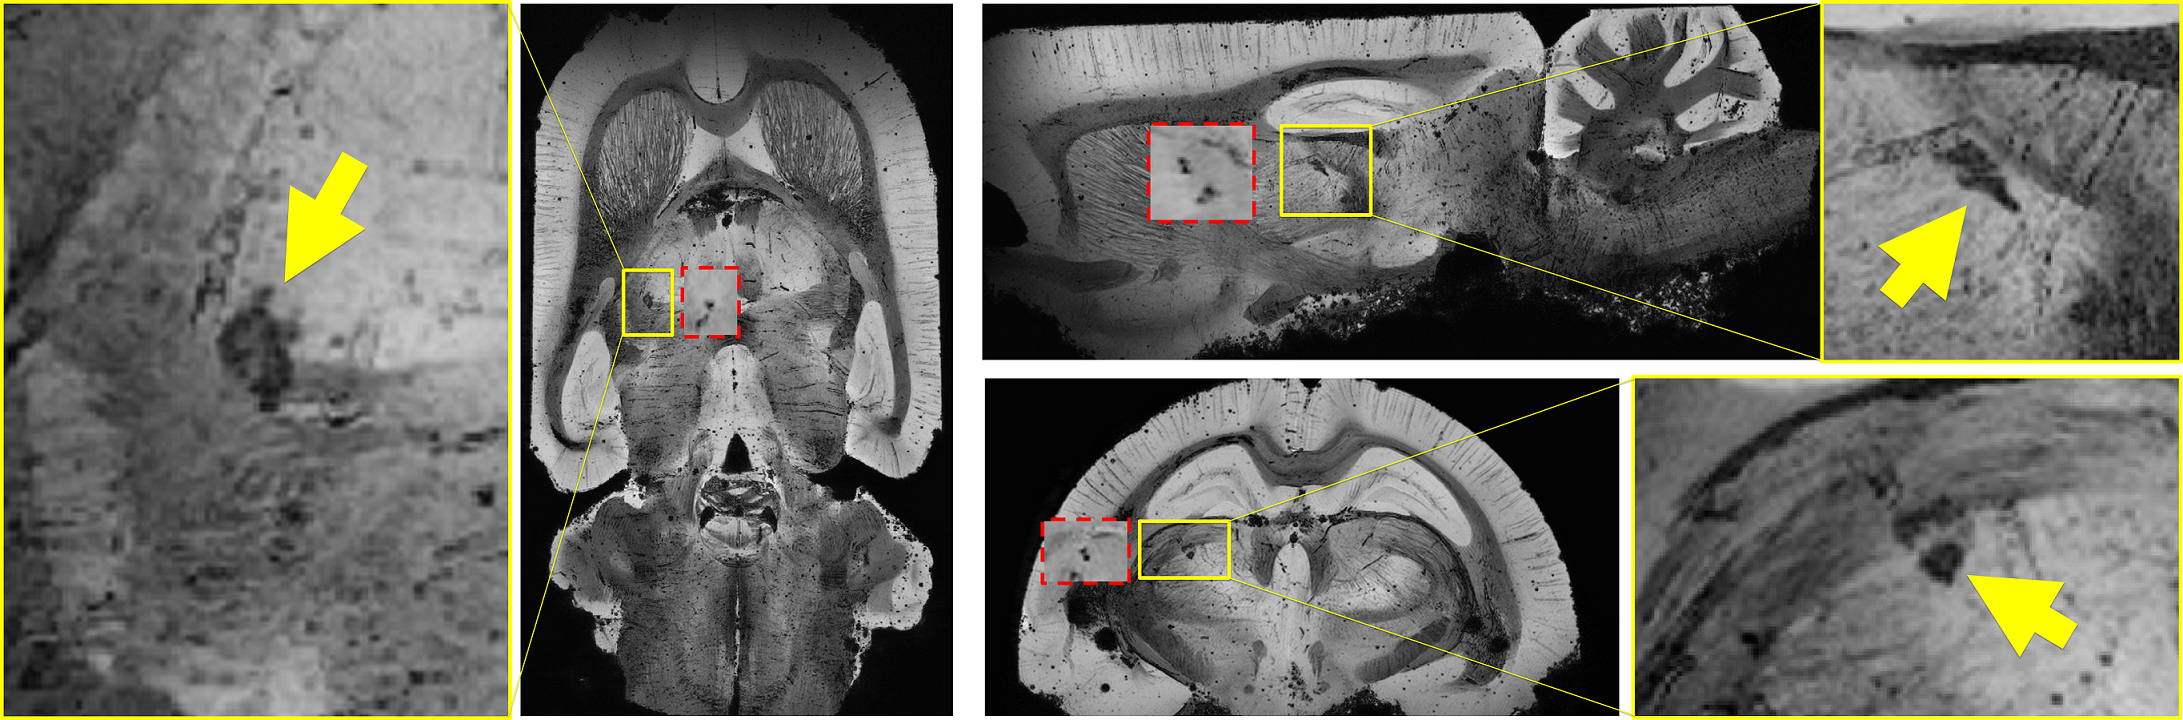
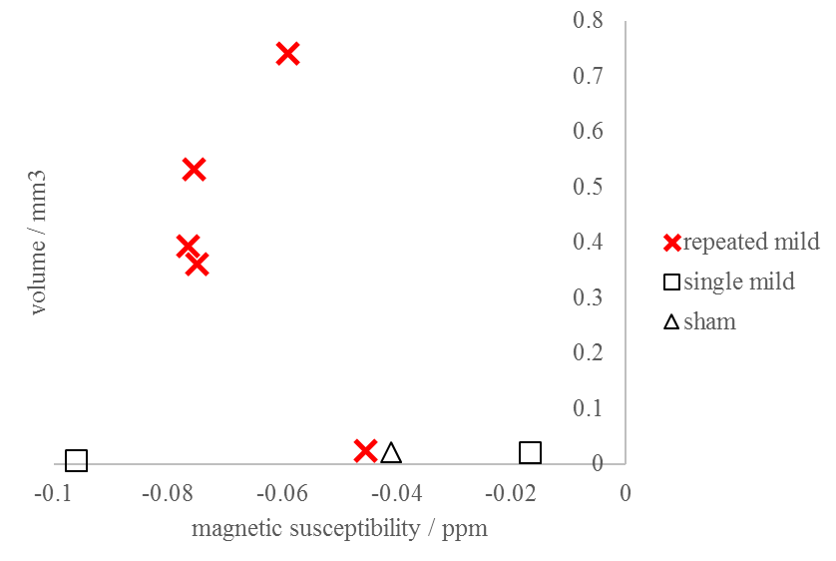
QSM visualized FPI-induced hemorrhages at gray-white matter junctions (Figs. 1 and 2). No differences in ventricular space were detected between s-mTBI and r-mTBI (p>0.4) at either time point. Hippocampal volumes of shams and s-mTBI (but not r-mTBI; p=0.06) were decreased (sclerosis) at 5 weeks compared to controls (p<0.014) and were higher (swelling) in r-mTBI than in s-mTBI (p=0.036). We identified focal hypointensities in the ipsilateral thalamus (Figure 4) in 100% of r-mTBI animals (0.41±0.26mm3; -66±14ppb; Figs. 1-right, 2 and 3), 50% of s-mTBI (0.014±0.009mm3; -56±56ppb), and 33% of sham (0.021mm3; -41ppb). Iron and calcium stains were distinct from one another and correlated with QSM (Figure 5); Nissl-stain sections revealed neuronal loss in deep layers of the ipsilateral cortex, thalamus and dentate hilus in r-mTBI. MRM indicated calcification in both thalamic gray and adjacent white matter tracts (Figure 3).Discussion
Using 45Ca-autoradiography, Osteen et al.2 reported a delayed focal accumulation of Ca2+ in the thalamus beginning 2-4 days post-injury and progressing for up to 2 weeks. Using QSM of the FPI model, we successfully detected this clinically relevant pathology in vivo. Conventional magnitude-based MRI was not able to differentiate calcium from other susceptibility inclusions, such as hemorrhages (Figures 1 and 2). While we also detected hypointense focal spots in s-mTBI and shams, those were of substantially lower volume than in r-mTBI (Figure 4), suggesting a different biophysical or imaging/reconstruction-related origin and indicating excellent separation from r-mTBI-induced calcium deposits. In particular, the finding in shams indicates that these small lesions were not related to mTBI pathology (false-positive).Conclusion
The unique ability of QSM to differentiate between diamagnetic (calcium phosphate) and paramagnetic (heme-iron) substances unambiguously revealed thalamic calcium influx concomitant to mTBI. Hence, the technique has the potential to become a sensitive tool for studying mTBI pathophysiology and in drug development. In particular, our finding of significant concentrations of calcium in the r-mTBI model, but not in s-mTBI (Figure 4), suggests that persistent calcium deposits represent a primary pathology of repeated injury.Acknowledgements
Research reported in this publication was funded by the National Center for Advancing Translational Sciences of the National Institutes of Health under Award Number UL1TR001412. The content is solely the responsibility of the authors and does not necessarily represent the official views of the NIH.References
[1] C. L. Osteen, C. C. Giza, and D. A. Hovda, “Injury-induced alterations in N-methyl-D-aspartate receptor subunit composition contribute to prolonged 45calcium accumulation following lateral fluid percussion,” Neuroscience, vol. 128, no. 2, pp. 305–322, 2004.
[2] C. L. Osteen, A. H. Moore, M. L. Prins, and D. A. Hovda, “Age-dependency of 45calcium accumulation following lateral fluid percussion: acute and delayed patterns.” J Neurotrauma, vol. 18, no. 2, pp. 141–62, 2001.
[3] C. Liu, W. Li, K. A. Tong, K. W. Yeom, and S. Kuzminski, “Susceptibility-weighted imaging and quantitative susceptibility mapping in the brain,” J Magn Reson Imaging, vol. 42, no. 1, pp. 23–41, 2015.
[4] E. M. Haacke, S. Liu, S. Buch, W. Zheng, D. Wu, and Y. Ye, “Quantitative susceptibility mapping: current status and future directions,” Magn Reson Imaging, vol. 33, no. 1, pp. 1–25, 2015.
[5] J. R. Reichenbach, F. Schweser, B. Serres, and A. Deistung, “Quantitative Susceptibility Mapping: Concepts and Applications,” Clin Neuroradiol, vol. 25, no. S2, pp. 225–230, 2015.
[6] Y. Wang and T. Liu, “Quantitative susceptibility mapping (QSM): Decoding MRI data for a tissue magnetic biomarker,” Magn Reson Med, vol. 73, no. 1, pp. 82–101, 2015.
[7] S. Straub, F. B. Laun, J. Emmerich, B. Jobke, H. Hauswald, S. Katayama, K. Herfarth, H.-P. Schlemmer, M. E. Ladd, C. H. Ziener, D. Bonekamp, and M. C. Röthke, “Potential of quantitative susceptibility mapping for detection of prostatic calcifications,” J Magn Reson Imaging, 2016.
[8] W. Chen, W. Zhu, I. Kovanlikaya, A. Kovanlikaya, T. Liu, S. Wang, C. Salustri, and Y. Wang, “Intracranial calcifications and hemorrhages: characterization with quantitative susceptibility mapping.” Radiology, vol. 270, no. 2, pp. 496–505, 2014.
[9] F. Schweser, A. Deistung, B. W. Lehr, and J. R. Reichenbach, “Differentiation Between Diamagnetic and Paramagnetic Cerebral Lesions Based on Magnetic Susceptibility Mapping,” Med Phys, vol. 37, no. 10, pp. 5165–5178, 2010.
[10] T. K. McIntosh, L. Noble, B. Andrews, and a. I. Faden, “Traumatic brain injury in the rat: characterization of a midline fluid-percussion model.” Central nervous system trauma, vol. 4, no. 2, pp. 119–134, 1987.
[11] H. S. Abdul-Rahman, M. A. Gdeisat, D. R. Burton, M. J. Lalor, F. Lilley, and C. J. Moore, “Fast and robust three-dimensional best path phase unwrapping algorithm.” Appl Opt, vol. 46, no. 26, pp. 6623–35, 2007.
[12] S. D. Robinson, G. Grabner, S. Witoszynskyj, and S. Trattnig, “Combining phase images from multi-channel RF coils using 3D phase offset maps derived from a dual-echo scan.” Magn Reson Med, vol. 65, no. 6, pp. 1638–48, 2011.
[13] B. Wu, W. Li, A. V. Avram, S.-M. Gho, and C. Liu, “Fast and tissue-optimized mapping of magnetic susceptibility and T2* with multi-echo and multi-shot spirals.” NeuroImage, vol. 59, no. 1, pp. 297–305, jan 2012.
[14] F. Schweser, A. Deistung, B. W. Lehr, and J. R. Reichenbach, “Quantitative imaging of intrinsic magnetic tissue properties using MRI signal phase: An approach to in vivo brain iron metabolism?” NeuroImage, vol. 54, no. 4, pp. 2789–2807, 2011.
[15] P. S. Özbay, A. Deistung, X. Feng, D. Nanz, J. R. Reichenbach, and F. Schweser, “A comprehensive numerical analysis of background phase correction with V-SHARP,” NMR Biomed (epub)
[16] B. Wu, W. Li, A. Guidon, and C. Liu, “Whole brain susceptibility mapping using compressed sensing.” Magn Reson Med, vol. 24, pp. 1129–36, 2011.
[17] F. Schweser, K. Sommer, A. Deistung, and J. R. Reichenbach, “Quantitative susceptibility mapping for investigating subtle susceptibility variations in the human brain.” NeuroImage, vol. 62, no. 3, pp. 2083–2100, 2012.
[18] S. Kim, S. Pickup, O. Hsu, and H. Poptani, “Enhanced delineation of white matter structures of the fixed mouse brain using Gd-DTPA in microscopic MRI.” NMR Biomed, vol. 22, no. 3, pp. 303–9, 2009.
Figures