4516
Reduced Brain Glutamine in Female Varsity Rugby Athletes after Concussion1Centre for Functional and Metabolic Mapping, Robarts Research Institute, London, ON, Canada, 2Medical Biophysics, University of Western Ontario, London, ON, Canada, 3Robarts Research Institute, London, ON, Canada, 4Microbiology and Immunology, University of Western Ontario, London, ON, Canada, 5Family Medicine and Fowler Kennedy Sport Medicine Clinic, University of Western Ontario, London, ON, Canada, 6Physical Medicine and Rehabilitation, University of Western Ontario, London, ON, Canada, 7Paediatrics Critical Care Medicine, London Health Sciences Centre, London, ON, Canada, 8Anatomy and Cell Biology, University of Western Ontario, London, ON, Canada
Synopsis
The effect of concussion on female athletes is underreported in the literature. This study found reduced glutamine in the prefrontal white matter of female varsity rugby athletes after concussion and in non-concussed athletes after a season of play using proton magnetic resonance spectroscopy (MRS). Additionally, using diffusion tensor imaging, decreased fractional anisotropy and increased radial diffusivity were found within the spectroscopy voxel in athletes after a season of play. The observed changes were uncorrelated with clinical test scores suggesting these imaging metrics may be more sensitive to brain injury and could aid in concussion diagnosis and monitoring.
Purpose
Adolescent athletes participating in contact sports have a high risk of sustaining a concussion, which can lead to structural and metabolic changes in the brain. Relatively little is known about the effect of concussion on female athletes. The purpose of the current study was to measure changes in prefrontal white matter metabolite levels using magnetic resonance spectroscopy in female university varsity rugby athletes after a season of play and following concussion.Methods
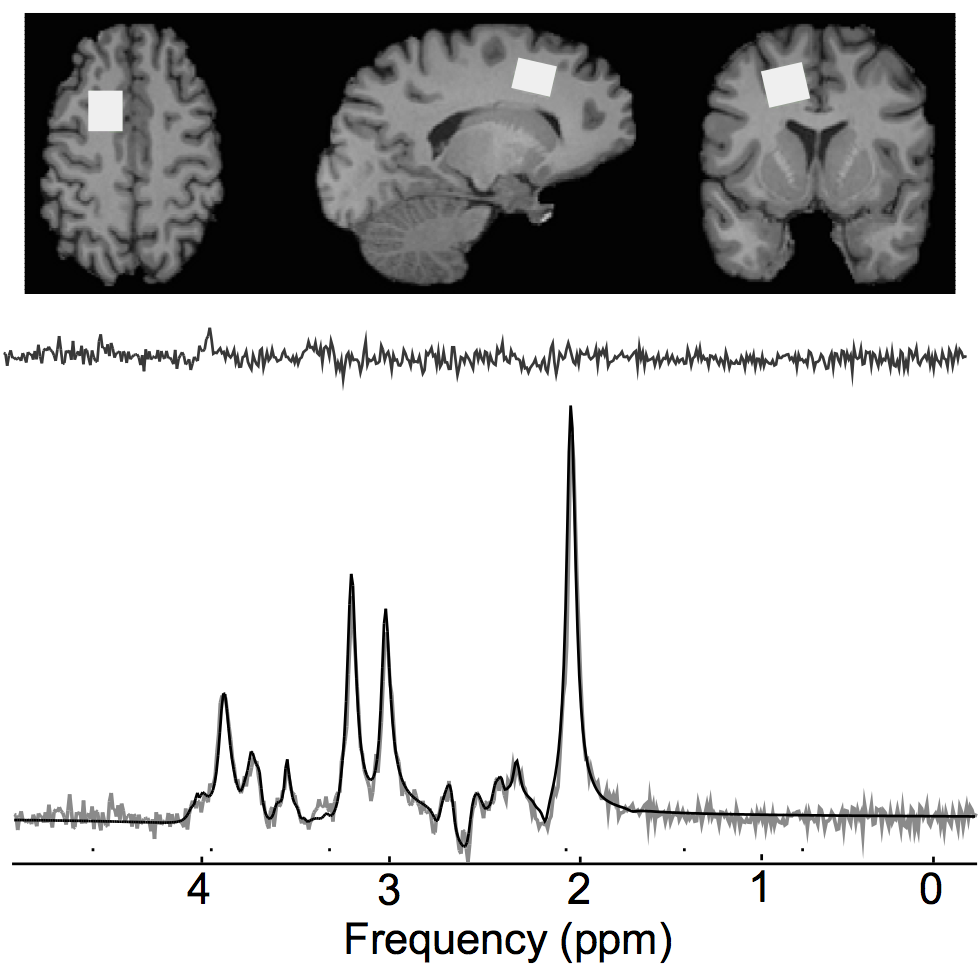
All participants in this study were athletes between the ages of 18 and 22 recruited from a women’s varsity rugby team. Evaluations included clinical tests, blood collection, and 3T magnetic resonance imaging to acquire diffusion tensor images (TE/TR = 79/7200 ms, matrix size = 98 x 98, number of slices = 64, slice thickness = 2 mm, b1 = 0, b2 = 1000 s/mm2, gradient directions = 64, IPAT acceleration factor = 3) and a 1H spectrum (TE/TR=135/2000 ms, averages= 192) in the left prefrontal white matter (Fig. 1A). Athletes were evaluated at the beginning of the season (in season, N=63) and followed up at the end of the season (off season, 160±39 days, N=56). Concussed athletes were additionally evaluated at 24-72 hours (N=14), three months (N=11), and six months post-concussion (N=8).
Spectra were lineshape corrected by QUECC1 then fitted in the time domain using a Levenberg-Marquardt minimization routine (Fig. 1B). The analysis software (fitMAN)2 created in our laboratory in the IDL (version 5.4 Research Systems Inc., Boulder, CO, USA) programming language was used to model the in vivo spectra using prior knowledge of metabolite lineshapes acquired from in vitro spectra obtained from aqueous solutions of all metabolites at pH=7.0.2
Raw DTI data were eddy-current corrected and conservatively brain extracted using FSL tools (FMRIB, Oxford). A diffusion tensor was fitted at each voxel to create maps of fractional anisotropy (FA), mean diffusivity (MD), radial diffusivity (RD) and axial diffusivity (AD). These maps were then registered and transformed to standard space using the standard MNI 2 mm atlas.3 To ensure alignment to the preprocessed and registered DTI data, a voxel that only included white matter (gray matter and CSF masked) was aligned over the spectroscopy voxel. The FA, MD, RD, and AD values were extracted from this voxel and correlated with the MRS-derived metabolite levels.
A repeated measures two-tailed Student’s t-test with an alpha value of 0.05 was used to compare metabolites between the in season and off season time points in the non-concussed group. In the concussed group a one-way ANOVA was used to compare metabolites across all time points, followed up with Tukey’s multiple comparisons test.
Results
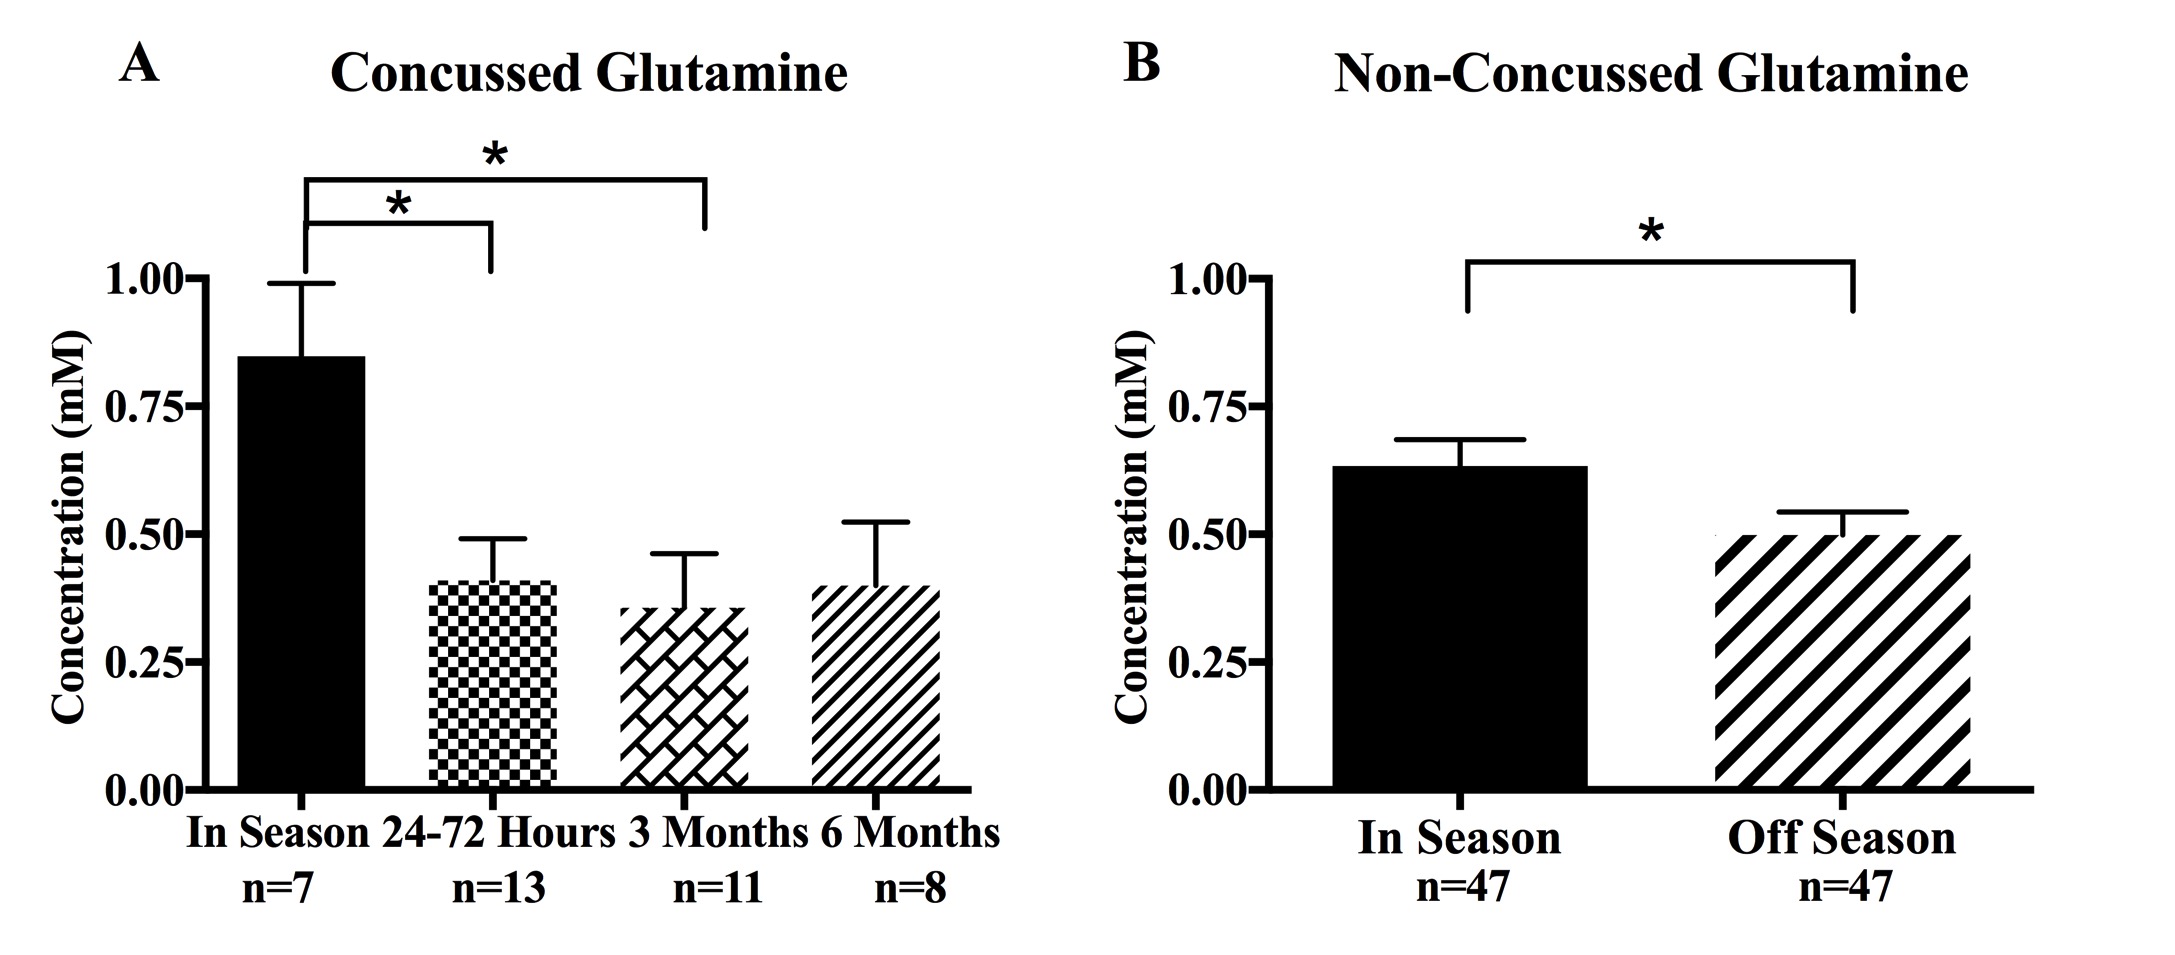
Glutamine was significantly altered in the concussed group (Fig. 2A, F=3.59, P=0.02), with a 52% decrease in the mean observed at 24-72 hours post-concussion (P=0.04) and a 58% decrease at 3 months post-concussion (P=0.02). Surprisingly, a 21% decrease in glutamine was observed in the non-concussed group in the off season compared to the in season (Fig. 2B, P=0.01). When examining metabolite ratios, a change in the glutamine/creatine (Gln/Cr) ratio was also found in the concussed group (F=3.452, P=0.03), with a 58% decrease observed at 3 months post-concussion (P=0.03) relative to in season. A 25% decrease in Gln/Cr in the non-concussed group was observed in the off season compared to the in season (P=0.01). No other metabolite changes were found.
In the non-concussed group, an increase in FA (P=0.01) was observed within the spectroscopy voxel, and a negative correlation was found between the change in Gln/Cr and the change in FA (P=0.01, r= -0.34). A decrease in RD (P<0.05) was observed within the spectroscopy voxel in the same group, and a positive correlation between the change in Gln/Cr and change in RD (P=0.002, r=0.45) was observed. Similar changes were observed over the course of two consecutive seasons in a sub-set of athletes.
Discussion and Conclusion
The decrease in glutamine and Gln/Cr observed in the days and months post-concussion in the current study is consistent with studies of rodent models using 13C spectroscopy that have found reduced glutamine levels up to 24-hours post-injury, suggesting the reduction in glutamine is the result of reduced glucose metabolism.4 In the non-concussed group, we also found a significant increase in FA and decrease in RD at the off season. These results suggest alterations in the white matter microstructure within the voxel. Similar changes have been associated with neuroinflammation,5 as well as re-myelination.6 The observed changes were uncorrelated with clinical test scores suggesting these imaging metrics may be more sensitive to brain injury and could aid in concussion diagnosis and monitoring.Acknowledgements
Funding was provided by the Schulich School of Medicine at Western University. We thank all our athletes for their participation.References
1. Bartha R, Drost DJ, Menon RS, Williamson PC. Spectroscopic lineshape correction by QUECC: combined QUALITY deconvolution and eddy current correction. Magn Reson Med. 2000;44: 641-645.
2. Bartha R, Drost DJ, Williamson PC. Factors affecting the quantification of short echo in-vivo 1H MR spectra: prior knowledge, peak elimination, and filtering. NMR Biomed. 1999;12: 205-216.
3. Mazziotta JC, Toga AW, Evans AC, Fox P, Lancaster J. A probabilistic atlas of the human brain: theory and rationale for its development. NeuroImage. 1995;2(2):89–101.
4. Bartnik BL, Hovda DA, Lee PWN. Glucose metabolism after traumatic brain injury: estimation of pyruvate carboxylase and pyruvate dehydrogenase flux by mass isotopomer analysis. J Neurotrauma. 2007;24(1):181-194.
5. Sasaki T, Pasternak O, Mayinger M, Muehlmann M, Savadjiev P, Bouix S, et al. Hockey Concussion Education Project, Part 3. White matter microstructure in ice hockey players with a history of concussion: a diffusion tensor imaging study. J Neurosurg. 2014;120(4):882-890.
6. Lipton ML, Kim N, Park YK, Hulkower MB, Gardin TM, Shifteh K, et al. Robust detection of traumatic axonal injury in individual mild traumatic brain injury patients: intersubject variation, change over time and bidirectional changes in anisotropy. Brain Imaging Behav. 2012;6(2):329-342.
Figures