4512
Multi slice MRSI-based generation of nosological images of therapy response using a semi-supervised source extraction approach in preclinical glioblastoma.1Departament de Bioquímica i Biologia Molecular, Unitat de Bioquímica de Biociències, Universitat Autònoma de Barcelona, Cerdanyola del Vallès, Spain, 2Networking Research Center on Bioengineering, Biomaterials and Nanomedicine (CIBER-BBN), Cerdanyola del Vallès, Spain, 3Servei de Ressonància Magnètica Nuclear, Universitat Autònoma Barcelona, Cerdanyola del Vallès, Spain, 4Institut de Biotecnologia i de Biomedicina, Universitat Autònoma de Barcelona, Cerdanyola del Vallès, Spain
Synopsis
Glioblastoma (GBM) is the most common aggressive primary brain tumour in adults and characterization of response to treatment turns out to be crucial for improving patient survival. In this work we obtained 3D-like information, from preclinical GBM under temozolomide (TMZ) treatment, with a multi-slice MRSI approach using source-based nosological images as response biomarker. A “Tumour Response Index” (TRI) was defined as the percentage of responding tumor pixels divided by the total tumour pixels. Heterogeneous response patterns with cyclical longitudinal variations were observed in several mice while responding pixels were mostly seen at the first 2 upper grids.
Introduction
Glioblastoma (GBM) is the most common aggressive primary brain tumour in adults, with a survival time of 12–15 months with standard treatment [1]. Its usual bad prognosis, due to the heterogeneity of its response to therapy, makes the characterization of this response relevant for improving patient survival. In previous work [2] we produced nosological images of therapy response using a semi-supervised source extraction approach in preclinical GBM based on single slice Magnetic Resonance Spectroscopic Imaging (MRSI). Nevertheless, GBM are heterogeneous and the study of only one slice could be hindering us from obtaining relevant response information.Goal
To acquire 3D-like information from preclinical GBM under a longitudinal treatment protocol, using a multi-slice MRSI approach producing source-based nosological images as response biomarker.Material and Methods
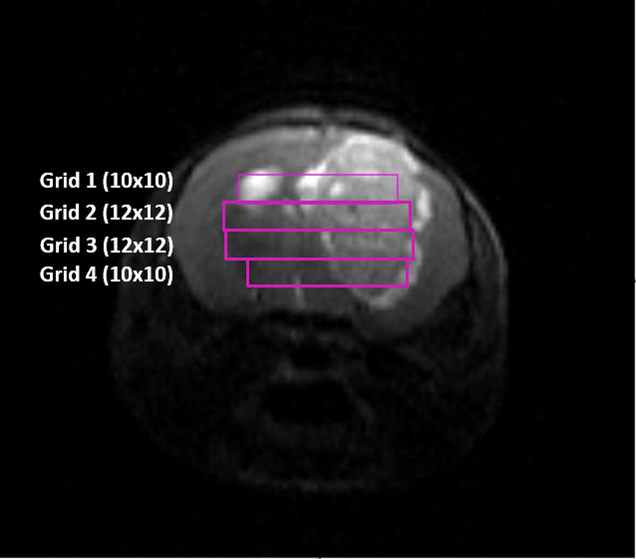
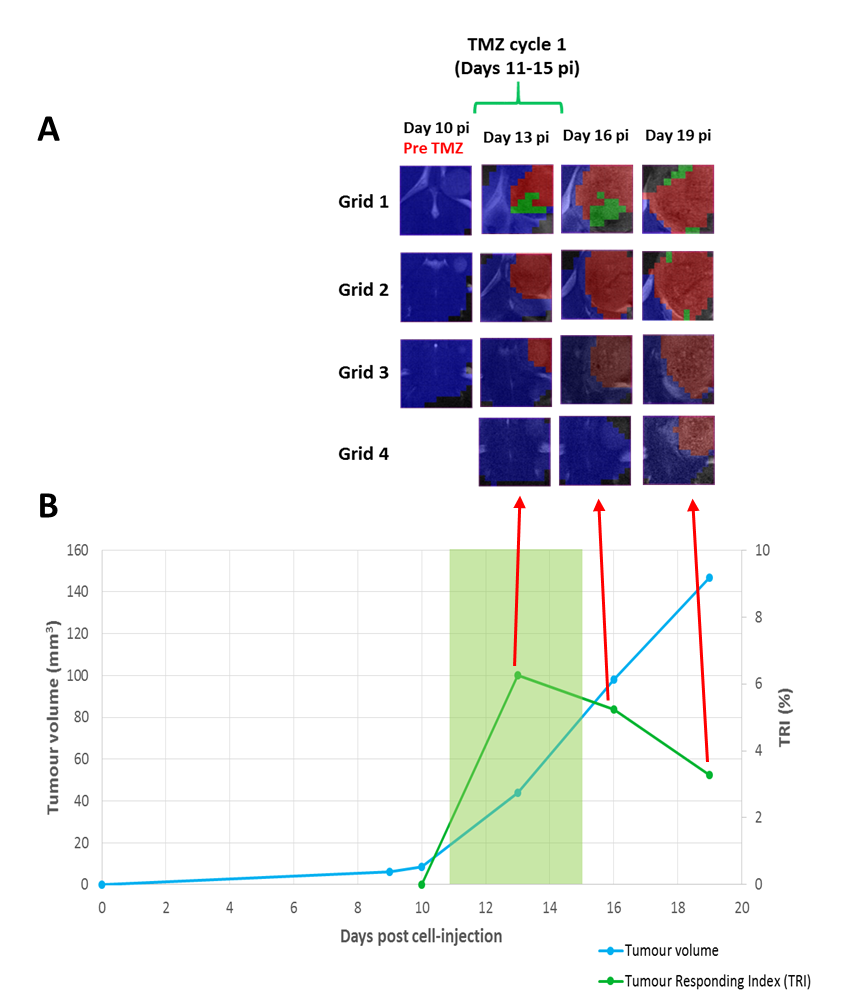
Tumours were induced in C57BL/6 female mice by intracranial injection of 105 GL261 cells in the right caudate nucleus (n=10) as in [3]. Temozolomide (TMZ) treatment was administered by oral gavage with a dose of 60 mg/Kg during 3 therapy cycles. Magnetic Resonance Imaging/Spectroscopic Imaging (MRI/MRSI) studies were carried out at 7T with isoflurane anesthesia (1.5-2%). MRSI experiments were performed every 2-3 days since day 10 post-injection (p.i.) (pre-therapy). Three to four MRSI grids were acquired across the tumour (Figure 1): Grids 1 and 4 with 10x10 voxels and Grids 2 and 3 with 12x12 voxels. Total acquisition time for this experiment was 3-4 hours/animal. MRSI parameters and data were processed as in [2]. Nosological maps based on semi-supervised convex Non-negative Matrix Factorization (implemented in Matlab) were calculated for three sources: normal brain, actively proliferating tumour and responding tumour. Nosological images (figures 2A and 3A) were analyzed pixel-by-pixel where red pixels correspond to actively proliferating tumour, green pixels correspond to voxels with tumour tissue responding to therapy, blue pixels correspond to normal brain parenchyma and black pixels were “undecided” (the system could not classify them into any of the three mentioned sources). Then, a “Tumour Response Index” (TRI) was defined as the percentage of responding tumor pixels divided by the total tumour pixels. A tentative range for TRI was established to categorize therapy response: “no response cases” (NR), TRI ≤35%; “partial response cases” (PR), TRI=35-65%; “full response cases” (FR), TRI≥65%. For responding cases, at least two consecutive slices with responding pixels were required for inclusion into the category. Mice were euthanized after MRSI at predefined time points and brains were stored in 4% paraformaldehyde for further histopathological analysis.Results
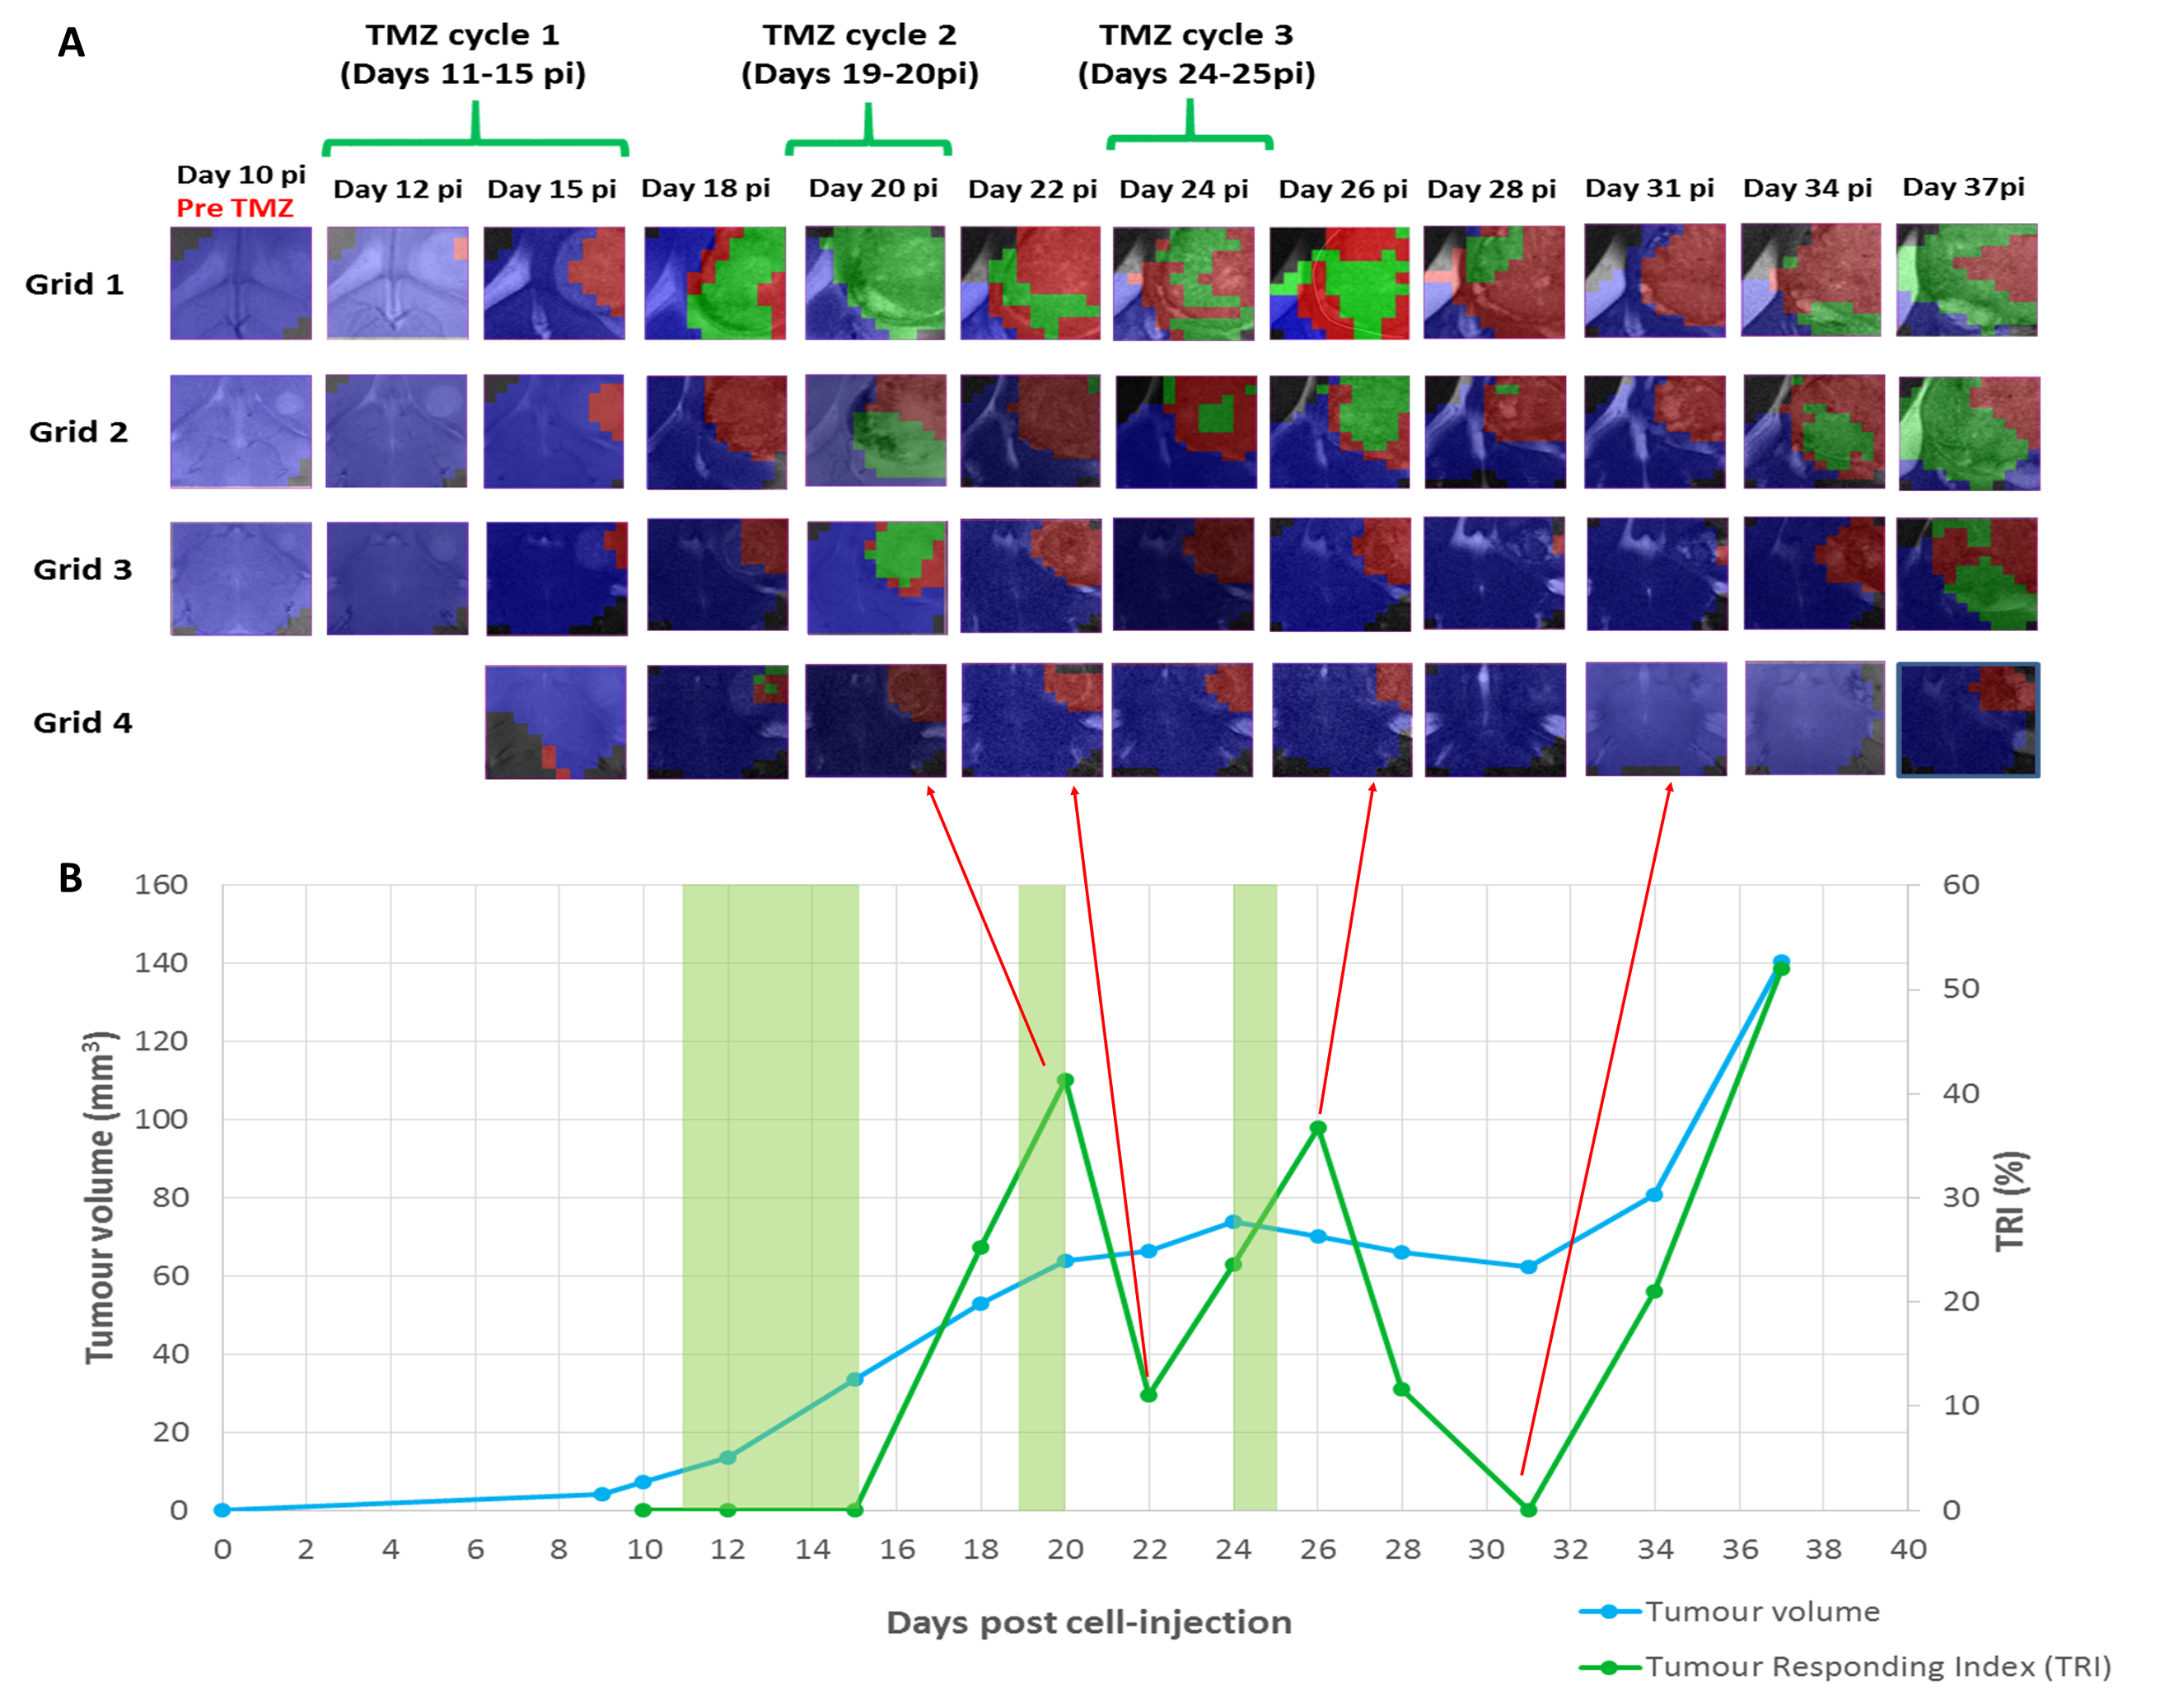
Heterogeneous response patterns were observed in all mice and responding pixels were mostly seen at the first 2 upper grids. For FR cases (n=2) a TRI=68.2%±2.8 was observed after the third TMZ cycle, for PR cases (n=6) a TRI=41.1%±4.2 was observed after the second TMZ cycle, and NR cases died before the second TMZ cycle (n=2, TRI=13.4%±14.3). Longitudinal studies for a representative NR case and a PR case are displayed in Figures 2 and 3 respectively, showing the evolution of nosological images (overlaid on T2w MRI), tumour volume and TRI over tumour growth. Preliminary results from histopathological analysis suggest an inverse correlation between the proliferation index Ki67 and TRI as described in [2], and also confirm the morphological changes observed in tumour-treated cells, with the appearance of giant cells.Discussion/Conclusion
The results obtained indicate that a multi-slice recording approach is feasible and may be beneficial to properly track and evaluate the overall therapy response from preclinical GBM. This approach may be used to generate “Tumour response to treatment” volumetric maps to follow-up treatment response biomarkers and decide about further therapy. Several possible reasons may explain the TRI cyclical pattern observed in PR cases (see example in Figure 3). Research over the past decades has demonstrated that the immune system plays a critical role in the response of various malignancies to therapy. The immune system cells are attracted by immunogenic cell death promoted by therapeutic agents [4]. It has also been shown that proper activation of adaptive immune response in mouse brain may require about 6-7 days [5] which could be partially in agreement with our TRI results. Ongoing histopathological analysis may provide additional details about cellular changes taking place when such response to therapy is detected.Acknowledgements
This work was funded by the Ministerio de Economía y Competitividad (MINECO) grant MOLIMAGLIO (SAF2014-52332-R). Also funded by the ISCiii-Subdirección General de Evaluación and European Regional Development Fund (ERDF), and by Centro de Investigación Biomédica en Red—Bioingeniería, Biomateriales y Nanomedicina (CIBER-BBN, http://www.ciber-bbn.es/en), an initiative of the Instituto de Salud Carlos III (Spain) co-funded by EU Fondo Europeo de Desarrollo Regional (FEDER). Time allocated in the joint nuclear magnetic resonance facility of the Universitat Autònoma de Barcelona and Centro de Investigación Biomédica en Red-Bioingeniería, Biomateriales y Nanomedicina (CIBER-BBN) (Cerdanyola del Vallès, Spain), Unit 25 of NANBIOSIS (http://www.ciber-bbn.es/plataformas/nanbiosis-icts), is gratefully acknowledged.References
1. Stupp, R, et al. N Engl J Med (2005) 352:987-96.
2. Delgado-Goñi, T, et al. NMR in Biomedicine (2016), 29:732-743
3. Simoes, RV, et al. NMR Biomed (2008) 21:251-64.
4. Vacchelli, E., et al.Oncoimmunology, 2014. 3(1): p. e27878.
5. Karman, J., et al. J Immunol, 2004. 173(4): p. 2353-61.
Figures