4511
An experimental and computational study of magnetic nanoparticle movement in response to an external magnetic forceAreej Alghamdi1, Munitta Muthana1, and Martyn Paley2
1Oncology and Metabolism, University of Sheffield, Sheffield, United Kingdom, 2Academic Radiology, University of Sheffield, Sheffield, United Kingdom
Synopsis
This study investigates the ability of two different magnet arrays to capture magnetic nanoparticles from a flow system located at different distances from the magnet face. The magnet fields and gradients and hence magnetic forces were simulated using FEMM software. MR Images were acquired to qualitatively assess the trapping which were compared with quantitative iron concentrations measured using inductively coupled plasma mass spectrometry.
Introduction
Steering magnetic nanoparticles (MNPs) in a desired trajectory has been proposed for guiding magnetically labelled drugs to clinical targets1. White blood cells (WBCs) have the ability to take up MNPs, which are loaded with drugs to be steered under the effect of magnetic fields to the target. This approach aims to concentrate the drug at the site of interest, which helps to reduce the risk to the patient via increasing the benefit of the therapy whilst sparing healthy tissue. The number and size of MNPs are important parameters; large MNPs require a stronger magnetic force to guide them. The product of the magnetic field and gradient, which is proportional to force decreases with distance from a magnet assembly. We have used in silico modelling to investigate two basic building block magnets for magnetic array generation with the aim of generating personalized magnetic treatment plans based on MRI scans. The purpose is to guide MNPs to target tissues containing tumors. Both computational and in vitro models are presented to determine the effect of force on MNPs. We also demonstrate that WBCs efficiently take up MNPs that can then be used in magnetic drug targeting therapy (MDT).Methods
Computational model: Two magnetic assemblies (described below) were modeled using FEMMv4.2 with Lua scripting as shown in Figure 1 and the magnetic force on single and multiple MNPs, 50nm diameter, calculated as a function of position, Figure 2. In vitro model: A strong magnetic field and gradient was produced using a cylindrical Halbach array (30mm ID) and a pair of NdFeB-52 blocks (55(W), 108(L), 55(H) mm) separated by 25mm. A peristaltic pump and 5m of clear flexible tube were used to create an open flow system for a solution of aqueous Fe3O4 MNPs with a flow rate of 17mL/min. The experiment was repeated with the tube at different distances parallel to the magnet (0mm, 7mm, 17mm, 30mm and 45mm). Concentration of MNPs was quantified by inductively coupled plasma mass spectrometry (ICP) as shown in Figure 3b and 3c,. T2* weighted images of the collected samples were obtained using MRI (3T) as shown in Figure 4 to qualitatively assess particle trapping. In addition, WBCs were isolated from human blood packs using Ficoll and density gradient centrifugation. Three million peripheral blood mononuclear cells (PBMC),were incubated with 0.1mg/mL MNPs on an orbital shaker at 370C for one hour. The cells were washed in saline to remove any unbound MNPs (Figure 5).Results
Figure 2a shows the geometry for simulating magnetic forces on multiple MNPs vs distance. Figure 2b shows the calculated magnetic force on multiple MNPs vs. distance. The maximum force was observed at the edge of the magnet as expected. Figure 3a shows magnetic field vs. distance from the surface of the Block magnet. Figure 3b and 3c show concentration of iron vs distance from the surface of the Block magnet and Halbach array respectively, as measured by ICP. The experiment was repeated with the tube at different distances parallel to the magnet (0mm, 7mm, 17mm, 30mm and 45mm). Figure 4 shows a T2* weighted MR scan of trapped samples with the image intensity decreasing as a function of distance as the number of particles trapped by the magnet decreases. Two different collection times were used (30, 120s). Figure 5: shows MNPs attached to PBMCs. Here cells were cultured in growth medium (IMDM) supplemented human AB serum. Light microscopy image (Leica, Wetzlar, DE) shows healthy monocytes attached to the surface with internalized iron particles.Discussion and Conclusion
Two magnetic array designs were modeled and the effect of magnetic force on MNPs calculated using FEMM. The Halbach array produced a stronger magnet field inside the bore of 1Tesla with a gradient up to 50mm from the magnet of 20T/m. The magnetic force away from the magnet was higher than for the Block magnet which had a field of 0.8T and a gradient of 16T/m up to 50mm from the magnet face. The calculated and measured magnetic fields and field gradients were in good agreement for both permanent magnet designs. MRI measurements confirmed greatest trapping ability with the tube closest to the magnet as expected, which also agreed with the ICP measurements. Force calculations predicted peak trapping locations. These arrays could be used to capture particles within relatively superficial extremity tumors. PBMCs showed their ability to take up MNPs, showing promise for MDT. We are now focusing on trapping human PBMCs carrying MNPs with more complex magnetic arrays and phantom geometries 3D printed from MRI data that mimic tumors and vasculature.Acknowledgements
We acknowledge the UK MRC for funding from a Confidence in Concept grant. In addition, we acknowledge the Saudi Arabia Cultural Bureau in London and the Prince Sultan Military Medical City in Riyadh for funding a PhD studentship.References
1. Muthana M, Kennerley AJ, Hughes R, Fagnano E, Richardson J, Paul M, et al. Directing cell therapy to anatomic target sites in vivo with magnetic resonance targeting. Nat Commun 2015;6:8009.Figures
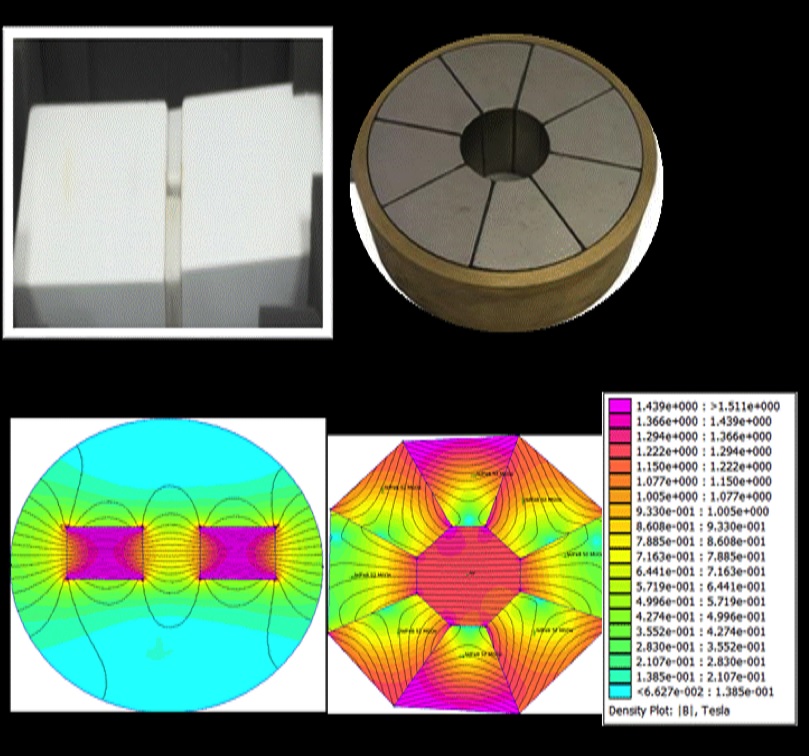
Figure 1. Images of the block magnet and Halbach array (top) and the calculated fields using FEMM (bottom).
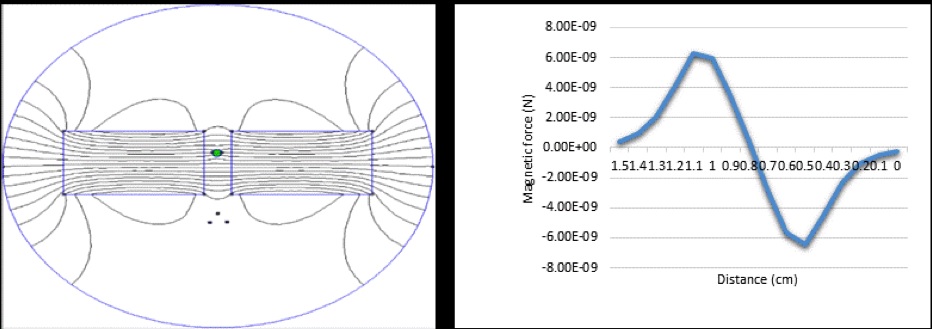
Figure 2. Geometry of magnet and particles for force simulation (left). Simulated forces on MNPs using FEMM with Lua scripting (right).
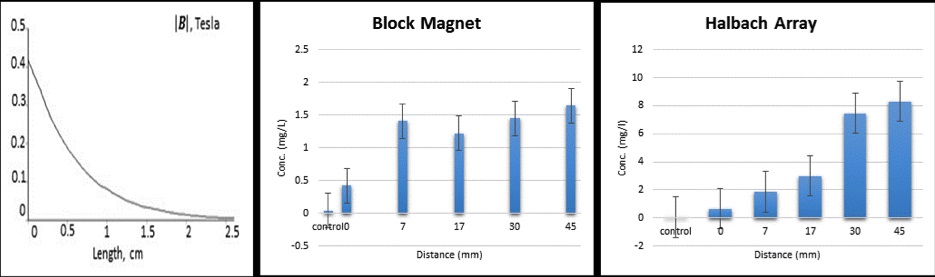
Figure 3. Calculated field away from the face of the block magnet (left). MNP concentration as a function of distance from the magnet - Block magnet (middle) and Halbach array (right).
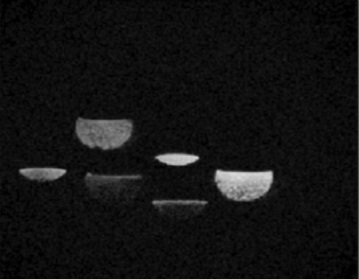
Figure 4. T2* weighted MR image of six collection vials after MNP trapping by the Block array at three different distances (0, 7, 17mm) for two different trapping times (30, 120s). The three images with less fluid were trapped over 30s and the three images with more fluid over 120s. Image intensity was inversely related to the concentration of iron as shown in figure 3b with the brightest images from fluid collected from the tube at the magnet face which trapped most particles, thus leaving fewer particles in the collection vial.
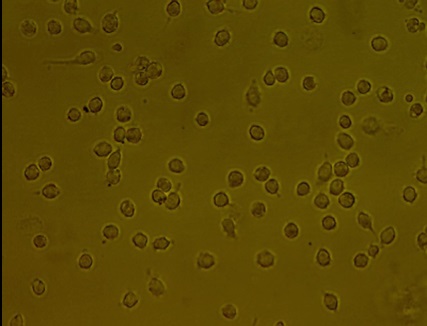
Figure 5. Magnetic Nano Particles attached to Peripheral Blood Mononuclear Cells.