4508
Microenvironmental changes in prostatic tissues in relation to tumor growth in low risk prostate cancerHugh Harvey1, Veronica A Morgan1, Christopher Parker2, and Nandita M deSouza1
1CRUK Imaging Centre, The Institute of Cancer Research, Surrey, United Kingdom, 2Academic Urology Unit, The Royal Marsden Hospital NHS Foundation Trust, Sutton, United Kingdom
Synopsis
In 50 men with prostate cancer managed by active surveillance, changes in diffusion and perfusion within normal prostate and tumor were compared between those whose tumors did (“Growers”) or did not grow. 14% had >50% increase in tumor volume on MRI at 1-year. In these men, ADC of normal PZ was lower and more homogenous and remained unchanged over time; vascular metrics also remained stable. In TZ, no changes occurred in ADC or vascular metrics. In tumor, Kep increased with time in growers and ADC histogram metrics showed a left-shift indicating changes in tumor vascular and cellular microstructure with progression.
Introduction
Multiparametric (mp) MRI is used in the detection and monitoring of prostate tumor in patients on active surveillance (AS), with scans being repeated yearly or two-yearly. Quantitative DWI and DCE-MRI offers potential for providing information on changing characteristics within the tumor1,2 and within normal prostatic tissues.Aim
To compare changes in water diffusion (on Diffusion Weighted Imaging [DW]I) and perfusion (on Dynamic Contrast Enhanced [DCE] MRI) within normal prostate and tumor tissue between men whose tumors progress whilst on AS and those that do not.Methods
50 men managed by AS had both DWI and DCE-MRI at 2 time points. Mean age at first scan was 68±7 years and mean PSA was 8.5±4.2 ng/mL. All patients had biopsy proven tumor Gleason 3+3 (n=35), 3+4 (n=13) or 4+3 (n= 2). MRI was performed at 3T (Achieva, Philips, Best, The Netherlands) with an endorectal coil inflated with 60mls of perfluorocarbon. Hyoscine butylbromide (20 mg) was administered intramuscularly. T2-W images in 3 planes orthogonal to the prostate (FSE, TR=2627 ms, TE=110 ms, FoV 120 mm, slice thickness 2.2 mm, 0.1 mm gap, matrix 220×184 extrapolated to 256×256) together with transverse plane DWI images (single shot EPI, TR=5000 ms, TE=54 ms, b = 0, 100, 300, 500, 800 s/mm2, FoV 100 mm, slice thickness 2.2 mm, 0.1 mm gap, matrix 80×79 extrapolated to 176×176) were obtained. DCE images (transverse plane, 3D FFE, SPAIR fat suppression, TR=4.4 ms, TE=2.1 ms, FoV 120 mm, flip angle 16°, matrix 76x98 extrapolated to 224x244, 24 contiguous 2.3 mm slices, 0 gap at 20 time points, temporal resolution 12 secs) at the same central angle and offset were acquired following intravenous administration of 0.2 mL/kg of gadoterate meglumine (Dotarem, Guerbet, USA) at 2.0 mL/s. In addition, pre-contrast images acquired with the same measurement parameters and positions and flip angles of 3° and 16°, enabled estimation of T1. The MR-visible dominant intraprostatic tumor lesion only was analyzed in each patient. ROIs were drawn around the dominant intraprostatic tumor on all slices of the T2-W transverse images, using corroborative visual information from the ADC map, DCE images and biopsy. ROIs were also drawn around normal peripheral zone (PZ) and transitional zone (TZ) on all slices. All ROIs were re-mapped onto the ADC map and DCE images using a re-mapping tool (ADEPT, in-house software). ADC, Ktrans, Kep, Ve and IAUGC60 were recorded for PZ, TZ and tumor.Results
Using a 50% volume increase per annum to define significant growth, 7 of 50 patients’ tumors (14%) increased in volume (Growers), while 43 patients were thus defined as Non-Growers. In the PZ, ADC mean, median, 75th centile and interquartile range were significantly lower in Growers than Non-Growers at both scan1 (p=0.03, 0.03, 0.01, 0.007 respectively) and scan 2 (p=0.04, 0.04, 0.03 and 0.05 respectively), but there were no significant changes in ADC metrics within groups between time points, indicating that in the PZ, ADC in both Growers and Non-Growers remained stable over time [Figure 1]. Vascular metrics did not differ between groups, nor did they change significantly. In the TZ, neither the ADC metrics nor the vascular metrics were different between groups, nor did they change over time. In tumor, there was a left shift of the histogram with a reduction in median and 25th centile ADC values in Growers but not in Non-Growers [Figure 2] although mean differences in these parameters between patients classified as Growers vs. Non-Growers were not significant. Kep increased significantly with time in growers (p=0.03), but Ktrans, Ve and IAUGC60 did not.Discussion and Conclusion
In a low risk prostate cancer population on AS, 14% of men had a >50% increase in tumor volume on MRI at 1 year. In those that grew, the ADC of the normal PZ was lower with values more homogenously distributed but did not change significantly over time; vascular metrics also remained stable. No changes occurred in the TZ in either ADC or vascular metrics. In tumor, the increase in Kep with time and left shift of the ADC histogram in Growers reflects changes in tumor vascular and cellular microstructure and may be useful in monitoring tumor progression.Acknowledgements
CRUK and EPSRC support to the Cancer Imaging Centre at ICR and RMH in association with MRC and Department of Health C1060/A10334, C1060/A16464 and NHS funding to the NIHR Biomedical Research Centre and the Clinical Research Facility in Imaging.References
1. Elbuluk O. et al J of computer assisted tomography, 2016. 40: 218-24.
2. Oto, A. et al AJR.2011. 197: 1382-90.
Figures
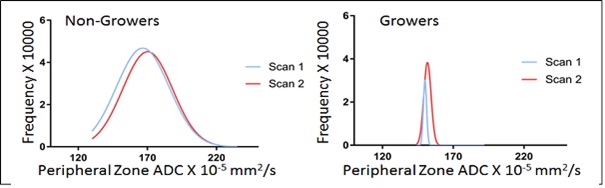
Figure 1: ADC metrics in PZ in
Non-Growers (left) and Growers (right)
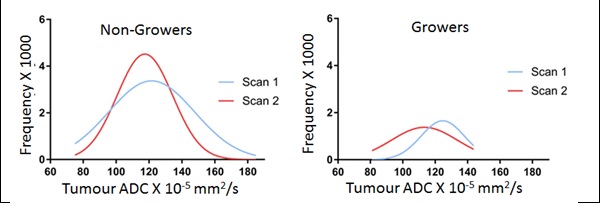
Figure 2: ADC metrics in tumor
in Non-Growers (left) and Growers (right)