4507
A probabilistic approach to automated classification of distinct pathological regions in soft tissue sarcoma using diffusion and T2 relaxation1Physics, McGill University, Montreal, QC, Canada, 2Medical Physics Unit, McGill University, Montreal, QC, Canada, 3Radiation Oncology, McGill University Health Centre, Montreal, QC, Canada, 4Pathology, McGill University Health Centre, Montreal, QC, Canada, 5Research Institute of the McGill University Health Centre, Montreal, QC, Canada
Synopsis
In this work, we propose a novel probabilistic reference-region-based segmentation method to automatically distinguish various pathological tissue regions within soft tissue sarcoma, including high cellularity, high T2 and necrosis. The classification is based on a calculation of the probability that a tumour voxel belongs to a given class using the quantitative diffusion and T2 information when compared to a reference tissue. The probabilistic approach provides a more realistic classification of the complex tumour microenvironment compared to the previous proposed binary classification method.
Introduction
Soft tissue sarcoma are aggressive and highly heterogeneous tumours. Quantitative and functional imaging techniques are essential to delineate pathological tumor sub-regions known as habitats, which could provide useful information about sub-region targets for radiation dose painting (1). We previously proposed a binary segmentation method that combines maps of T2, ADC, and a quantitative surrogate for high-b-value diffusion weighted MRI (called simDWI) to automatically distinguish tumor habitats, including high cellularity, high T2 and necrosis (2). This method was based on prior qualitative work done to identify tumor habitats via visual inspection (3). Binary classification assumes that a voxel belongs to a single tumor habitat, which might not reflect the complex microenvironment in a voxel, especially at the border of two habitats. Here, we propose a novel and more sophisticated method that uses probabilistic approach to automated classification of tumor habitats. This approach calculates the probability that a voxel belongs to each class and allows the co-existence of different habitats in the same voxel.Theory
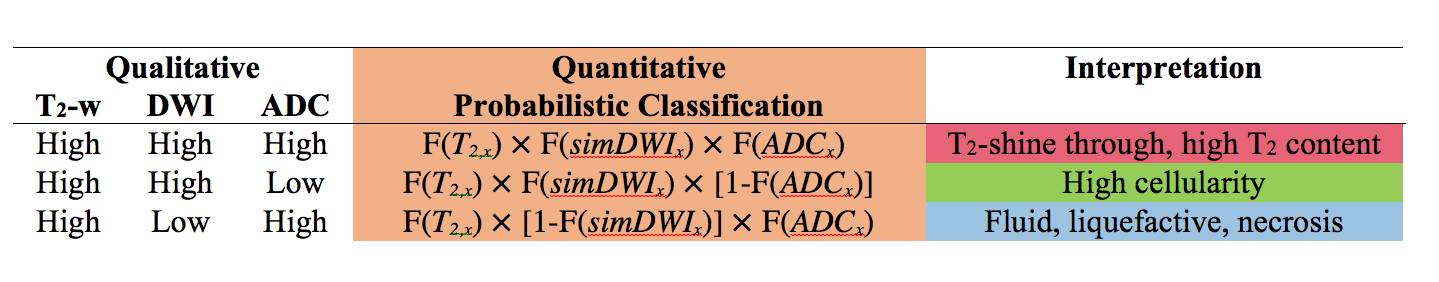
Empirical multi-Gaussian functions are fitted to the probability distribution of the reference tissue (i.e. muscle) ADC, T2 and simDWI in all patients combined (each with R2 > 0.99), to produce the probability density functions $$$p_m(x)$$$, where $$$x$$$ represents each of the three parameter values: ADC, T2 or simDWI and m stands for muscle. The proposed method can then be broken down into a 3-step process:
1. The probability each parameter value $$$x$$$ in a tumor voxel greater than the parameter value of muscle is computed from the cumulative distribution function of the parameter $$$x$$$ in the reference tissue as: $$$F(x) =\int_0^{x}p_m(x^{'})dx^{'} $$$.
2. The probability that a parameter value $$$x$$$ in a tumor voxel is smaller than in the reference is then $$$1-F(x)$$$.
3. The cumulative probability of a voxel belonging to a specific habitat class is the product of probabilities related to each parameter ADC, T2 or simDWI, according to the expressions in Table 1.
The output of the classification can then be visualized by representing each habitat class with a primary (red, green, or blue), where the color saturation reflects the magnitude of the probability.
Methods
Axial 2D fast spin echo (FSE) images with fat saturation (ETL = 9, TR = 3.95 to 6.65 s) and DW-MRI (TE/TR = 88/5000ms, b =100, 800s/mm2) were acquired on a 1.5 T scanner (GE Healthcare) in 6 patients with biopsy-confirmed soft-tissue sarcoma. FSE data were acquired twice for T2 mapping (TE1 =9 to 12 ms, TE2 = 64 to 83 ms). The FOV, number of slices, and slice thickness were adapted for each patient. ADC, T2, simDWI maps were calculated as in the binary classification method (2). Muscle was used as the reference tissue, and regions were identified on 2D-FSE for each patient. All calculations were performed using in-house software MATLAB (The Mathworks Inc). Standard uptake values (SUV) of different habitats from FDG-PET were computed to compare their metabolic differences. All MR and FDG-PET images were registered and resampled to the 2D-FSE space using MIMVista (MIM Software Inc).Results and Discussion
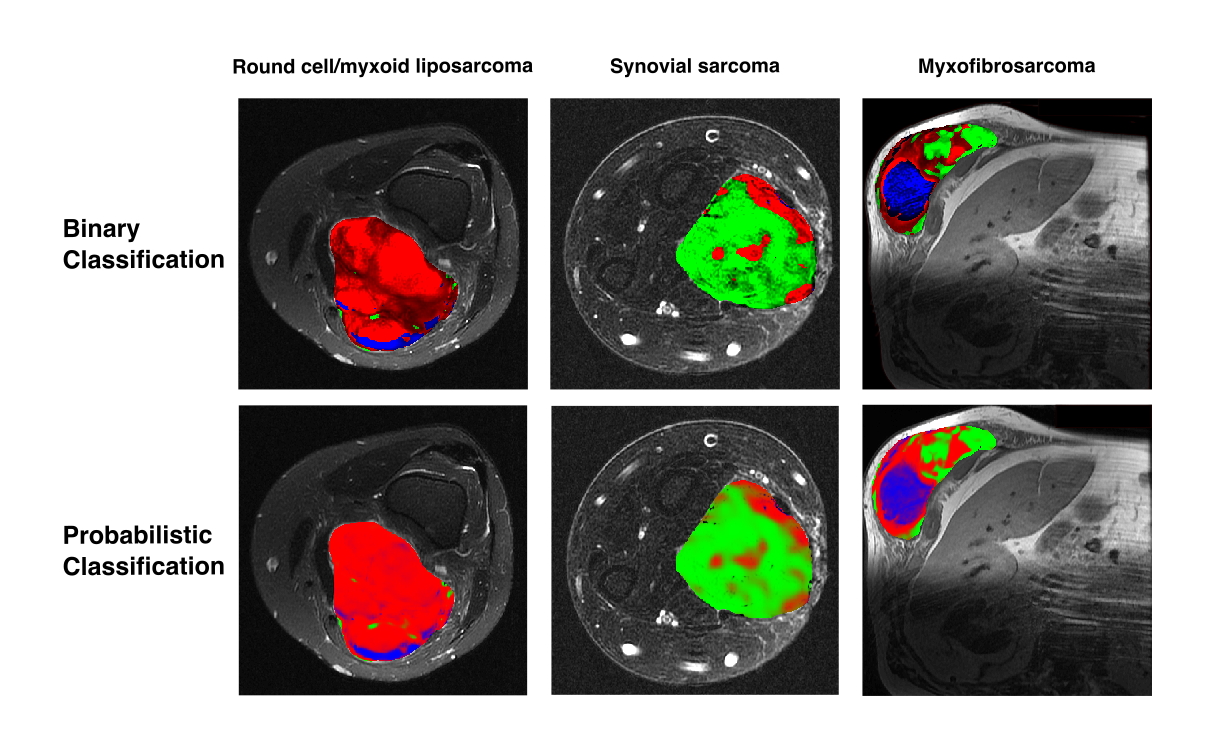
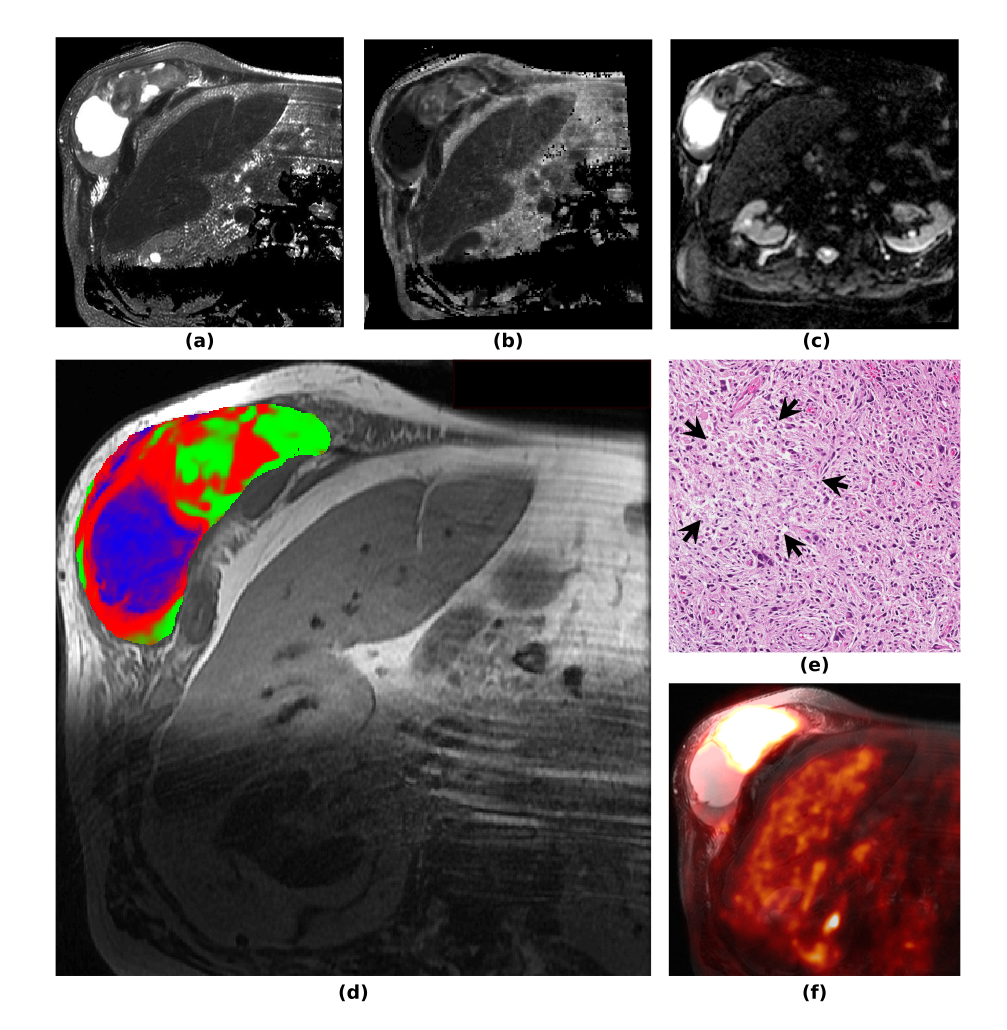
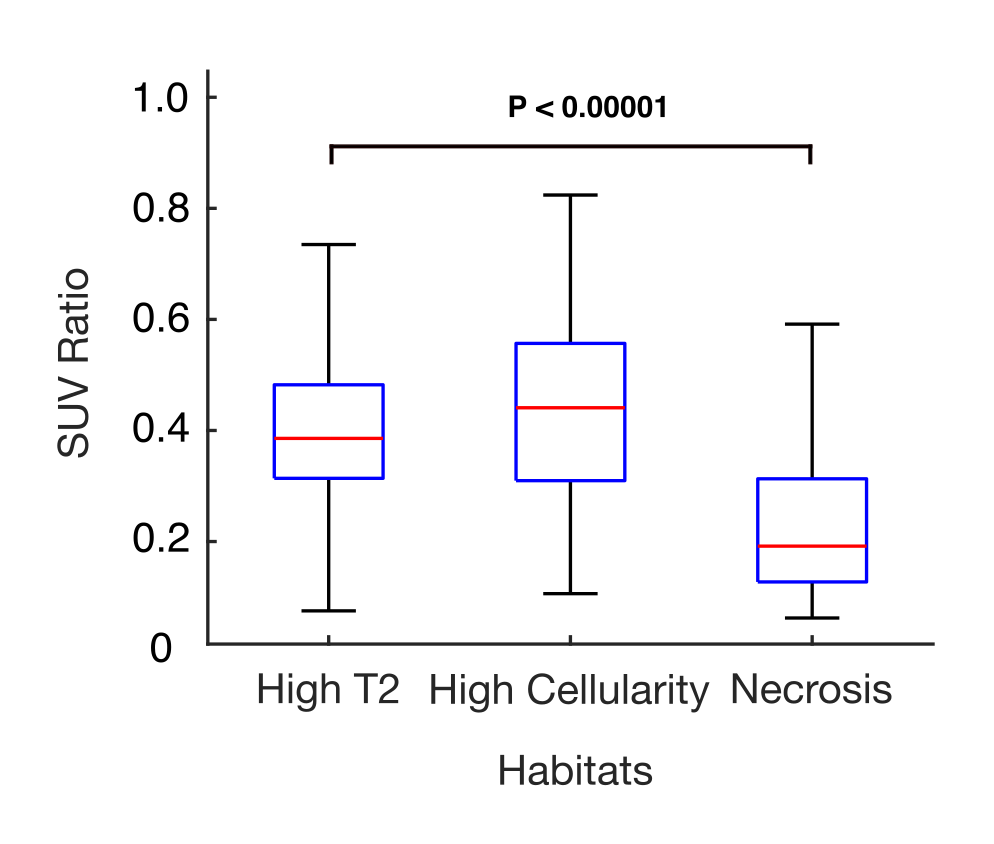
The probabilistic segmentation reliably identified regions of high T2, high cellularity, and necrotic areas for various tumor types (3 cases shown in Fig.1, bottom row). The habitat segmentations are visually consistent with the outcome from the binary classification (Fig.1 top row), but result in a more realistic fuzzy classification at transitions between habitats. Figure 2 shows the segmentation of a high-grade myxofibrosarcoma in the flank, a highly heterogeneous tumor with significant presence of all habitats. The necrotic area (blue) was differentiated from areas of high cellularity (green) and high T2 (red). The presence of necrosis was confirmed by histology (Fig. 2e) and low uptake on PET (Fig. 2f). Notably, muscle regions were not identified for this patient, and the segmentation was performed based on muscle parameter distributions from the other patients. As a preliminary validation of this segmentation technique, voxel-wise SUVratio of each habitat was computed. The SUVratio accounts for the difference in SUVmax for different tumor types. A general trend that SUVratio decreases with cellularity was observed in 4 out of 6 patients. Figure 3 illustrates the SUVratio of all three habitats for the case in Figure 2.Conclusion
We have demonstrated that the probabilistic reference-region-based segmentation can differentiate pathologically important tumor habitats including high cellularity, high T2, and necrosis in soft tissue sarcoma. This approach provides a more realistic classification compared to the previously proposed binary classification, with co-existence of different pathological classes in a given voxel. The complex microenvironment of each tumor voxel is better reflected with this approach.Acknowledgements
Research support from Fonds de Recherche Santé (FRQS) Doctoral Award, CREATE Medical Physics Research Training Network Grant of the Natural sciences and Engineering Research Council (Grant number: 432290), the MGH Foundation, and the Phil Gold Fellowship.References
1. Gillies RJ, Kinahan PE, Hricak H. Radiomics: Images Are More than Pictures, They Are Data. 2016;278(2).
2. Xing S, Freeman CR, Jung S, Levesque IR. Automated segmentation of soft tissue sarcoma into distinct pathological regions using diffusion and T2 relaxation. Proc ISMRM. 2016; 2467.
3. Khoo M, Tyler P, Saifuddin A, Padhani AR. Diffusion weighted imaging (DWI) in musculoskeletal MRI: A critical review. Skeletal Radiology 2011; 40: 665-81
Figures