4506
Exploring flow effects on BOLD MRI with oxygen challenge in orthotopic lung tumor model1Radiology, Univ Texas Southwestern Medical Center, Dallas, TX, United States, 2Radiation Oncology, Univ Texas Southwestern Medical Center, Dallas, TX, United States, 3Advanced Imaging Research Center, UT Southwestern Medical Center, Dallas, TX, United States
Synopsis
Blood oxygen level dependent (BOLD) is sensitive to deoxyhemoglobin providing information on tumor oxygenation. However, the measurements are affected by blood flow. This study explored the extent of flow sensitivity by comparing the BOLD signal intensity and T2* values with and without flow suppression using an orthotopic lung tumor model. T2* appeared to be insensitive to flow for the tumor regions as observed in this preliminary study, while semi-quantitative ΔSI was strongly affected by flow and is a potential caveat. For well vascularized normal tissue (such as liver), flow suppression will be necessary for accurate measurements.
Purpose
Blood oxygen level dependent (BOLD) contrast MRI is sensitive to deoxyhemoglobin. The response of BOLD to oxygen challenge can provide information on tumor oxygenation [1] and could be easily implemented into clinical practice. Oxygen breathing may also induce changes in blood flow, which is known to affect the signal of BOLD (so-called FLOOD: Flow and Oxygen Level Dependent) [2]. This is a particular concern for lung cancer imaging, where there are often large blood vessels around the region of interest. In this study, we compared the BOLD signal intensity (SI) and T2* values with and without flow suppression (fs) to investigate the extent to which these sequences are sensitive to potential changes in blood flow.Methods
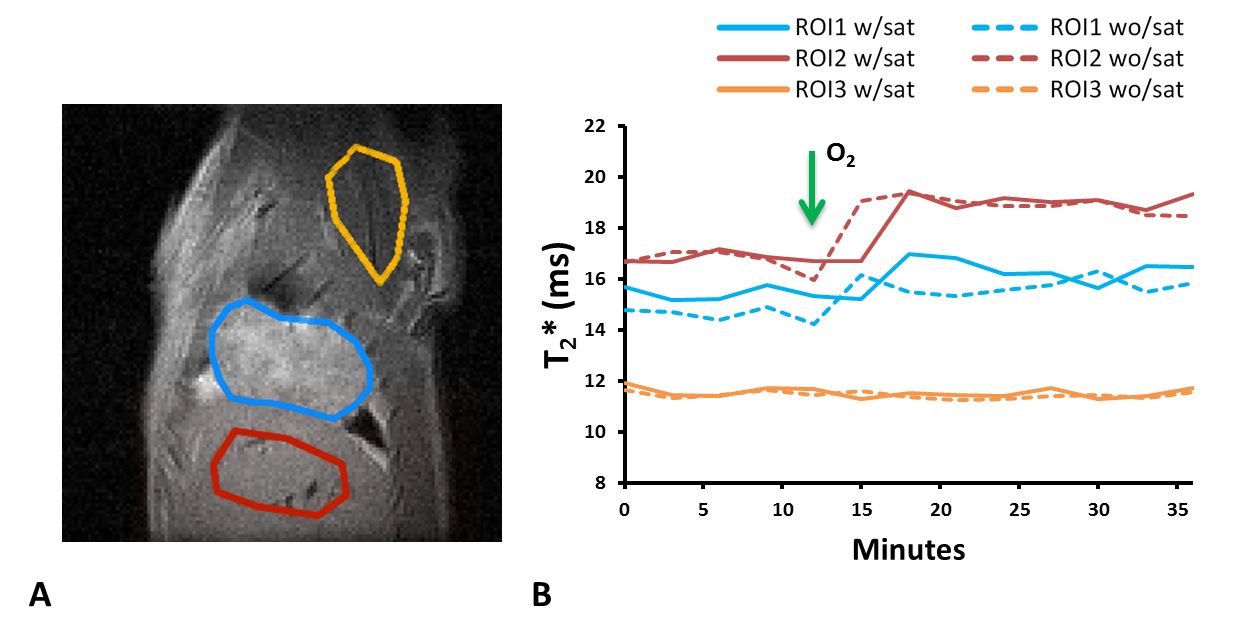
H460-luc human lung cancer cells were surgically implanted in the right lung of sixteen nude rats. MRI was performed at 4.7 T. Animal body temperature, respiration and heart rates were monitored with a small animal physiological monitoring system throughout the experiment. Respiration and ECG signals were used as external triggers [3]. BOLD (multi-echo gradient echo; TR = 150ms, ten echo time from 2 to 29 ms, flip angle = 20°) MRI was acquired with the intervention of an oxygen challenge (from air to 100% O2). Five sets of maps were acquired during air breathing and eight sets during oxygen breathing. Images were acquired in sagittal plane. BOLD was acquired with ECG triggering to reduce motion artifacts. Spatial saturation bands were placed on each side of the imaging plane for flow suppression. Tumor, liver and muscle regions were evaluated in each animal. Data were analyzed using home-written Matlab scripts.Results
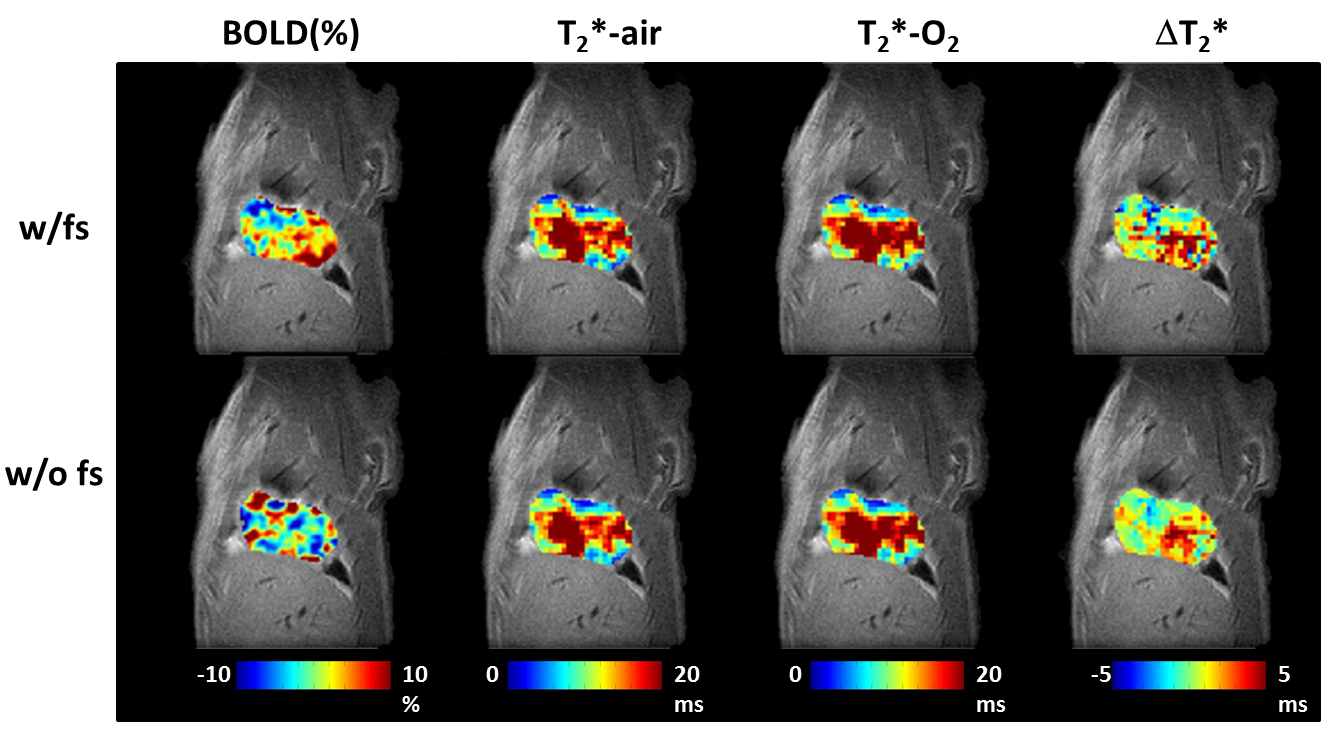
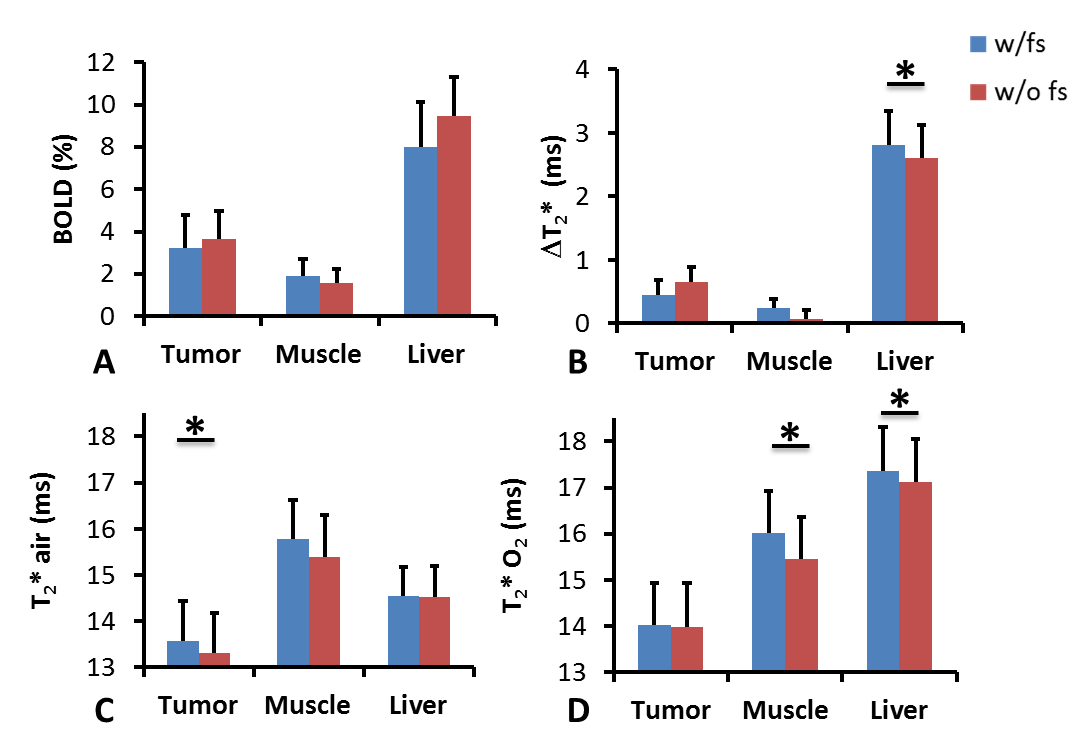
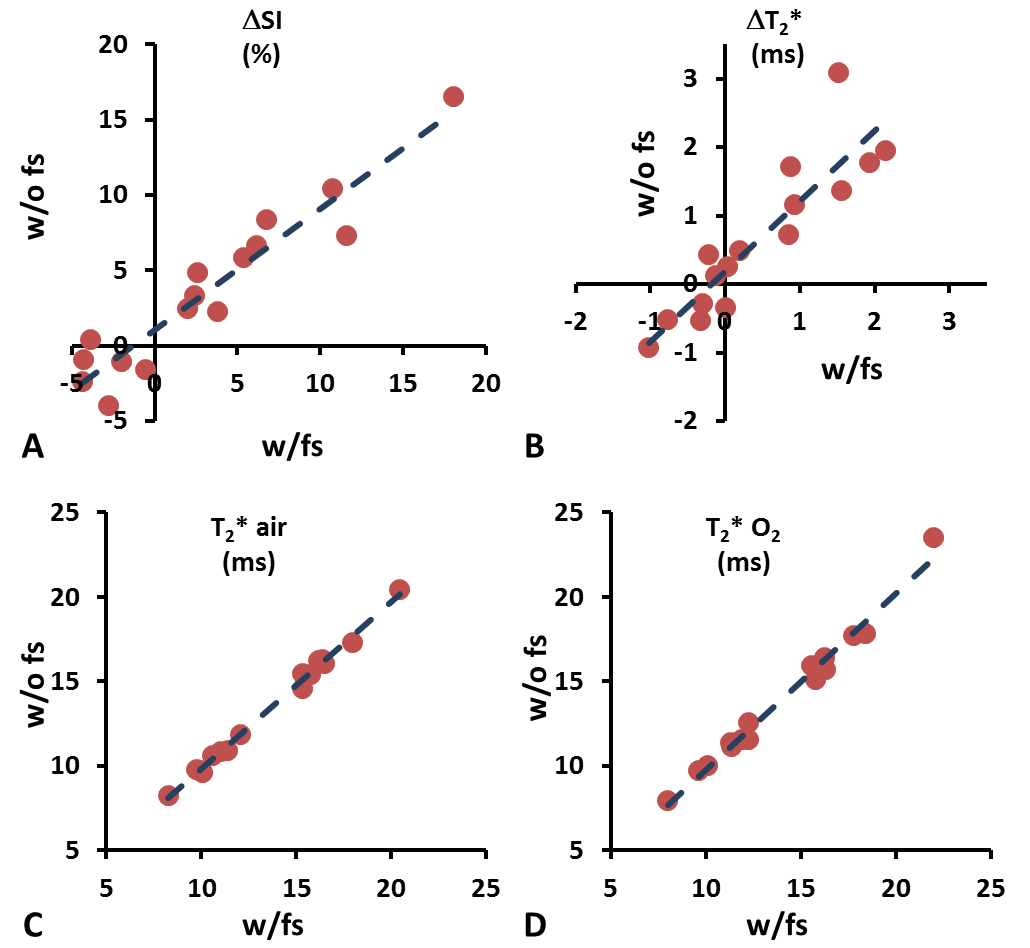
In most cases, T2* values increased in tumor and liver in response to oxygen breathing challenge (Figure 1). Distinct intra-tumoral heterogeneity was observed in all parametric maps (Figure 2). Quantitative T2* maps during air and oxygen breathing, as well as the ΔT2* (oxygen-air) showed negligible differences when comparing the paired scans with and without flow suppression for tumor regions. However, the semi-quantitative ΔSI(%) maps showed different enhancement patterns. The mean values of ΔSI(%), ΔT2*(ms), and T2* (air and oxygen) from ROIs of tumor, liver and muscle of 16 rats are summarized in Figure 3. Most of the values were not significantly different between the sequence with or without flow suppression. Greater differences were observed for the liver regions with two of the parameters (T2*air and ΔT2*) reaching statistical significance (paired Student’s t-test; p<0.05). Strong correlations between the measurements from sequences with and without flow suppression were found in all four parameters (Figure 4). Pearson correlation coefficients (R2) are 0.90, 0.81, 0.99 and 0.98 for ΔSI(%), ΔT2*(ms) and T2* (air and oxygen) respectively.Discussion
Semi-quantitative measurements were strongly affected by changes in blood flow, particularly evident in the ΔSI maps, although the difference was insignificant when comparing the mean values among animals. The quantitative T2* measurements of tumor appeared to be insensitive to the flow suppression, showing similar intra-tumoral spatial patterns and mean values for each animal. Liver seemed to be more sensitive to the flow. The differential behavior between tumor and liver could be attributed to the extent and condition of blood vessels.Conclusion
Quantitative measurements of BOLD appeared to be insensitive to flow for the tumor regions as observed in this preliminary study, while semi-quantitative ΔSI was strongly affected by flow and is a potential caveat. For well vascularized normal tissue (such as liver), flow suppression will be necessary for accurate measurements.Acknowledgements
The study was supported by funds from the Cancer Prevention and Research Institute of Texas (CPRIT MIRA RP120670-P3).References
1. Hallac, R.R., et al., Magn. Reson. Med., 71, 1863-1873 (2014).
2. Howe, F.A., et al., Magn. Reson. Imaging, 17, 1307-1318 (1999).
3. Kubo, S., et al., Magn. Reson. Med., 56, 698-703 (2006).
Figures