4505
A novel DTI derived heterogeneity index discriminating liver metastasis from normal appearing liver tissue: a PET-MRI study1Radiology, Assuta Medical Center, Tel-Aviv, Israel, 2Anatomy & Anthropology, Tel-Aviv University
Synopsis
This study's purpose was to compare DTI heterogeneity index with F18 fluorodeoxyglucose (FDG) standardized uptake value (SUVpeak) in liver metastases and in normal appearing liver tissue. The newly defined diffusion coefficient index (DCV) showed a stronger correlation to SUVpeak (r=0.714, p<0.001) than any other MR metrics evaluated. A threshold of DCV >0.05 and SUVpeak>2.88, correctly classified 28/35 (80%) and 32/35 (91.43%) liver metastases with AUC of 0.939 and 0.989, respectively. DCV, may provide quantitative data of tissue heterogeneity associated with liver metastases. In addition, DCV introduces a potential biomarker index as a quantitative discriminator of liver metastases.
Introduction
MR imaging provides very good tissue contrast resolution and has shown to be superior to other imaging modalities in characterization of liver metastases (1-3). DWI and DTI have been shown to discriminate liver fibrosis and inflammation (4,5) and are increasingly used in oncologic imaging for the detection of liver metastases, hepatocellular carcinoma, and cholangiocarcinoma based on the assumption that tumors have increased cellularity compared with background liver parenchyma (2,6). Apparent diffusion coefficient (ADC) is related to the mobility of water molecules and reflects tissue properties such as the size of the extracellular space, viscosity and cellularity. An important aspect of tumor characterization is tissue heterogeneity. Regional variations in cell death, metabolic activity, proliferation and vascular structure, often lead to tumor inhomogeneity. Various methods have been used for measuring tissue heterogeneity; however these are often complex, requiring sophisticated software (7). Coefficient of variation (CV) is defined as the ratio between standard deviation (SD) to the mean and is generally used to measure the dispersion of the frequency distribution. In this study we have utilized fractional anisotropy (FA) and ADC coefficient of variance (FAcv and ADCcv) to define a new diffusion index of heterogeneity. PET imaging has been successfully established as a tool for tumor staging and for determining the response to therapy (8). Fluorine 18 fluorodeoxyglucose (18F-FDG) is a semi quantitative biomarker for glucose metabolism. Our hypothesis was that combined high heterogeneity of ADC and FA may provide indication to tissue abnormalities associated with liver metastases (LM). The purpose of the present study is to compare DTI heterogeneity index with FDG SUVpeak in LM and in normal appearing liver (NAL).Materials and Methods
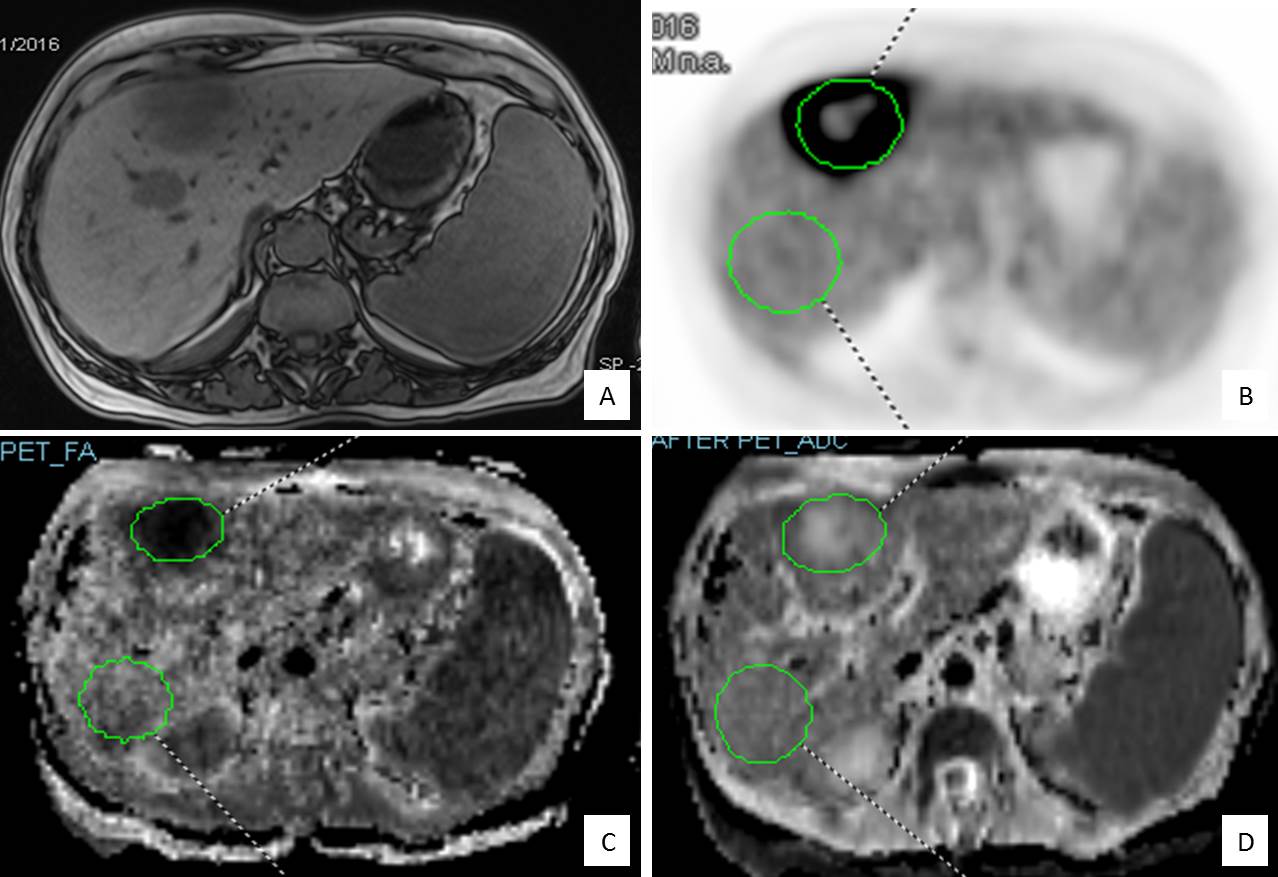
Data from 23 oncologic patients (13 women, 10 men, mean age 56±13), with a total of 35 LM was evaluated. All patients underwent hybrid PET/MR examination of the abdomen, including Dixon and DTI protocols with simultaneous PET acquisition. ADC and FA values as well as body weight SUVpeak in LM and in NAL were obtained for identical size volumes (Fig.1). MR tissue heterogeneity was calculated via the coefficient of variance (CV):
$$cv=\frac{std}{mean}$$.
A calculated diffusion CV index (DCV) was defined as:
$$DCV={ADCcv}\times{FAcv}$$
Statistical analysis included student's t-test, Pearson's correlation and ROC analysis.
Results
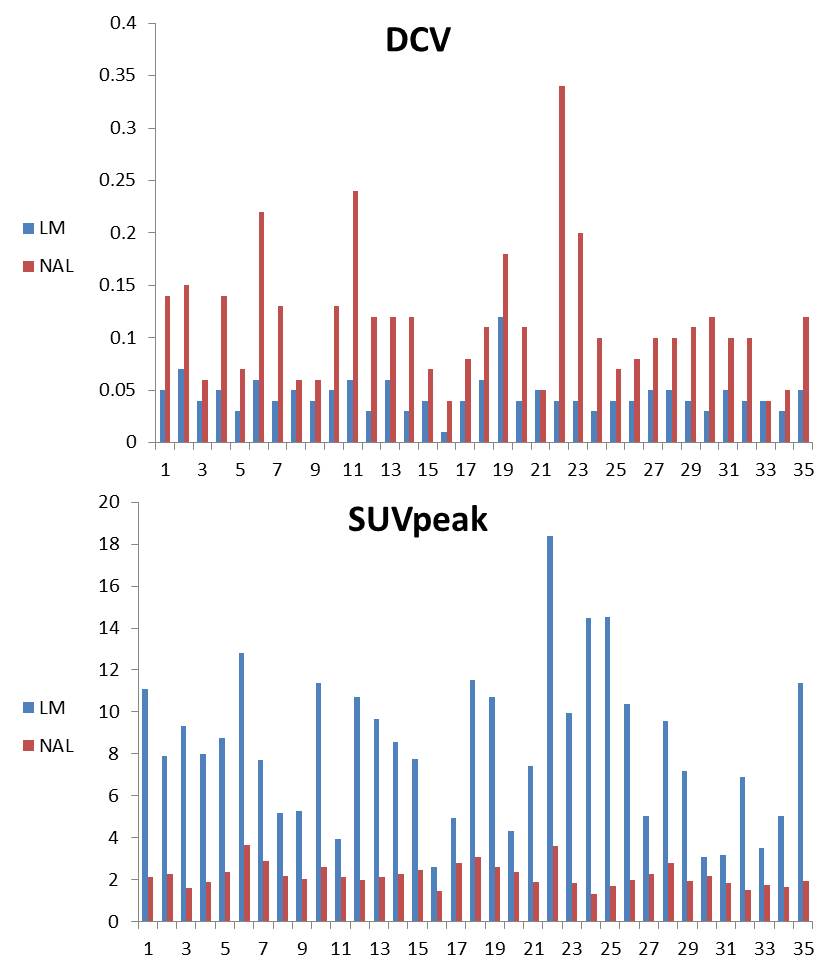
Good correlation was found between ADCcv and SUVpeak (r=0.641, p<0.0001), between FAcv and SUVpeak (r=0.604, p<0.0001) and DCV to SUVpeak (r=0.714, p<0.0001). Moderate inverse correlation, was found between ADCmin and SUVpeak (r=-0.438, p<0.0001) and a weak inverse correlation was found between mean ADC and SUVpeak (r=-0.269, p=0.024). FA mean to SUVpeak did not show any correlation. A lesion threshold of DCV >0.05 and SUVpeak>2.88, correctly classified 32/35 and 34/35 lesions (Fig. 2) with AUC of 0.939 and 0.989; respectively. Good agreement was found between DCV and SUVpeak (k=0.74).Discussion
The results from our study demonstrate that MR DCV index can quantitatively discriminate LM from NAL with a mean AUC greater than 0.939. DCV showed improved correlation with SUV in comparison with conventional metrics such as ADC and FA as well as with ADCcv and FAcv.
Our measurements of ADC have been comparable to previous reports of both normal liver parenchyma (9,10) and focal liver lesions (6, 9, 11). Our results do not show a statistically significant difference between the NAL and LM for mean ADC, nevertheless, a significant difference did appear for ADCcv. Our study found that ADCcv showed higher correlations to SUVpeak than any other parameter tested. The straight forward CV measure for each of the DTI indices introduces the tissue's heterogeneity in regard to the cellular diffusion properties. Thus, in reference to the relative homogeneous liver parenchyma, the ADCcv and FAcv in lesions, both show significant differences. Our results show these differences are significantly correlated to the increased uptake of FDG, which is an accepted biomarker for tumor metabolic activity (12). Furthermore, our study found that DCV, the multiple of both indices, is more strongly correlated to FDG SUVpeak than any other measurement tested and produces a good agreement between the two different modality indices. DCV suggests that the joint contribution from DTI derived indices is higher than each of them on its own. The ROC curve analysis shows a small difference in AUC between SUVpeak and DCV, further demonstrates the ability of DCV to efficiently discriminate hepatic lesions from NAL. DCV correctly identified a total of 85.71% (32 out of 35) LM.
Conclusion
MR diffusion index may serve as a quantitative discriminator of liver metastases with improved correlation with 18F-FDG PET SUVpeak.Acknowledgements
No acknowledgement found.References
1. Feuerlein S, Pauls S, Juchems MS, Stuber T, Hoffmann MH, Brambs H, Ernst AS. Pitfalls in abdominal diffusion-weighted imaging: How predictive is restricted water diffusion for malignancy. Am J Roentgenol. 2009;193(4):1070-6.
2. Sandrasegaran K, Akisik FM, Lin C, Tahir B, Rajan J, Aisen AM. The value of diffusion-weighted imaging in characterizing focal liver masses. Acad Radiol. 2009;16(10):1208-14.
3. Lichy MP, Aschoff P, Plathow C, Stemmer A, Horger W, Mueller-Horvat C, Steidle G, Horger M, Schafer J, Eschmann SM, Kiefer B, Claussen CD, Pfannenberg C, Schlemmer HP. Tumor detection by diffusion-weighted MRI and ADC-mapping--initial clinical experiences in comparison to PET-CT. Invest Radiol. 2007 Sep;42(9):605-13.
4. Charles-Edwards EM, deSouza NM. Diffusion-weighted magnetic resonance imaging and its application to cancer. Cancer Imaging. 2006 Sep 13;6:135-43.
5. Taouli B, Chouli M, Martin AJ, Qayyum A, Coakley FV, Vilgrain V. Chronic hepatitis: Role of diffusion-weighted imaging and diffusion tensor imaging for the diagnosis of liver fibrosis and inflammation. Journal of Magnetic Resonance Imaging. 2008;28(1):89-95.
6. Bruegel M, Holzapfel K, Gaa J, Woertler K, Waldt S, Kiefer B, Stemmer A, Ganter C, Rummeny EJ. Characterization of focal liver lesions by ADC measurements using a respiratory triggered diffusion-weighted single-shot echo-planar MR imaging technique. Eur Radiol. 2008;18(3):477-85.
7. Alic L, Niessen WJ, Veenland JF. Quantification of heterogeneity as a biomarker in tumor imaging: A systematic review. PloS one. 2014;9(10):e110300.
8. Collins CD. PET/CT in oncology: For which tumours is it the reference standard. Cancer Imaging. 2007;7(Spec No A):S77-87.
9. Li X, Liang Q, Zhuang L, Zhang X, Chen T, Li L, Liu J, Calimente H, Wei Y, Hu J. Preliminary study of MR diffusion tensor imaging of the liver for the diagnosis of hepatocellular carcinoma. PloS one. 2015;10(8):e0135568.
10. Girometti R, Maieron M, Lissandrello G, Bazzocchi M, Zuiani C. Test–retest reliability of diffusion tensor imaging of the liver at 3.0 T. Radiol Med. 2015;120(6):489-97.
11. Erturk SM, Ichikawa T, Kaya E, Yapici O, Ozel A, Mahmutoglu AS, Basak M. Diffusion tensor imaging of cysts, hemangiomas, and metastases of the liver. Acta Radiol. 2014 Jul;55(6):654-60.
12. Weber WA. Positron emission tomography as an imaging biomarker. J Clin Oncol. 2006 Jul 10;24(20):3282-92.
Figures