4503
Characterization of lymph nodes in colorectal cancer using non-exponential modeling of T2* decay1Champalimaud Research, Champalimaud Centre for the Unknown, Lisbon, Portugal, 2Centre for Medical Image Computing, Dept. Computer Science, University College London, London, United Kingdom
Synopsis
Lymph node staging is determinant in the management of cancer patients. Noninvasive imaging modalities have limited accuracy to distinguish malignant form benign lymph nodes. For that purpose, we investigated putative nonexponential (multicompartmental) and potentially non-monotonic decay in simple multi-gradient-echo(MGE) MRI in colorectal cancer. We find that frequency offsets arising from multicompartment models distinguish malignancy from normal tissues (as identified from histopathology), while relaxation rates or fractions do not. Such experiments are potentially suggestive of a simple yet useful tool for nodal staging.
SYNOPSIS
Lymph node staging is determinant in the management of cancer patients. Noninvasive imaging modalities have limited accuracy to distinguish malignant form benign lymph nodes. For that purpose, we investigated putative nonexponential (multicompartmental) and potentially non-monotonic decay in simple multi-gradient-echo(MGE) MRI in colorectal cancer. We found that frequency offsets arising from multicompartment models distinguish malignancy from normal tissues (as identified from histopathology), while relaxation rates or fractions do not. Such experiments are potentially suggestive of a simple yet useful tool for nodal staging.PURPOSE
Nodal staging is a major determinant of colorectal cancer patient´s management for which current imaging methods exhibit limited accuracy1. The potential of MGE MRI signals to differentiate between benign/malignant axillary lymph nodes was shown in breast cancer, ex-vivo and in-vivo2,3. While these studies quantified a single T2*, others have shown complex, nonexponential decays in brain4, cartilage5 and other anatomical areas. We posit that, since these signals may reflect distinct relaxation characteristics of different tissue components4, they may as such carry signatures for malignancy. This study thus aims to investigate if MGE-derived compartment-specific information may distinguish benign/malignant lymph nodes in colorectal cancer patients.METHODS
All experiments were approved by local ethics committee. Nine malignant and 9 benign nodes from 6 patients histopathologically staged as node positive after local resection, without neoadjuvant therapy, were included. Nodes were preserved in 4% formaldehyde and moved to 1% PBS solution 24h before scanning.
Image acquisition
Nodes were immersed in Flourinert® and acquired at 37ºC in a 16.4T Bruker Ascend Aeon scanner using a Micro5 NMR probe capable of producing up to 3000 mT/m in all directions. A fat-suppressed MGE sequence was applied using 50 TEs starting at 1.6 ms with 1.4 ms interval, TR=1500 ms, FA=50º; slice thickness:0.3mm; in-plane resolution=(0.1mm)2, Bandwidth:125kHz, 25 averages.
T2* signal decay model
Magnitude data were fitted using 1-, 2- and 3-compartment models described below:
$$$ S1C(TE) = S0 exp(-TE/T2*) $$$
$$$ S2C(TE) = S0|f1exp(-TE/T2*1) + (1-f1)exp(-TE(1/T2*2 + iΔΩ))| $$$
$$$S3C(TE) = S0|f1exp(-TE/T2*1) + f2exp(-TE(1/T2*2 + iΔΩ1)) + (1-f1-f2)exp(-TE(1/T2*3 + iΔΩ2))| $$$
where TE is the echo time, S0 is the signal at TE=0, and T2*i represents the relaxation time of compartment i with a volume fraction fi and frequency shift ΔΩ.
Image analysis
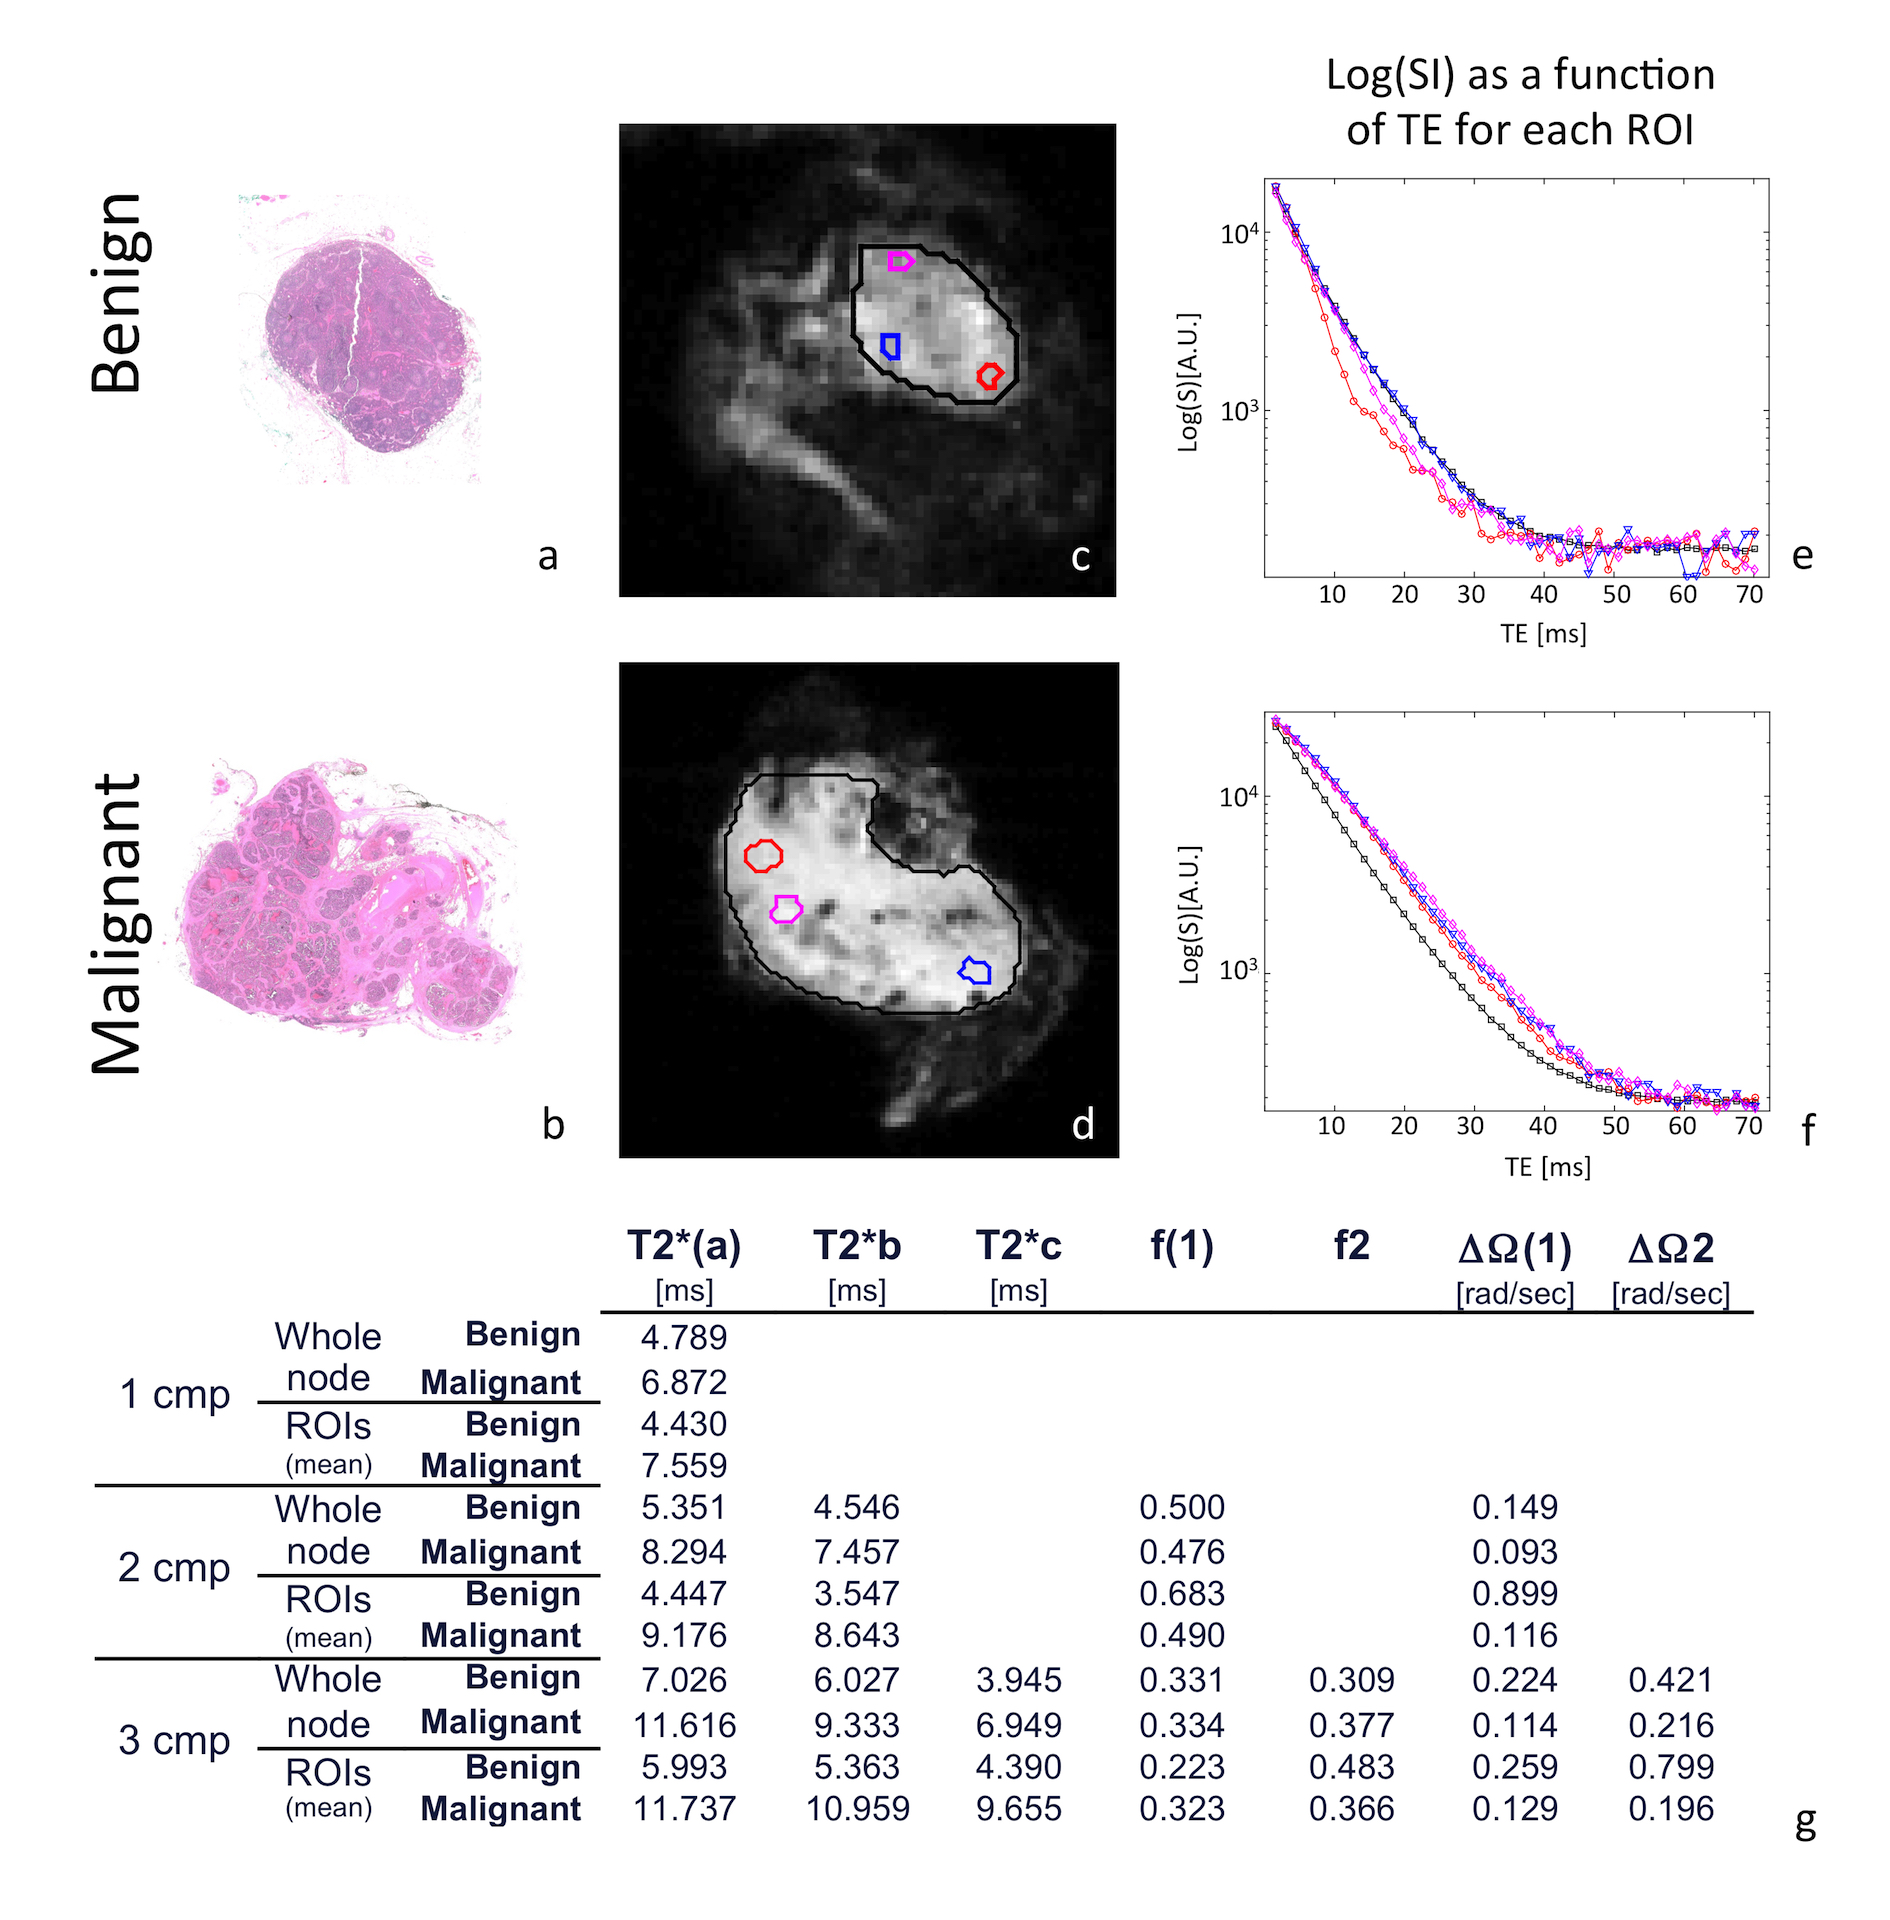
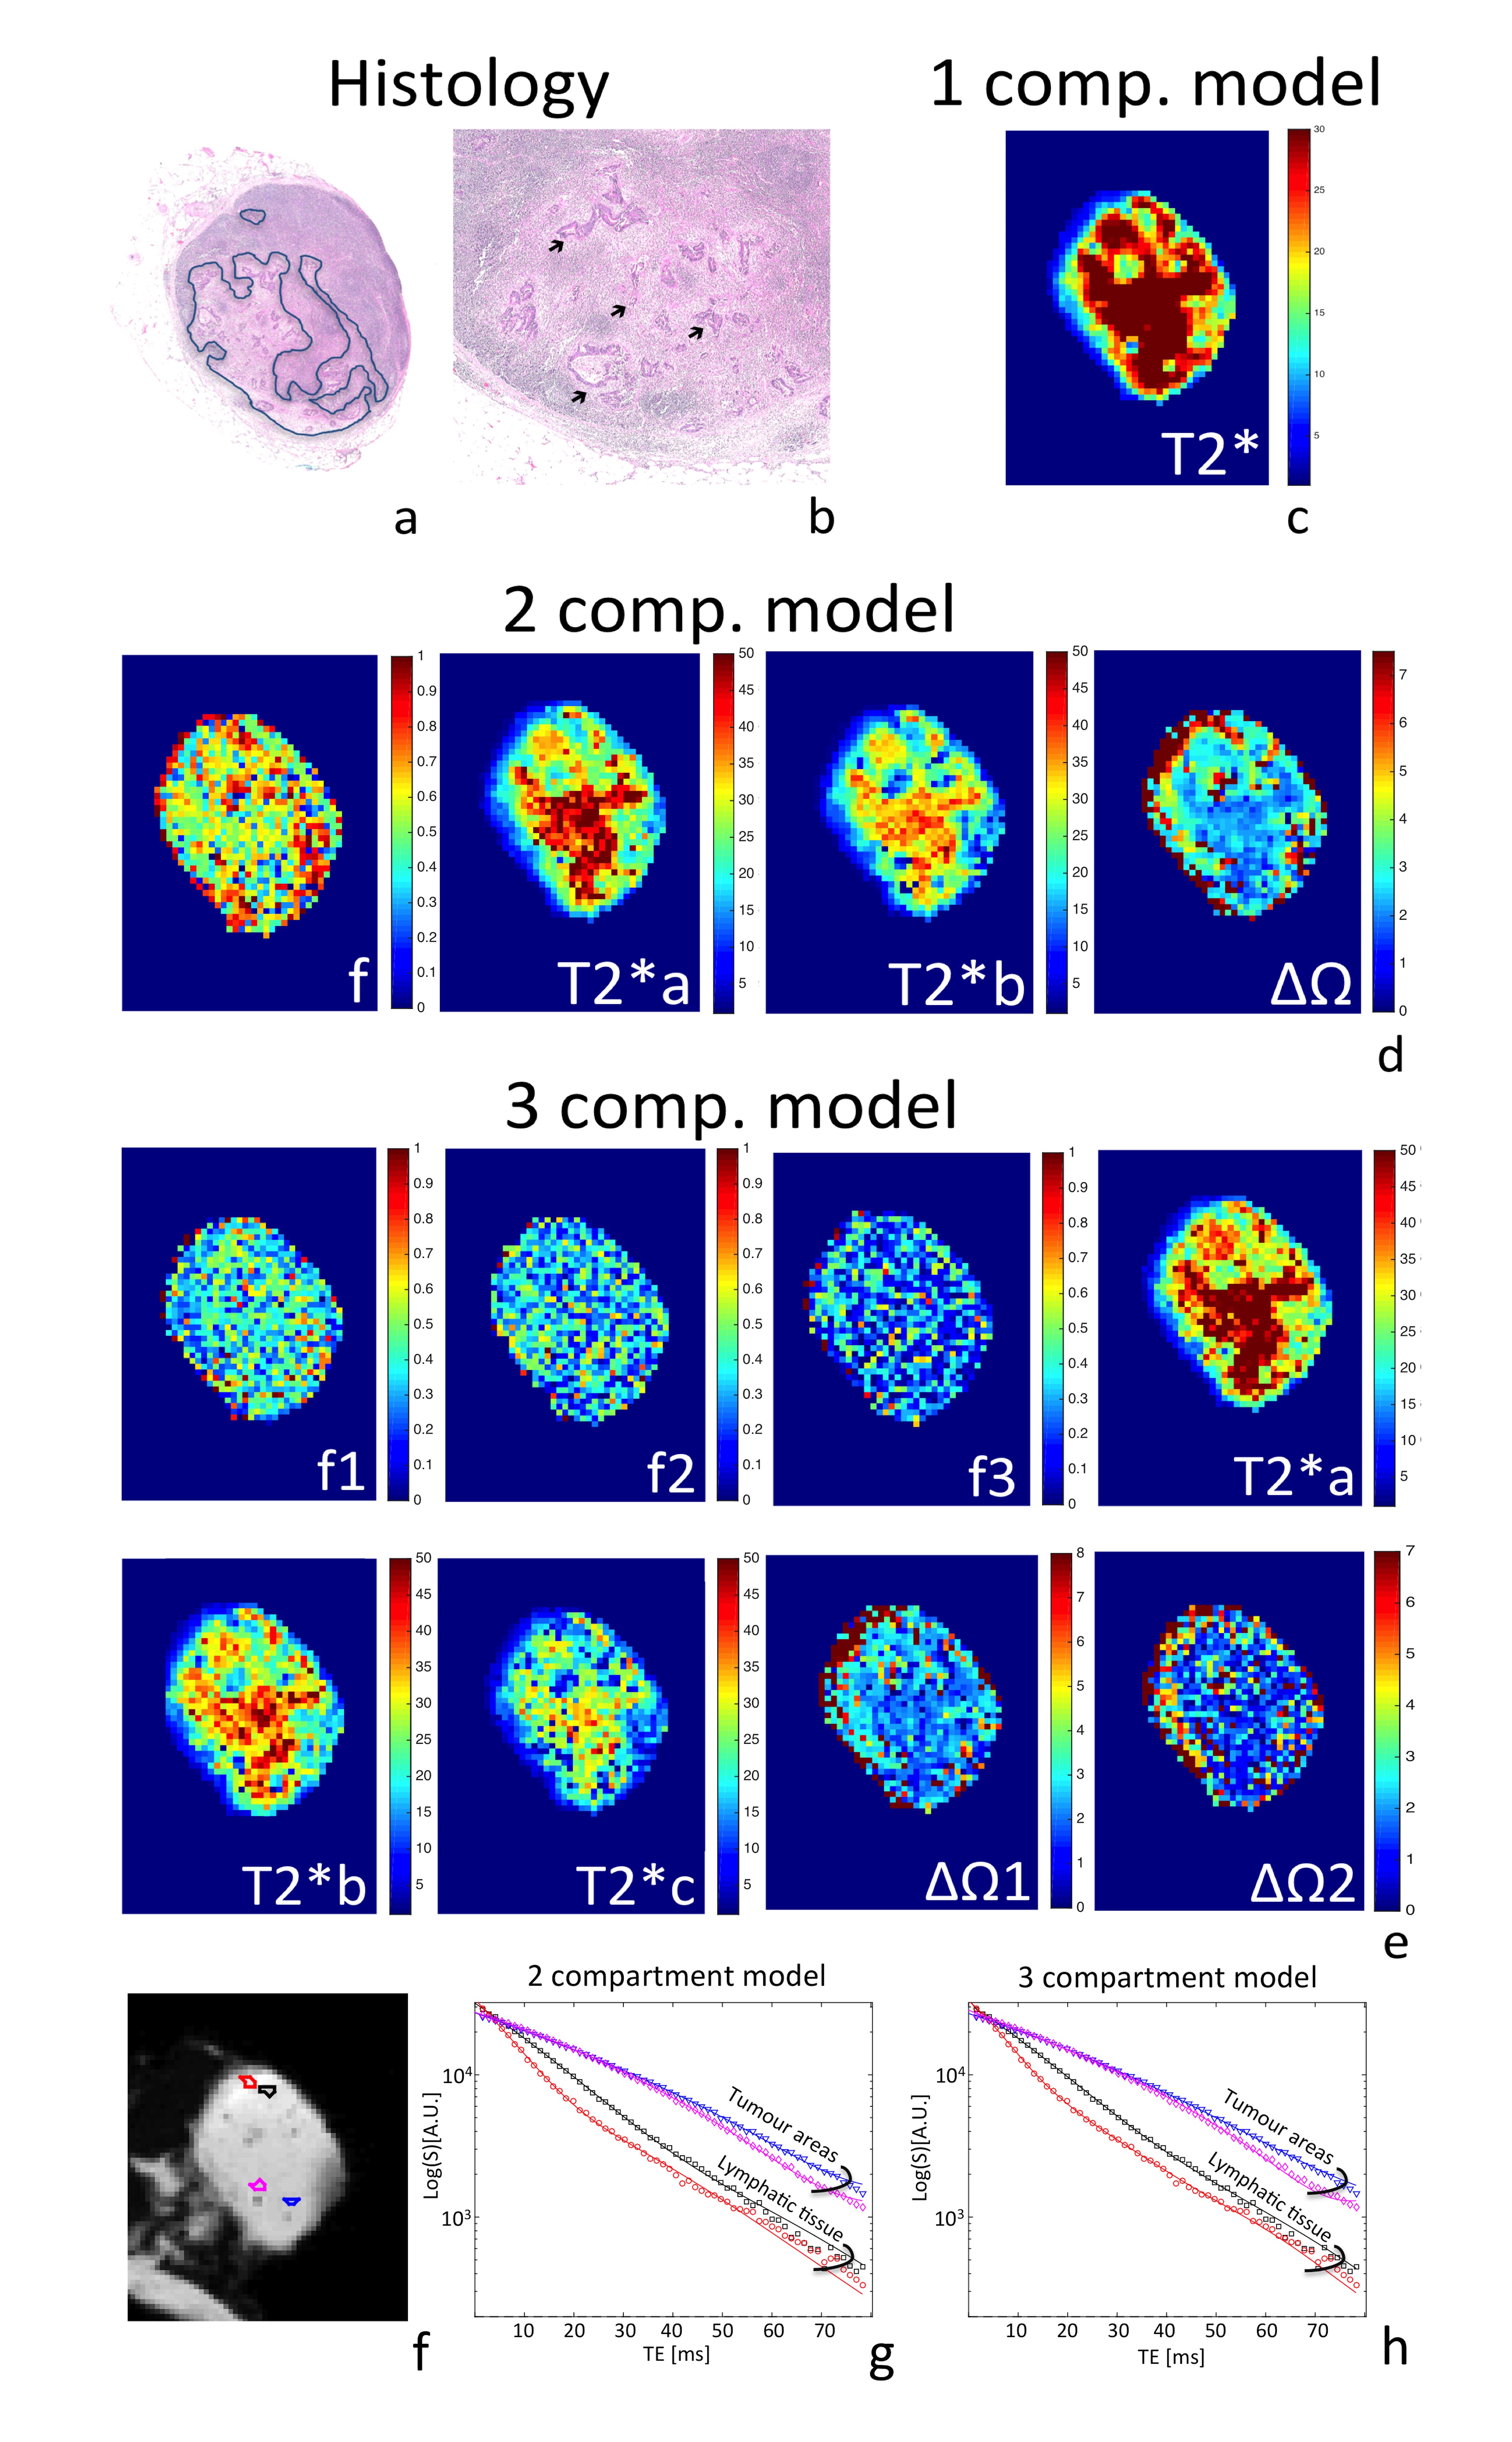
MRI datasets were smoothed in k-space (Gaussian filter with standard deviation of 5000) and analyzed in Matlab®. Models were fitted voxel-wise using a constrained non-linear optimization procedure accounting for Rician noise. Whole-node ROIs and 3 individual ROIs were defined, the latter placed in the cortex of benign nodes and in tumour-infiltrated areas, guided by histology (Figure 1). Paramateric maps were obtained from fits to each model (Figure 2).
Statistics
A non-parametric test was applied given data was not normally distributed.
RESULTS
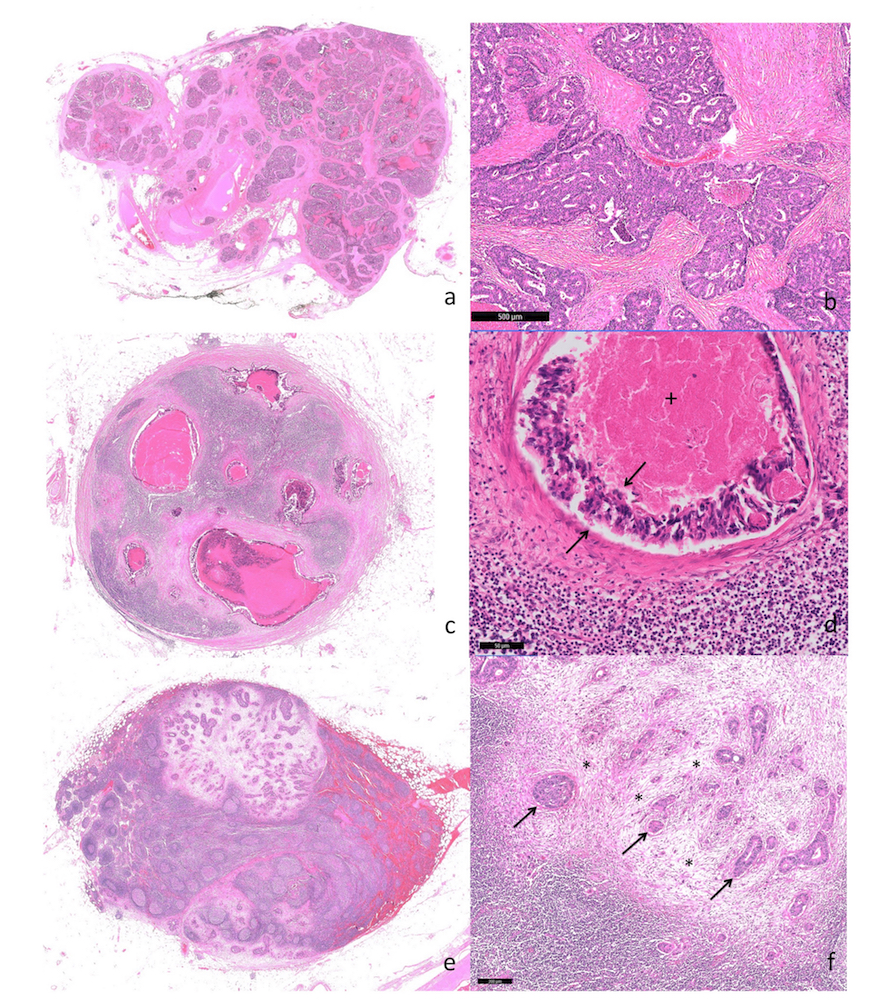
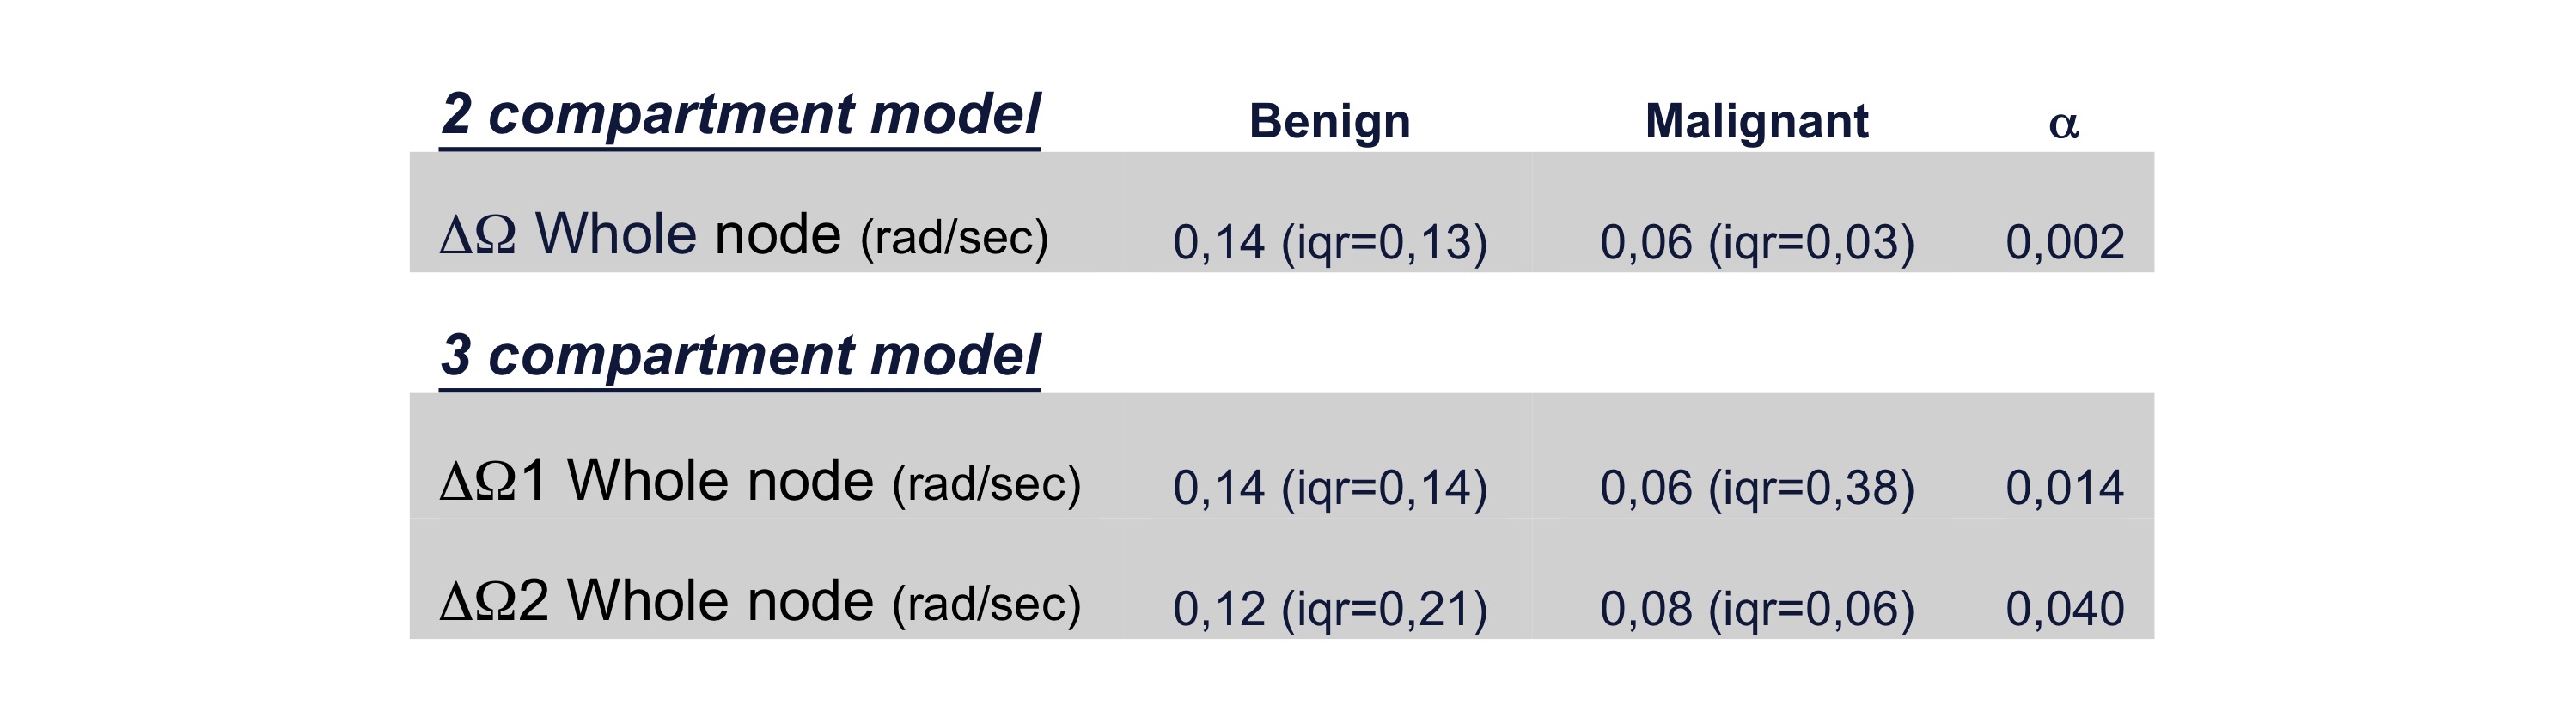
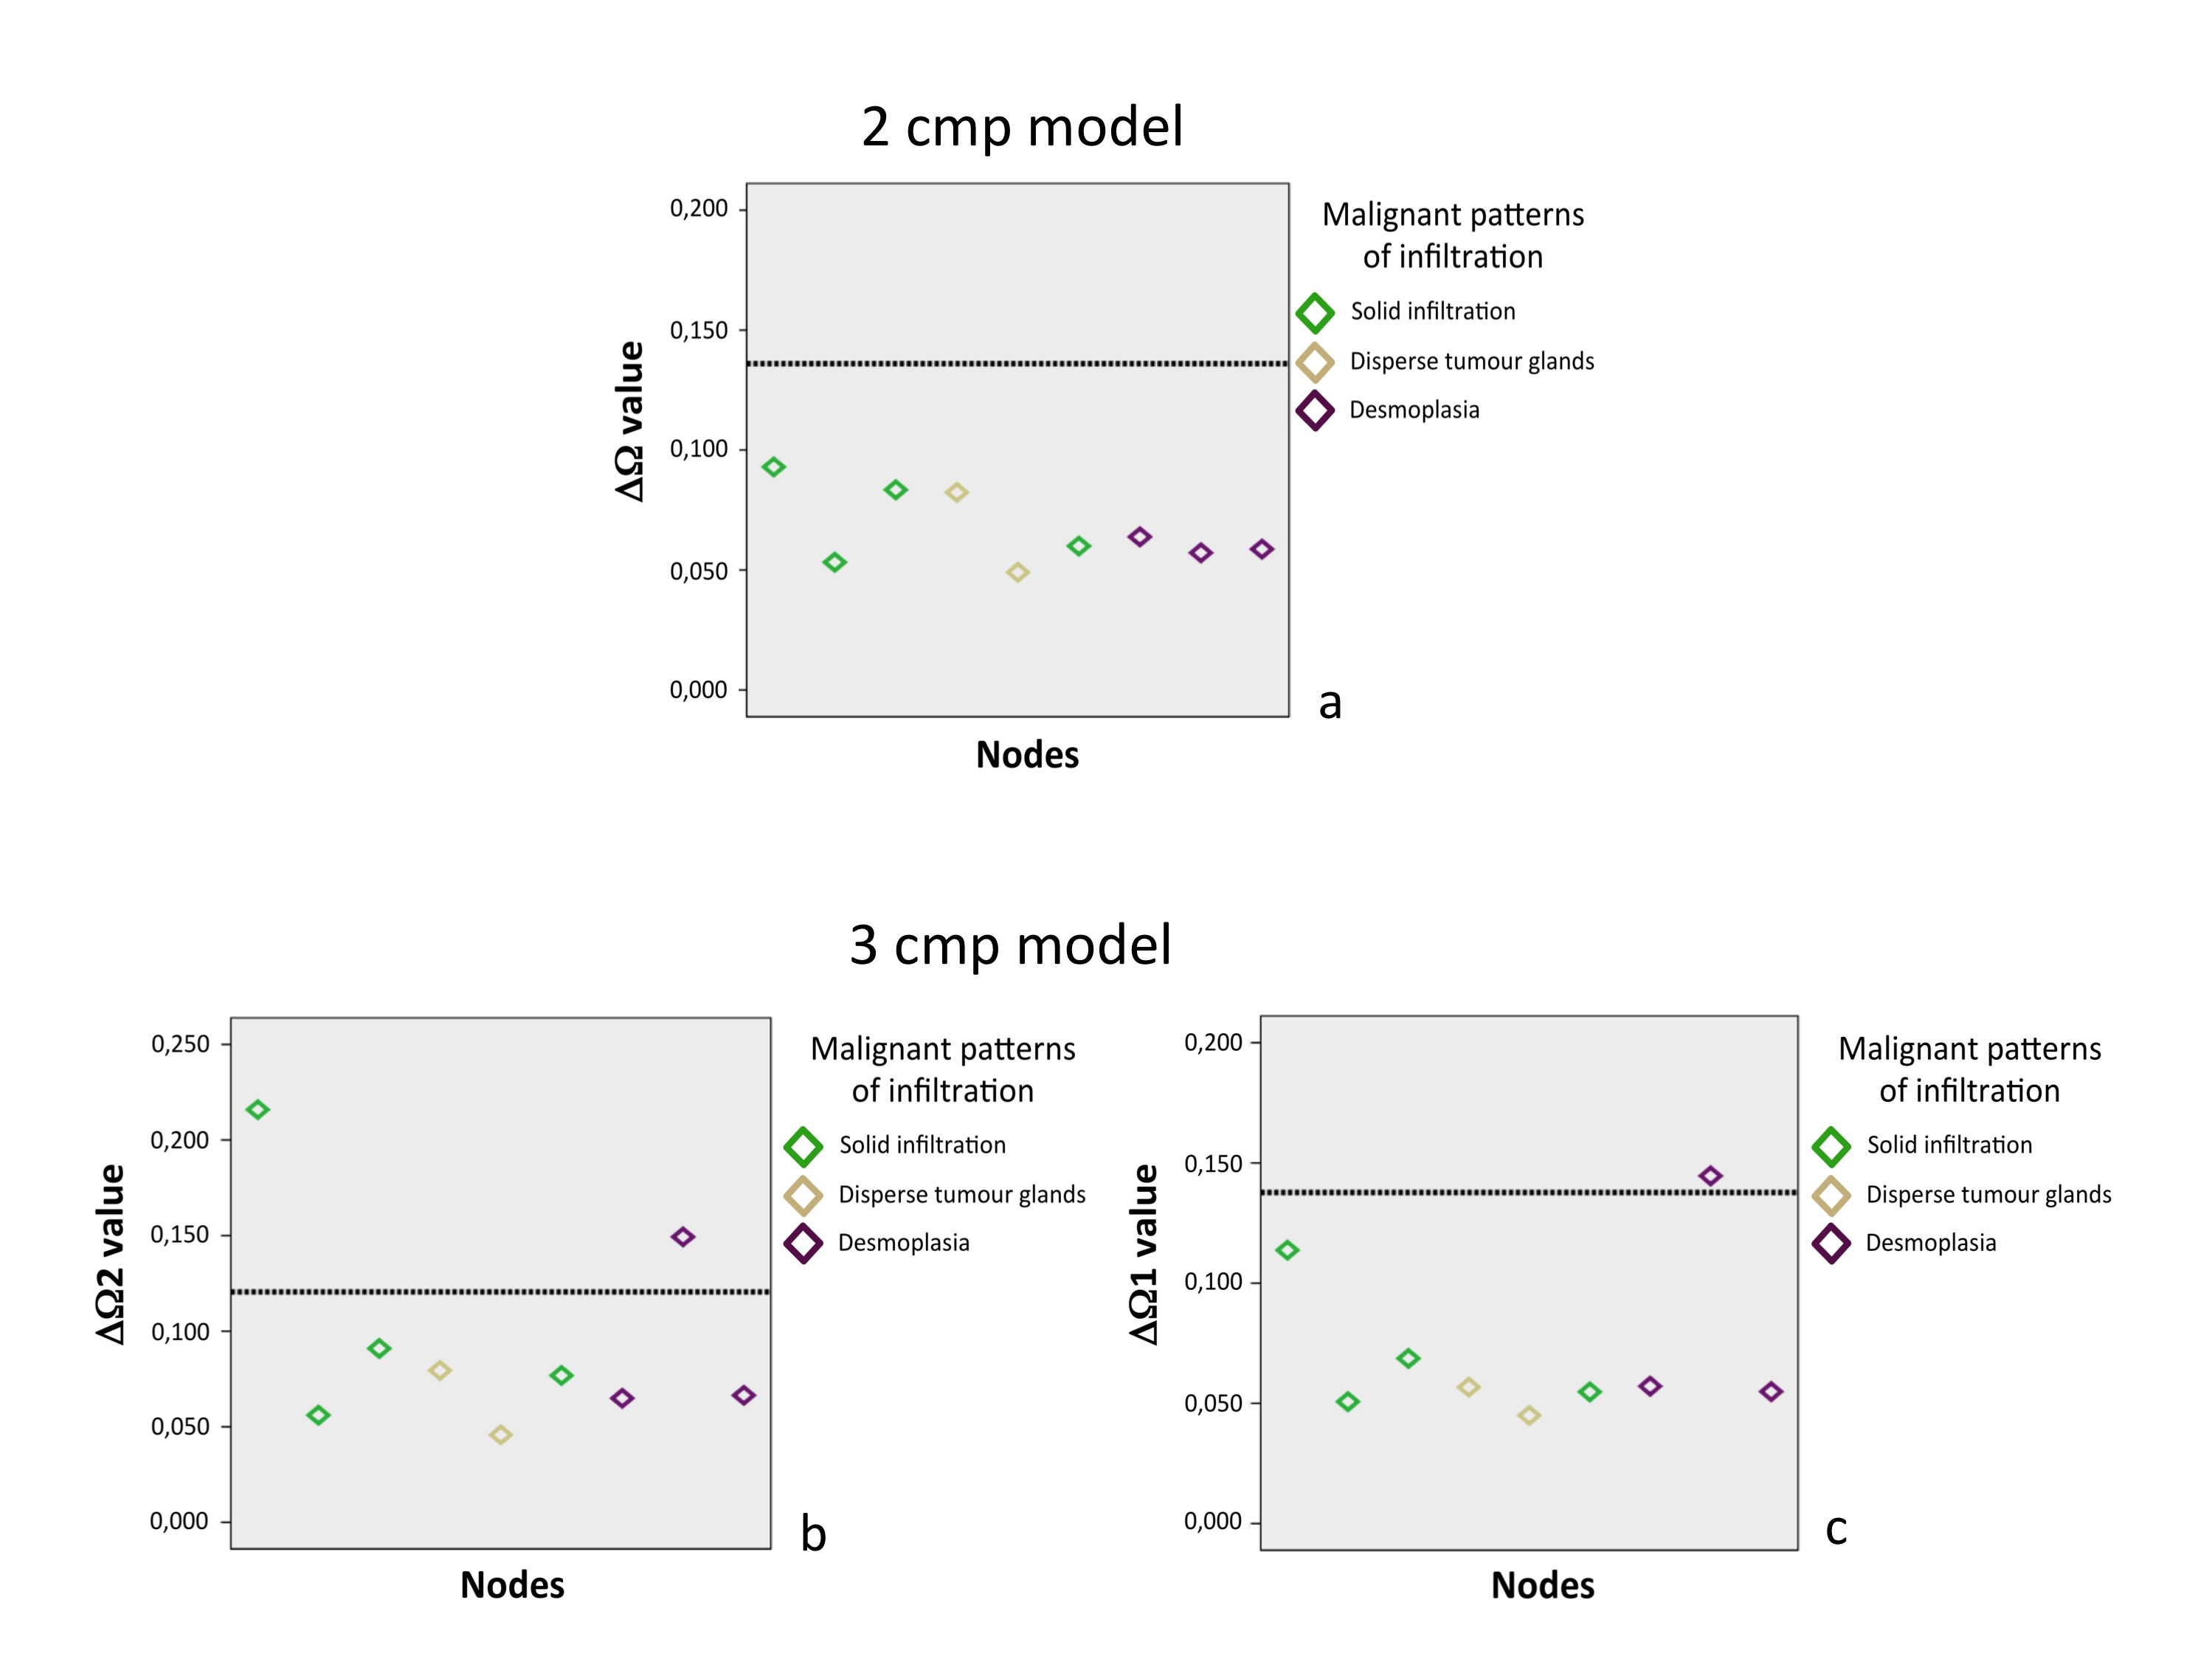
In malignant nodes, 3 different patterns of tumor infiltration were found in histology (Figure 3). Comparison between benign/malignant lymph nodes revealed statistically significant differences in ΔΩ for both 2 and 3 compartment models, shown in Figures 4-5. Although divergent median values were encountered for other parameters, these did not reach statistical significance.
DISCUSSION
In search of compartment-specific discriminatory characteristics between benign/malignant lymph nodes from colorectal cancer patients, significant differences were found in ΔΩ values for both 2- and 3-component models, with lower values obtained for malignant nodes. Lymphatic and tumour tissue exhibit conspicuous differences in proportion of extracellular matrix, cell size and shape (adenocarcinoma cells being goblet-shaped and 3-5 times larger than round lymphatic cells), which may contribute to these differences via the size-dependent terms in susceptibility induced dephasing6. Another possibility would be diverging amounts of field-perturbing particles, namely blood-derived iron-containing products, engulfed by phagocytic cells present in normal lymph nodes. Single-exponential models of T2* decays were applied to distinguish benign/malignant axillary lymph nodes in breast cancer patients2,3. An ex-vivo MRI study at 7T examined morphologic features,T1,T2,T2* and ADC, finding only mean T2* was discriminatory2; an in-vivo study at 3T found more pronounced differences in T2* with very high discriminative power3. Here, T2* was not discriminatory, likely due to the high field(16.4T) which generates a rapid decay for all components. This study is limited by a small sample size per group; nevertheless, preliminary data presented is promising. Based on these results, we initiated a translational study involving immunohistochemistry-based quantitative validation and clinical implementation of MGE, which will be reported in due course.
CONCLUSION
The ex-vivo application of 2- and 3-compartment models of T2* decay to an MGE MRI acquisition resulted in ΔΩ values that were consistently lower in tumour-infiltrated than in benign lymph nodes from colorectal cancer patients.
Acknowledgements
Teresa Duarte, Champalimaud Research, Champalimaud Centre for the Unknown, Lisbon, Portugal
Rita Gil, Champalimaud Research, Champalimaud Centre for the Unknown, Lisbon, Portugal
Daniel Nunes, Champalimaud Research, Champalimaud Centre for the Unknown, Lisbon, Portugal
António Gomes, Hospital Fernando Fonseca EPE, Lisbon, Portugal
António Beltran, Champalimaud Centre for the Unknown, Lisbon, Portugal
Lara Castanheira, Champalimaud Centre for the Unknown, Lisbon, Portugal
Alexandra Martins, Champalimaud Centre for the Unknown, Lisbon, Portugal
References
(1) Bipat S, Afina GS, Slors FJM, Zwinderman AH, Bossuyt PMM, Stoker J. Rectal Cancer: Local Staging and Assessment of Lymph Node Involvement with Endoluminal US, CT, and MR Imaging—A Meta-Analysis. Radiology 2004; 232:773–783.
(2) Korteweg MA, Zwanenburge JJM, Hoogduin JM, van der Bosch AAJ, van Diest PJ, van Hillegersberg R, Eijkemans JC et al. Dissected sentinel lymph nodes of breast cancer patients: characterization with high-spatial-resolution 7-T MR imaging. Radiology. 2011. 261: 127-135.
(3) Li C, Meng S, Yang X, Wang J and Hu J. The value of T2* in differentiation metastatic from benign axillary lymph nodes in patients with breast cancer – a preliminary in vivo study. PloS One. 2014. 9(1):e84038.
(4) Sati P, van Gelderen P, Silva AC, Reich DS, Merkle H, Zwart JA and Duyn JH. Micro-compartment specific T2* relaxation in the brain. NeuroImage. 2013. 77:268-278. (5) Qian Y, Williams A A, Chu C R and Boada F E. Multicomponent T2* mapping of knee cartilage: technical feasibility ex vivo. Magn Reson Med. 2010. 64:1427-1432.
(5) Qian Y, Williams A A, Chu C R and Boada F E. Multicomponent T2* mapping of knee cartilage: technical feasibility ex vivo. Magn Reson Med. 2010. 64:1427-1432.
(6) Koch KM, Papademetris X, Rothman DL, de Graaf RA. Rapid calculations of susceptibility-induced magnetostatic field perturbations for in vivo magnetic resonance. Phys Med Biol. 2006. 21;51(24):6381-402.
Figures