4502
Extracellular-extravascular accumulation of non-caloric sweetener (sucralose) provides CEST contrast for cancer detection1Department of Rediology, University of Pennsylvania, Philadelphia, PA, United States, 2Research Branch, Sidra Medical and Research Center, Doha, Qatar
Synopsis
We show the utility of a non-nutritive sweetener, sucralose, as a contrast agent in cancer MRI studies by exploiting its chemical exchange saturation transfer (sucCEST) property. The extracellular-extravascular accumulation of sucralose in a glioma model provides localized, temporal changes in the CEST contrast, corroborating the gadolinium-enhanced MRI. These findings illustrate the potential of sucCEST for diagnosis and monitoring of the therapeutic response of cancers, including gliomas in preclinical studies.
Introduction
Magnetic resonance imaging (MRI) provides contrast between normal and tumorous tissues and helps with clinical decision-making. Various studies have shown the application of glucose and its analogs as chemical exchange saturation transfer (CEST) contrast agents to detect cancer1,2,3,4,5. In this study, we evaluated the potential of a popular sweetener, sucralose, as an MRI contrast agent to image cancer. We show that the hydroxyl protons on sucralose exchange with bulk water protons and exhibit CEST property (sucCEST). CEST properties of sucralose were evaluated in phosphate buffered saline solutions at 37°C. Further, sucCEST was evaluated in the rat brain glioma model and compared with the gadodiamide contrast enhanced image.Material and Methods
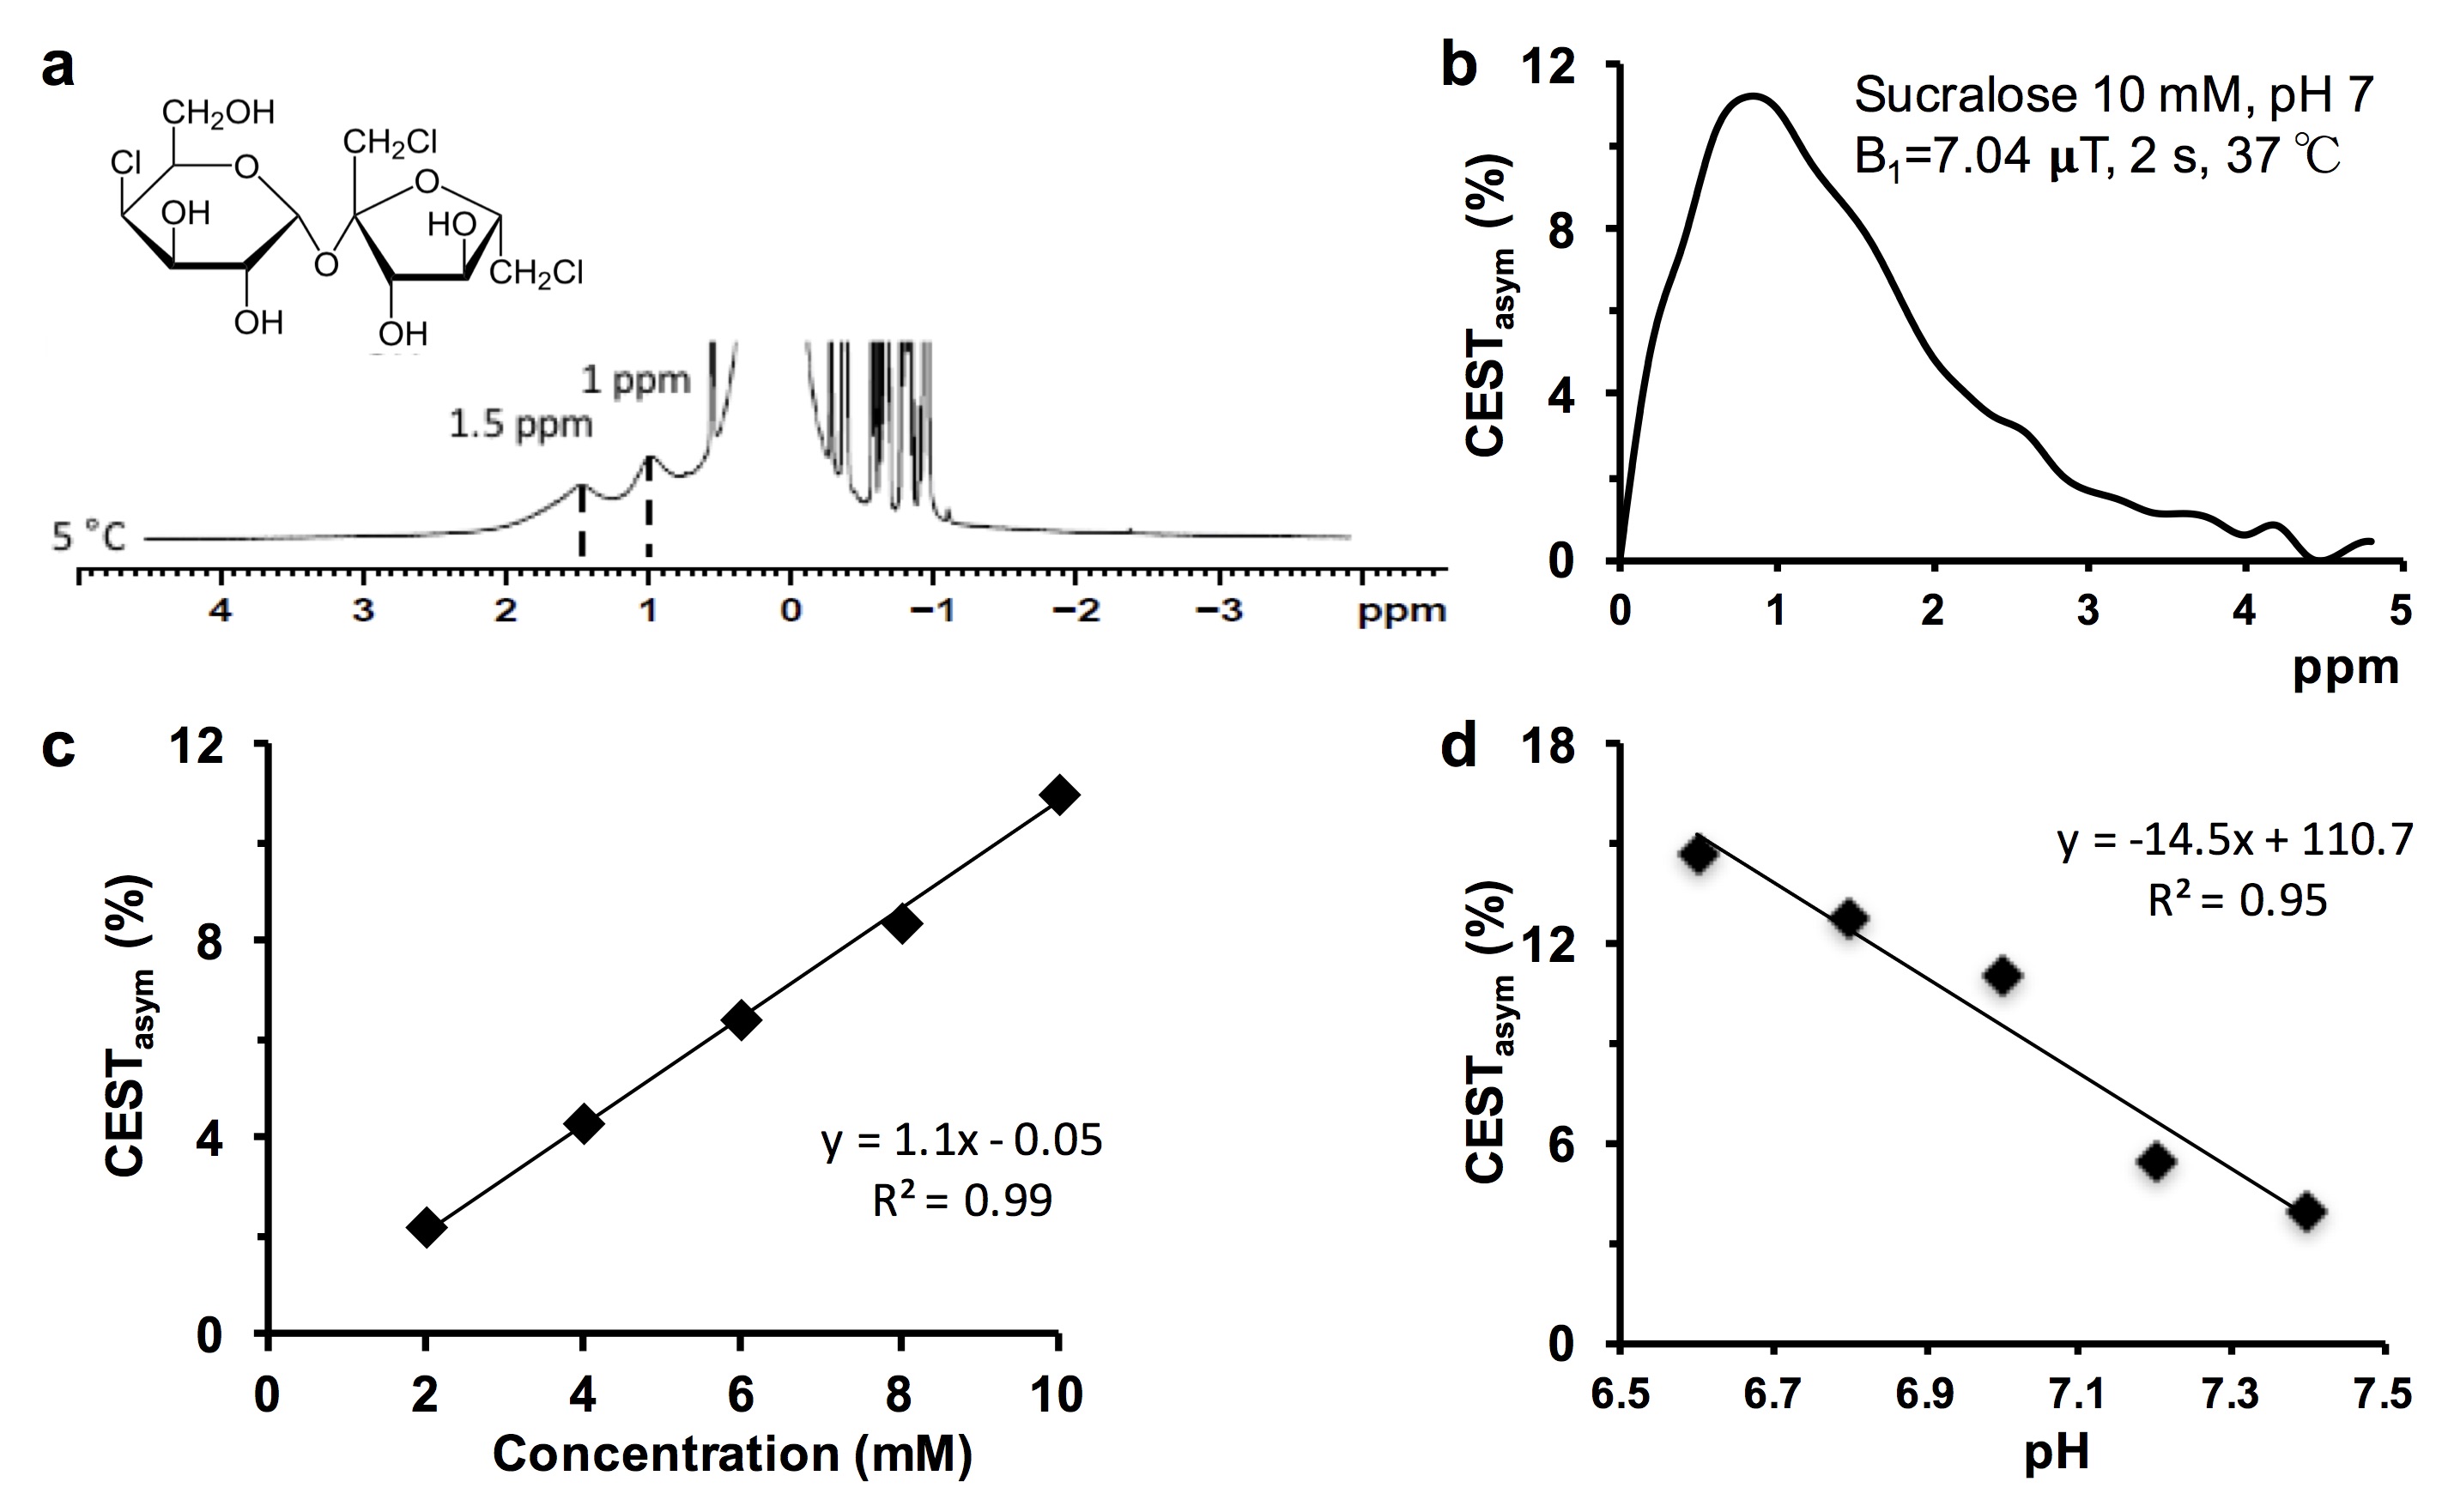
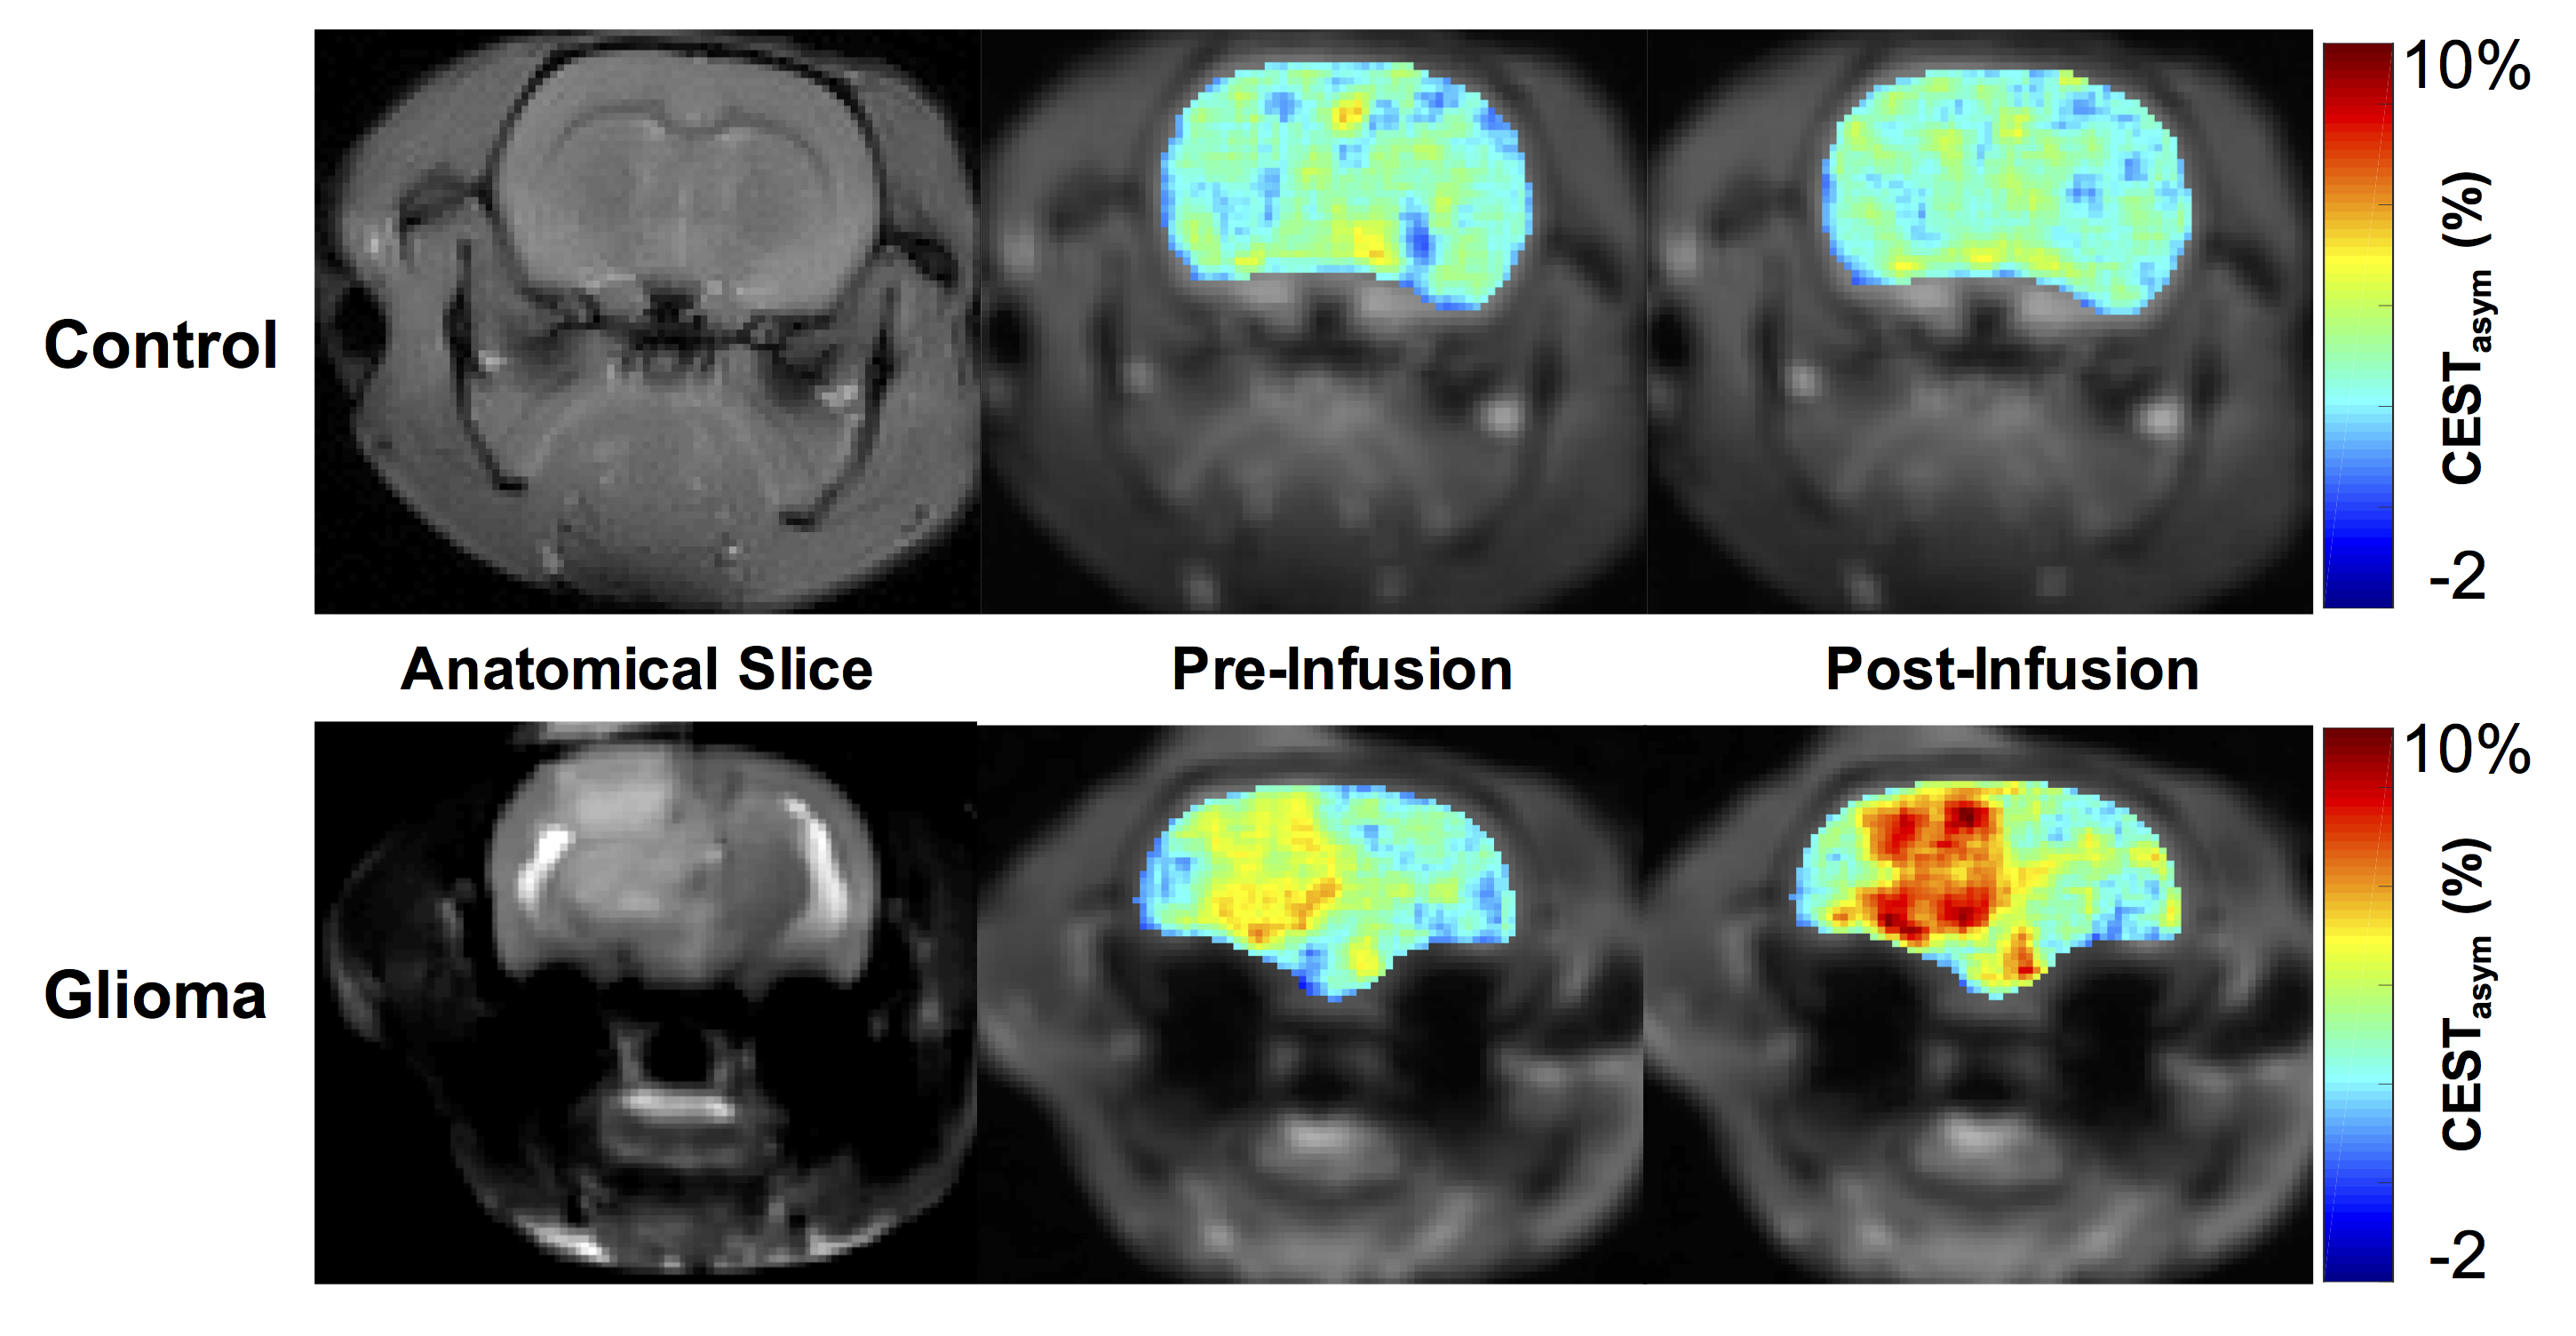
High resolution NMR spectroscopy of sucralose (Sigma-Aldrich, USA) solution (200 mM, pH 7) was performed on 400 MHz vertical bore scanner (Bruker, Germany) at 5 ºC with a single pulse-acquire spectroscopy with TR=4 s, number of averages=32. Solution phantoms with varying concentration and pH at 37 °C, were used to evaluate the CEST properties of sucralose at 9.4T (Agilent, USA). In vivo CEST MRI was performed at 9.4T MRI scanner on rats injected with 9L glioma cells intracranially 3 weeks prior to the experiment. Tumor-bearing mice were maintained under 1-1.5% isoflurane in O2, supplied at 1 L/min. During the course of the experiment, the body temperature was maintained at 37ºC. The CEST sequence parameters were: slice thickness=4 mm, GRE flip angle=5º, GRE readout TR=5.6 ms, TE=2.7 ms, FOV=30×30 mm2, matrix size=128×128, T1delay=8 s. CEST images from 0 to ±3.6 ppm were collected in step size of 0.2 ppm at 2.34 µT saturation pulse power (B1) and saturation duration 2 s. B0 correction was done by acquiring WASSR images at 0.23 μT from -1 to +1 ppm in steps of 0.1 ppm, using the same parameters as CEST. CEST maps were computed using the equation CESTasym (%) =100×[(S-ve – S+ve)/S0], where S-ve, S+ve, and S0 are the B0 corrected MR signals acquired while saturating at –1 ppm, +1 ppm, and 20 ppm from water resonance, respectively. The CEST contrast map was further corrected for any B1 inhomogeneity. Following the acquisition of the baseline CEST, sucralose (200 mM, 1 ml) was administered via tail vein at a constant rate using a syringe pump for 10 min. Immediately following the infusion of sucralose, the CEST acquisitions were performed for 90 minutes. For control studies, healthy rats were used and sucCEST maps were acquired pre- and post-infusion of sucralose.Results and Discussion
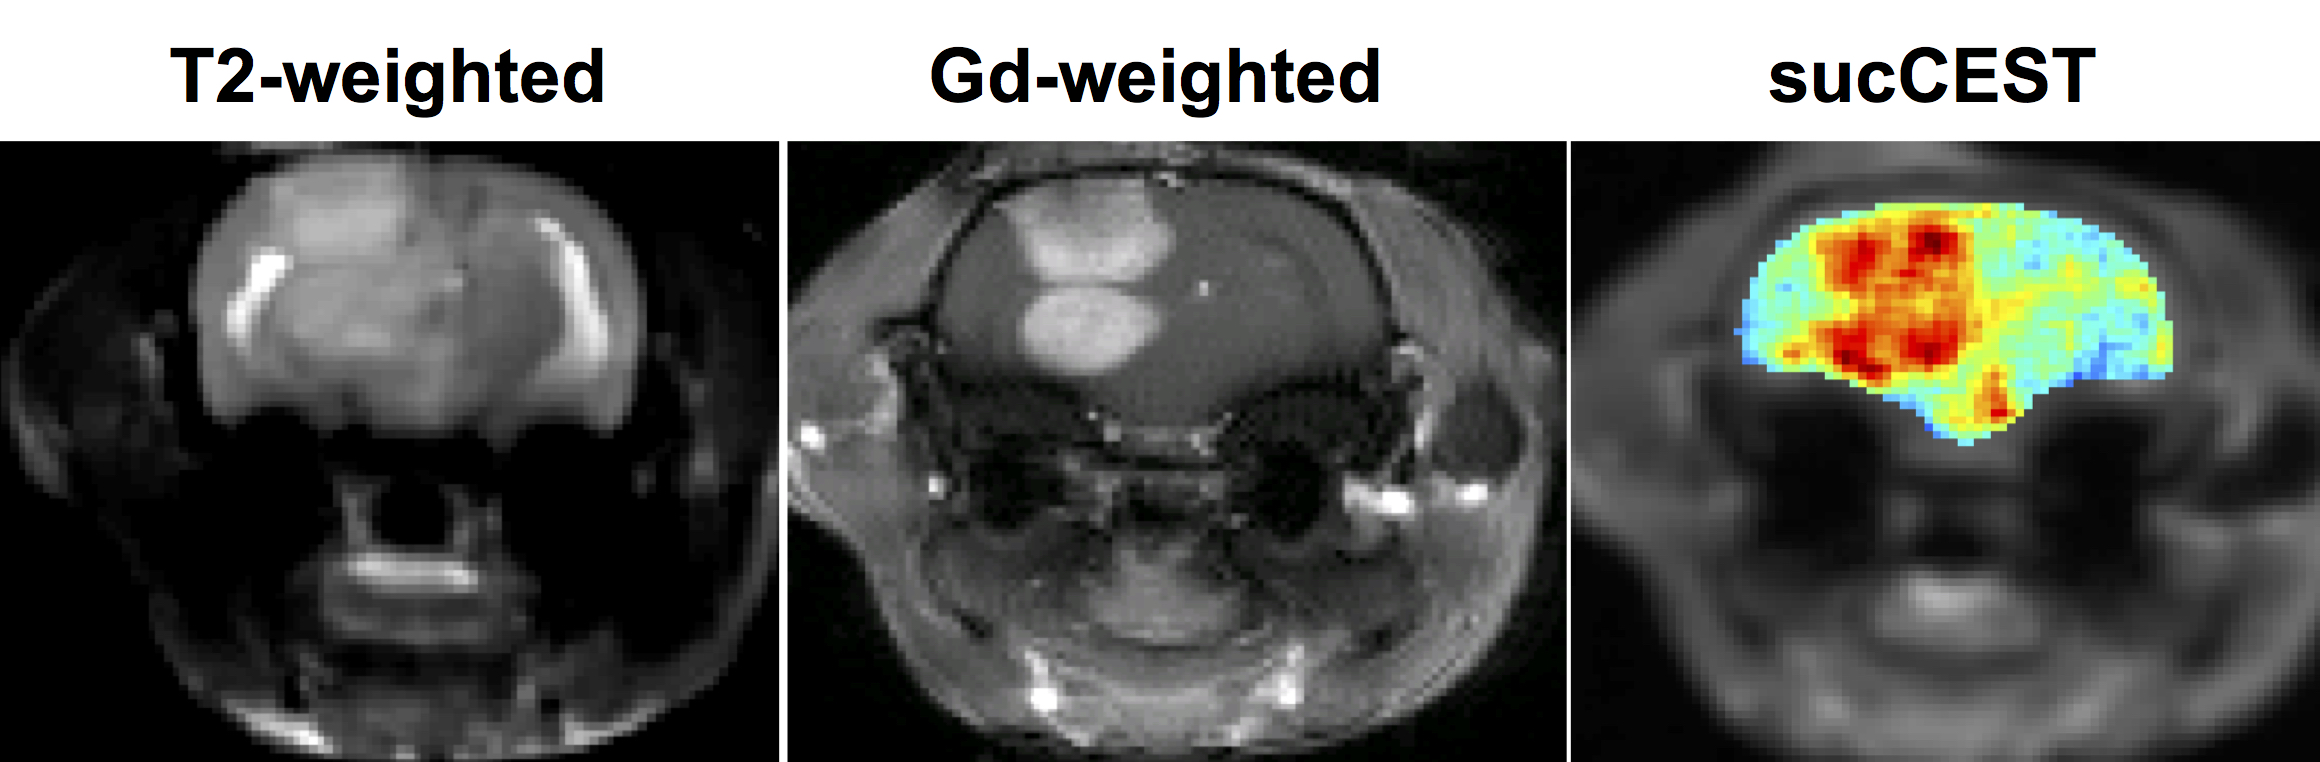
The high-resolution 1H NMR spectra of maltitol showed the clear resonance from hydroxyl groups at 1 and 1.5 ppm downfield of water at low temperature (Fig. 1a). The sucralose phantom studies show a broad CESTasym peaking at 1 ppm (Fig. 1b). The sucCEST was found to correlate positively with the concentration (Fig. 1c) and negatively with the pH (Fig. 1d). With the saturation pulse parameters used in the current study, ~3% CEST contrast was observed at 1 ppm in the healthy rat brain. This could be due to the endogenous hydroxyl (–OH) groups present predominantly on m-inositol6 and glucose1,2. The sucCEST contrast in the normal rat brain did not change following the administration of sucralose suggesting that intact blood-brain barrier (BBB) is impervious to sucralose (Fig 2, Upper panel). Increased sucCEST contrast was observed in the tumor region of the brain at ~30 min post infusion of sucralose in the rat glioma model (Fig. 2, Lower panel). In the normal-appearing brain region of these rats, sucCEST contrast did not change appreciably over the course of CEST acquisition, again indicating that sucralose did not get into the healthy regions of the brain. The sucCEST maps provide both visual and quantitative detection of tumor and comparable contrast to T2 weighted and Gd-enhanced images in the tumor region (Fig 3). Overall, this inexpensive, non-nutritive sweetener in conjunction with its CEST properties can be readily used for the examination of various tumors on ultra-high field MRI scanners. This preliminary study paves the way for the development of sucralose and other sucrose derivatives as MRI contrast agents for a variety of preclinical imaging applications as well as to monitor therapeutic response.Acknowledgements
This project was supported by the National Institute of Biomedical Imaging and Bioengineering of the National Institutes of Health through Grant Number P41-EB015893 and the National Institute of Neurological Disorders and Stroke through Award Number R01NS087516 and a grant from Sidra Medical and Research CenterReferences
1. Walker-Samuel S et al. Nature Med (2013) 19:1067-72; 2. Chan KW et al. Magn Res Med (2012) 68:1764-73; 3. Rivlin M et al. Magn Res Med (2014) 72:1375-80; 4. Xu X et al. Tomography (2015) 1:105-14; 5. Wang J et al. Sci Rep (2016) 6:30618; 6. Haris M et al. Neuroimage (2011) 54:2079-85
Figures