4501
Extracting oxygen-enhancing components from OE-MRI using ICA1Department of Physics & Astronomy, University of British Columbia, Vancouver, BC, Canada, 2Department of Integrative Oncology, BC Cancer Research Centre, 3UBC 7T MRI Research Centre, University of British Columbia
Synopsis
MRI methods to assess tissue oxygenation have recently flourished. Here we explore how a common signal processing technique (independent component analysis) can be used to extract and amplify signal from oxygen stimuli in mouse tumours. With just dynamic T1-weighted images and ICA to extract the enhancing pixels, we can create rich parameter maps corresponding to a response to an oxygen challenge.
Introduction
Hypoxic cells have been described as the most validated target yet to be exploited in cancer treatment. Recently, a new method for assessing tissue oxygenation called oxygen-enhanced MRI (OE-MRI) was proposed which relies on measuring changes in T1 arising from inhalation of hyperoxic gas and the subsequent increase in dissolved oxygen in the blood plasma or interstitial tissue fluid [1]. Recent efforts to modulate and map tumour hypoxia in pre-clinical models using oxygen-enhanced MRI have shown tremendous promise but the robustness of the results rely on a DCE-MRI experiment with an exogenous contrast agent to select an appropriate region of interest in the well perfused tumour tissues. Furthermore, oxygen enhancement MRI is fraught with SNR problems as well as a heterogeneous tumour microenvironment that results in vastly different responses between tumour types [1]. In this work, we demonstrate a preliminary effort applying independent component analysis (ICA) without a priori information about the oxygen stimulus to measure and map hypoxia. Resultant OEMRI parameter maps depicting voxels predicted to be oxygenated are compared with histological sections of the same tumours stained for vascular function.Methods
Animals: Ten NRG mice were implanted with a human mammary carcinoma (BT474) cell line in the dorsal subcutaneous region and tumours were allowed to grow until they reached at least 500mm^3.
MRI: Imaging was performed using a 7T scanner (Bruker Biospec 70/30 USR, Germany) with a transmit quadrature volume coil and a custom built surface receive coil. Following standard pilot scans and field map-based shimming, a T1 map was acquired using the Look-Locker method. OE-MRI scans were acquired with 250 repetitions using a 2D FLASH based sequence with TE = 2.67ms, TR = 66.7 ms, alpha = 40, 8 slices each 1mm thick, a FOV of 3.84 cm x 1.92 cm, encoding matrix of 128 x 64, and a temporal resolution of 4.3s with 198 repetitions for a total scan time of about 14 minutes.
Oxygen Challenge: Mice were anaesthetized using 1.5 – 2.0 % isofluorane delivered via medical air (78% Nitrogen, 21% oxygen). Breathing gas was alternated between medical air and 100% oxygen every 3 minutes for a total of 2.5 cycles during the OE-MRI scan.
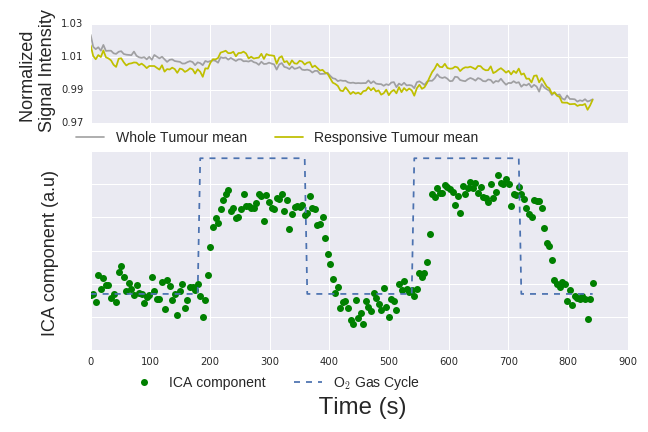
Analysis: ROIs were drawn around the tumour region using a RARE image prior to ICA. FastICA of the python package scikit (sklearn v0.17.1) was used to analyze the data and extract components using a deflation algorithm and no pre-processing. All extracted components were tested for correlation with the O2-challenge paradigm (a square wave switching between O2 and medical air every 3 minutes). Only one component was correlated with the O2-challenge paradigm.
Results
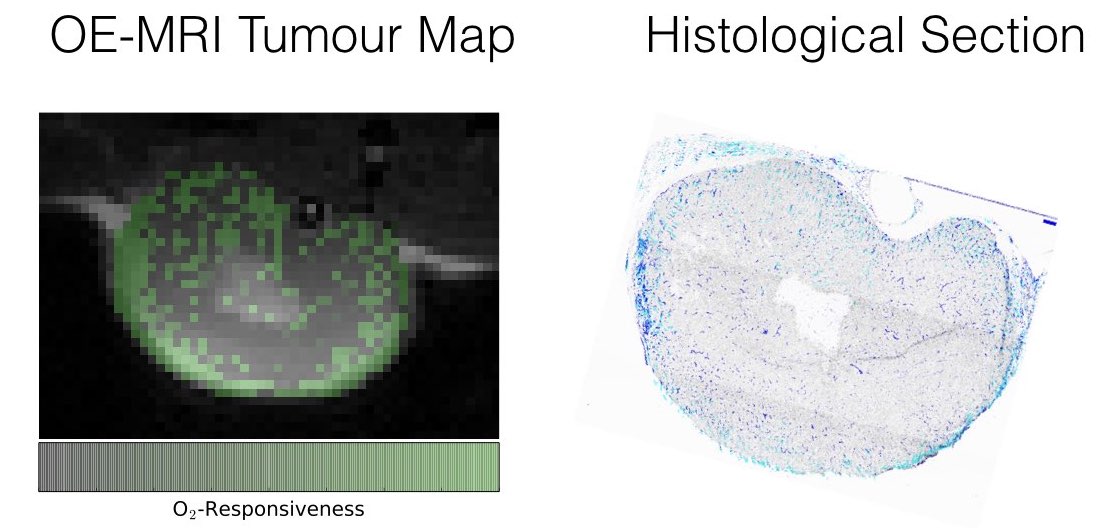
ICA resulted in multiple components but there was a strong extracted component that correlated with the gas challenge paradigm. A response to the gas challenge was observed in the tumours but the number of pixels within each tumour that were considered 'responsive' by setting a threshold varied greatly. Histological sections of some tumour slices (shown in figure 2) show that all areas where pixels were deemed responsive to oxygen were well-perfused, not all well-perfused areas responded to oxygen. Further studies are already underway to validate OE responding pixels with histological stains (pimonidazole).Conclusions
In this study, we have shown a bias-free analysis approach to measuring response of tumour tissue to an oxygen gas challenge demonstrating a technique that could be used to map hypoxia in tumours. Importantly, this technique does not require any a priori information about the breathing paradigm. It is also resistant to other temporal trends in signal intensity as can arise from body temperature drift and other physiological confounding factors.Since our tumour model is of a highly vascular type, our findings corroborates the work of O'Connor et al. showing a good correlation of 'oxygen-refractory' regions with hypoxic areas.The much higher temporal resolution and the gained SNR-sensitivity from the ICA approach opens the way for the study of the temporal features in the oxygen response on a pixel level.Acknowledgements
This work has been supported by the NSERC Discovery program.References
[1] O'Connor, J. P. B., Boult, J. K. R., Jamin, Y., Babur, M., Finegan, K. G., Williams, K. J., et al. (2016). Oxygen-Enhanced MRI Accurately Identifies, Quantifies, and Maps Tumor Hypoxia in Preclinical Cancer Models. Cancer Research, 76(4), 787–795. http://doi.org/10.1158/0008-5472.CAN-15-2062
Figures