4499
Characterization of Intratumoral Heterogeneity Based on BOLD Effect: A Study in 13762NF Breast Tumor1Radiology, The University of Texas Southwestern Medical Center, Dallas, TX, United States
Synopsis
Characterization of intratumoral heterogeneity is crucial for the accuracy and specificity of MRI evaluation of cancer. BOLD MRI, which is widely used for investigating tumor oxygenation, is sensitive to the structure and function of tumor vasculature. We present a method, based on BOLD effect (R2* dynamics), for differentiating subregions in rat 13762NF tumors that show different degrees of sensitivity with respect to hyperoxic and hypoxic gas breathing challenges. We further show the potential connection between the classified heterogeneity and tumor growth.
Introduction
Oxygenation-sensitive MRI methods, e.g., BOLD and TOLD, are being explored as prognostic tools for evaluating cancer treatment efficacy1. Intratumoral heterogeneity in structure (e.g., tissue type and vasculature) and function (e.g., oxygenation profile and pH) is widely observed in various types of tumor in both human and animal models2. The characterization of intratumoral heterogeneity is crucial with respect to specificity and accuracy of MRI measurements. Herein, we present a method for the classification of tumor subregions in an animal model of breast tumor, 13762NF, according to the temporal variation in R2* during various gas breathing challenges.Methods
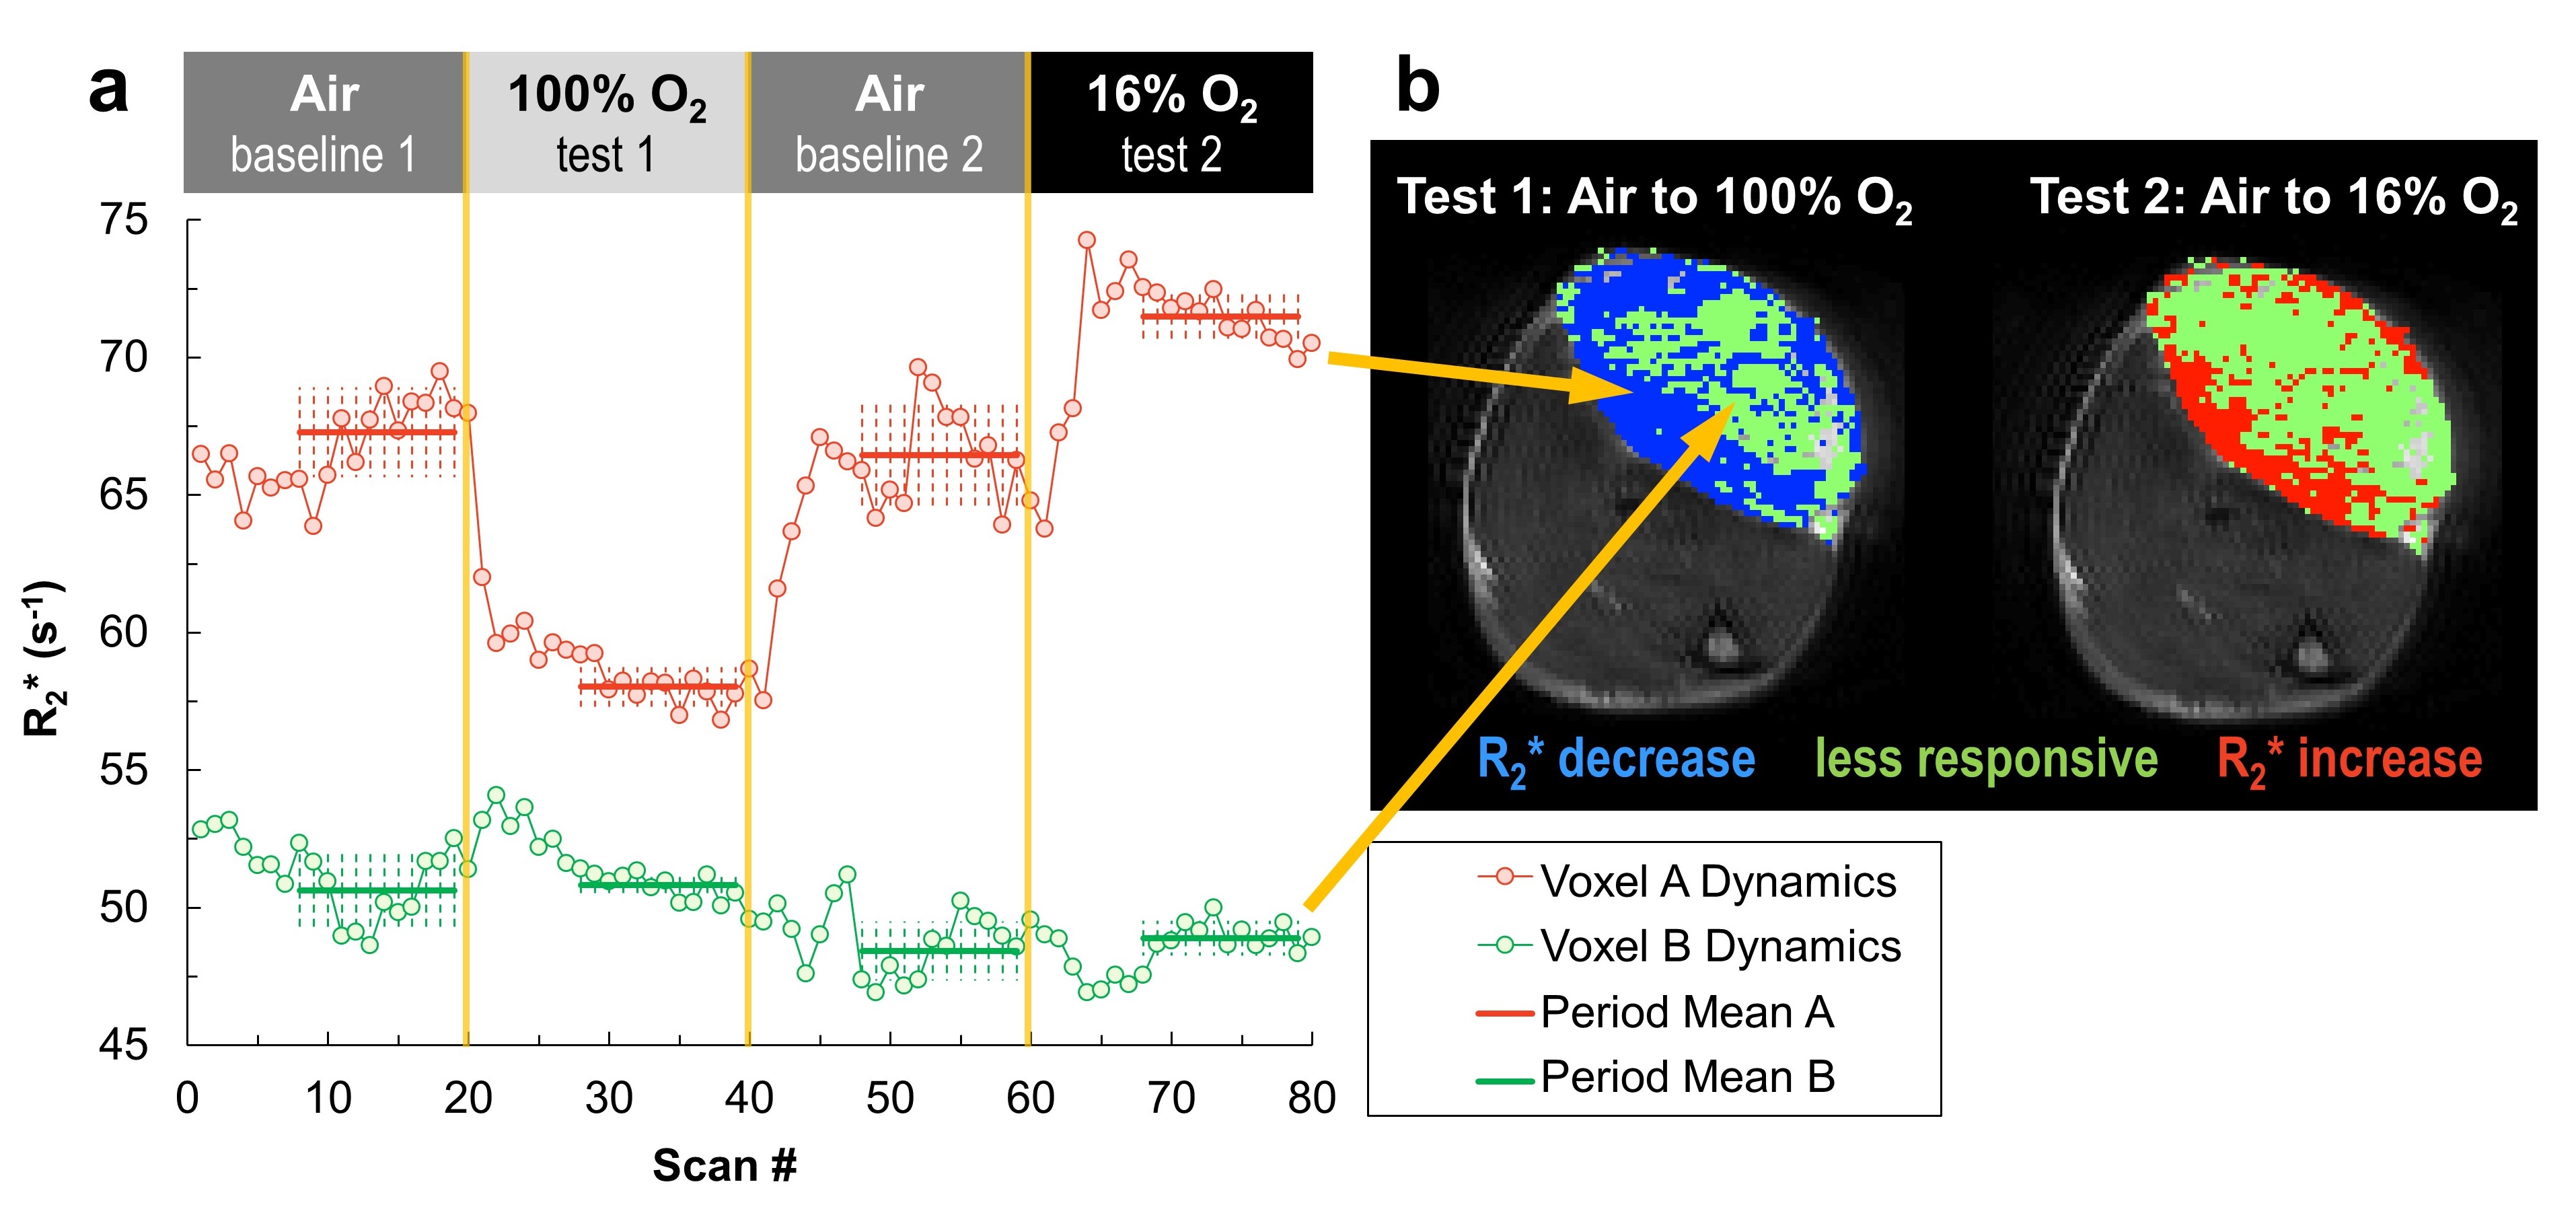
Rat 13762NF tumors were implanted subcutaneously into the right thigh of Fischer rats (n = 13) and grown to 0.1–3.5 cm3 in volume. Multi-gradient-echo R2* mapping and short-TR, R1-weighted, gradient-echo imaging (scan time 41.4 and 16 s, respectively) were alternately performed at 4.7 T for the gas breathing challenges (expressed as % O2 fraction; N2 as balance gas): i) 21–100–21–16 (n = 5), ii) 21–16 (n = 6), and iii) 21–16–21–100 (n = 2). R1 and R2 maps were acquired with 21% O2 (air) breathing before the challenges. All images were acquired from a 2-mm slice crossing the center of each tumor with in-plane spatial resolution 0.202–0.312 mm2/pixel (128 × 128), depending on the tumor size. The time course of R2* was analyzed voxel-wise and the final 60% of data points for each gas breathing period were used to calculate the period mean and standard deviation (temporal variation) of R2*. The responsiveness with respect to each gas breathing test was determined by whether the mean R2* in a test period fell out of the range of mean ± 2 SD in the baseline period acquired immediately before the test period. Voxels were classified as either responsive (test mean R2* out of the baseline range) or less responsive (test mean R2* within the baseline range).Results
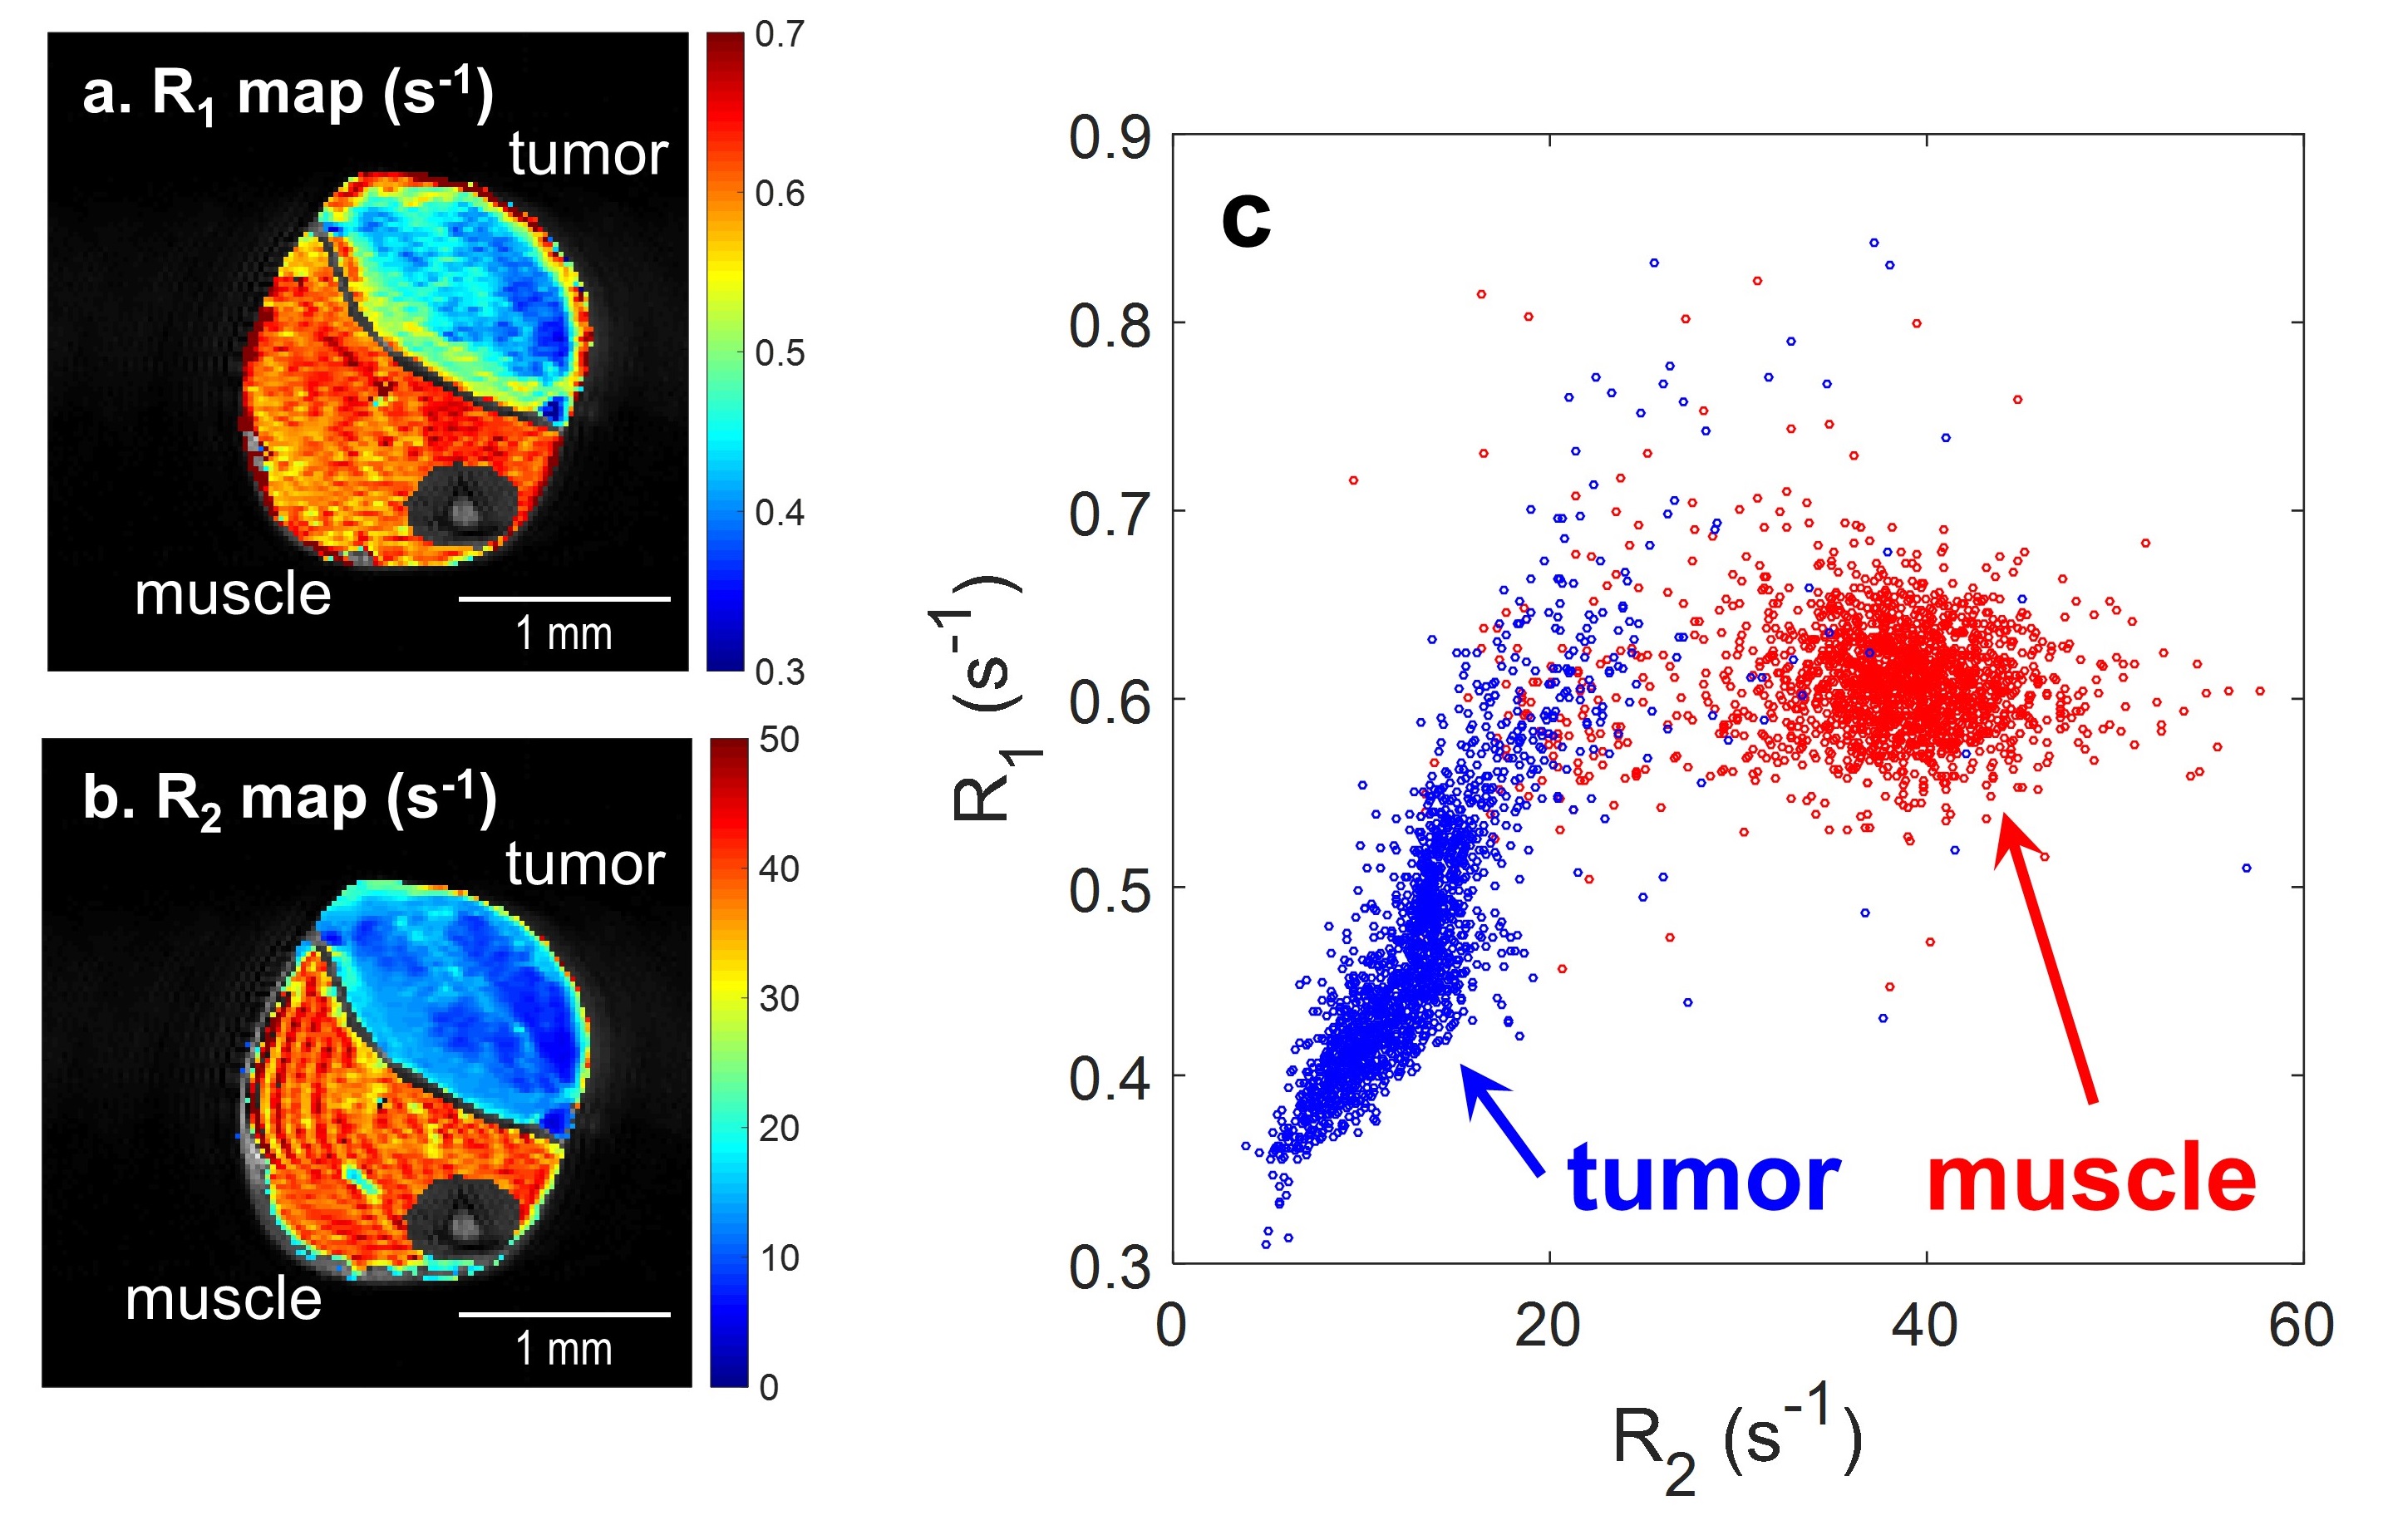
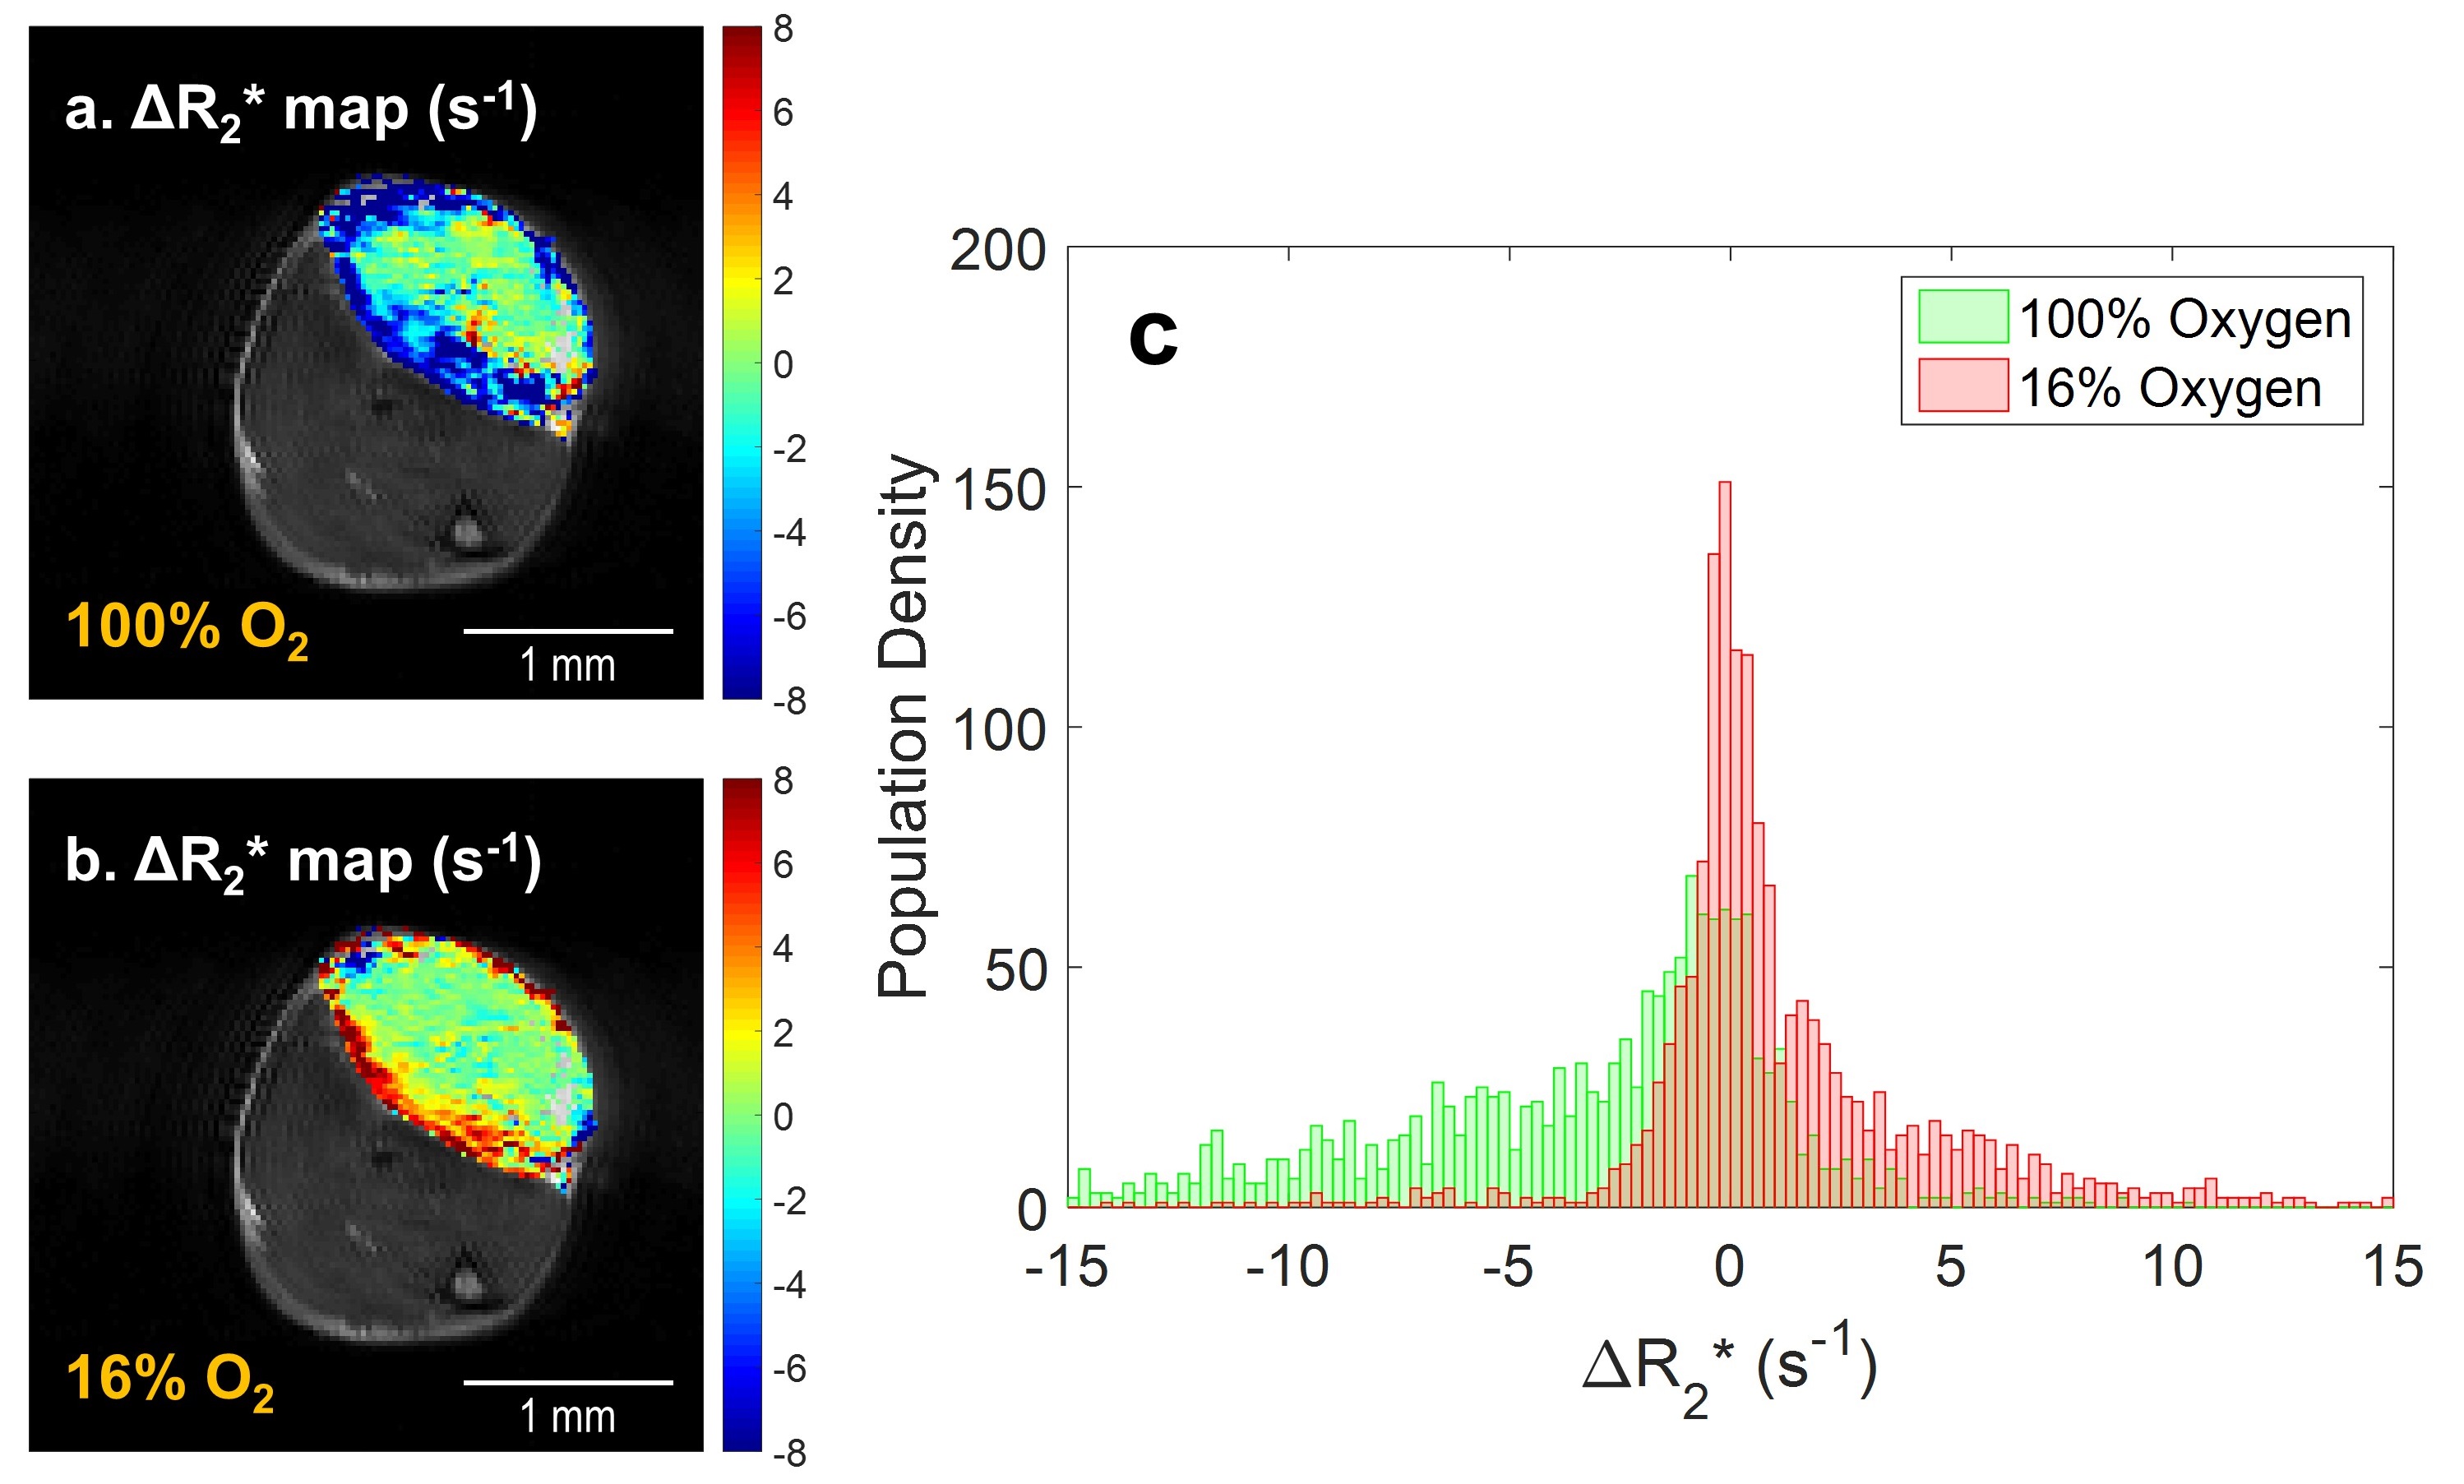
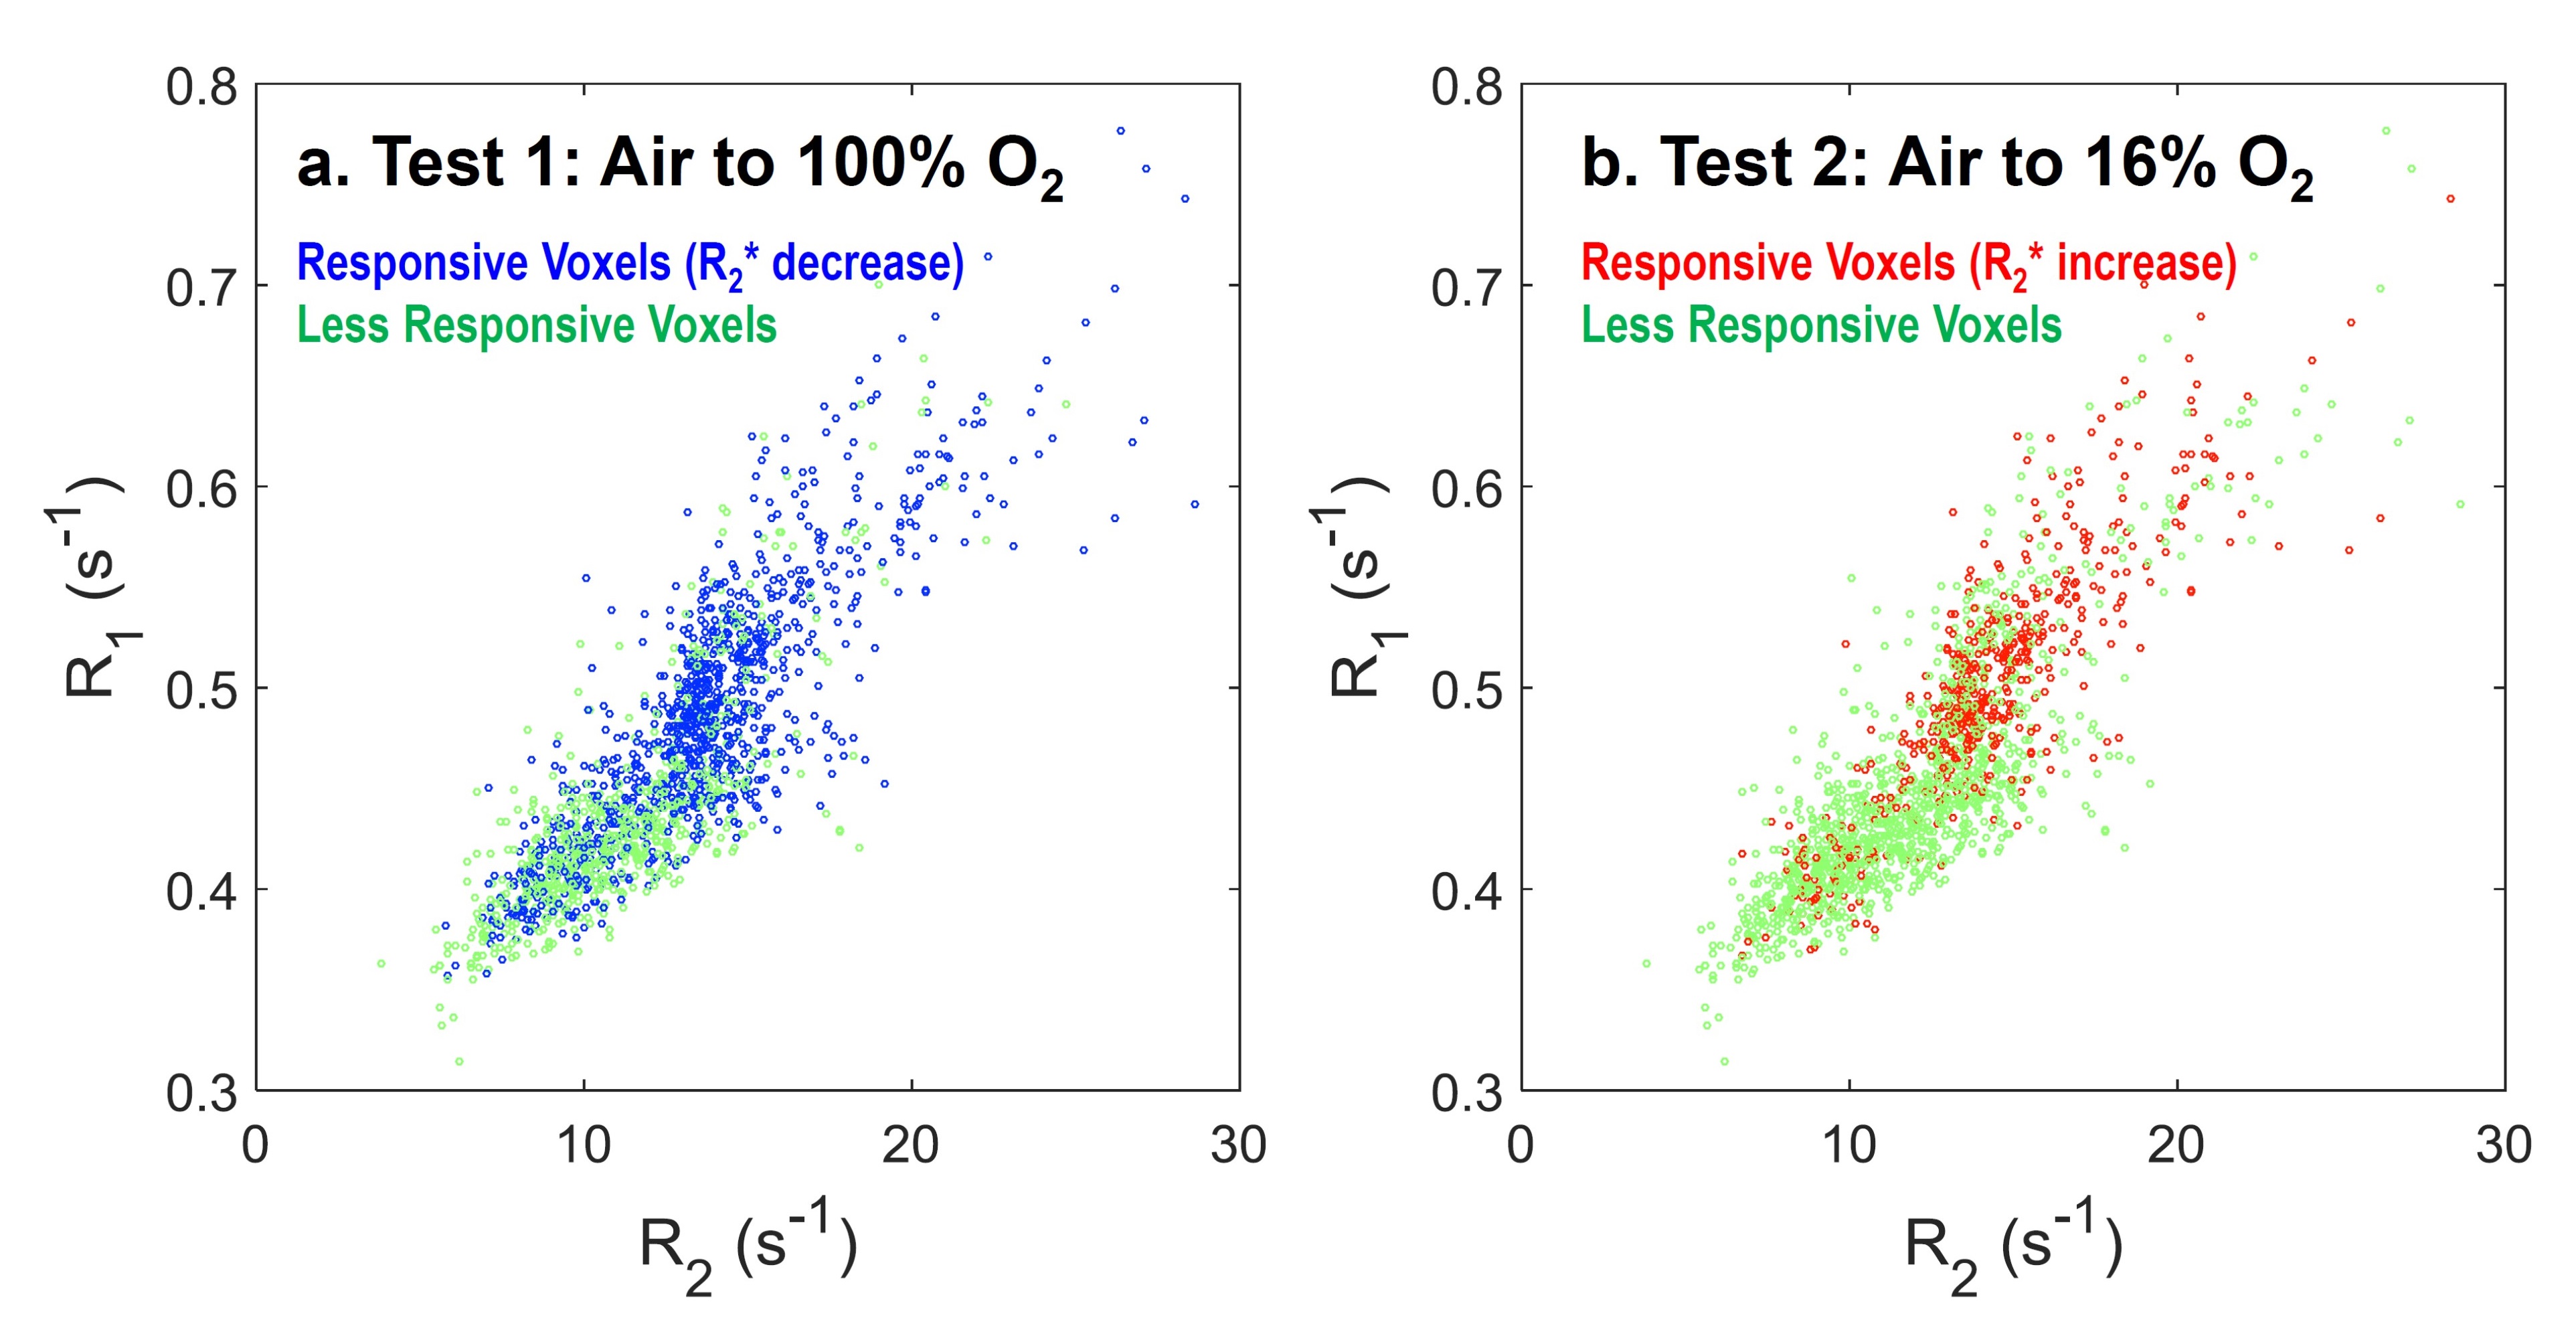
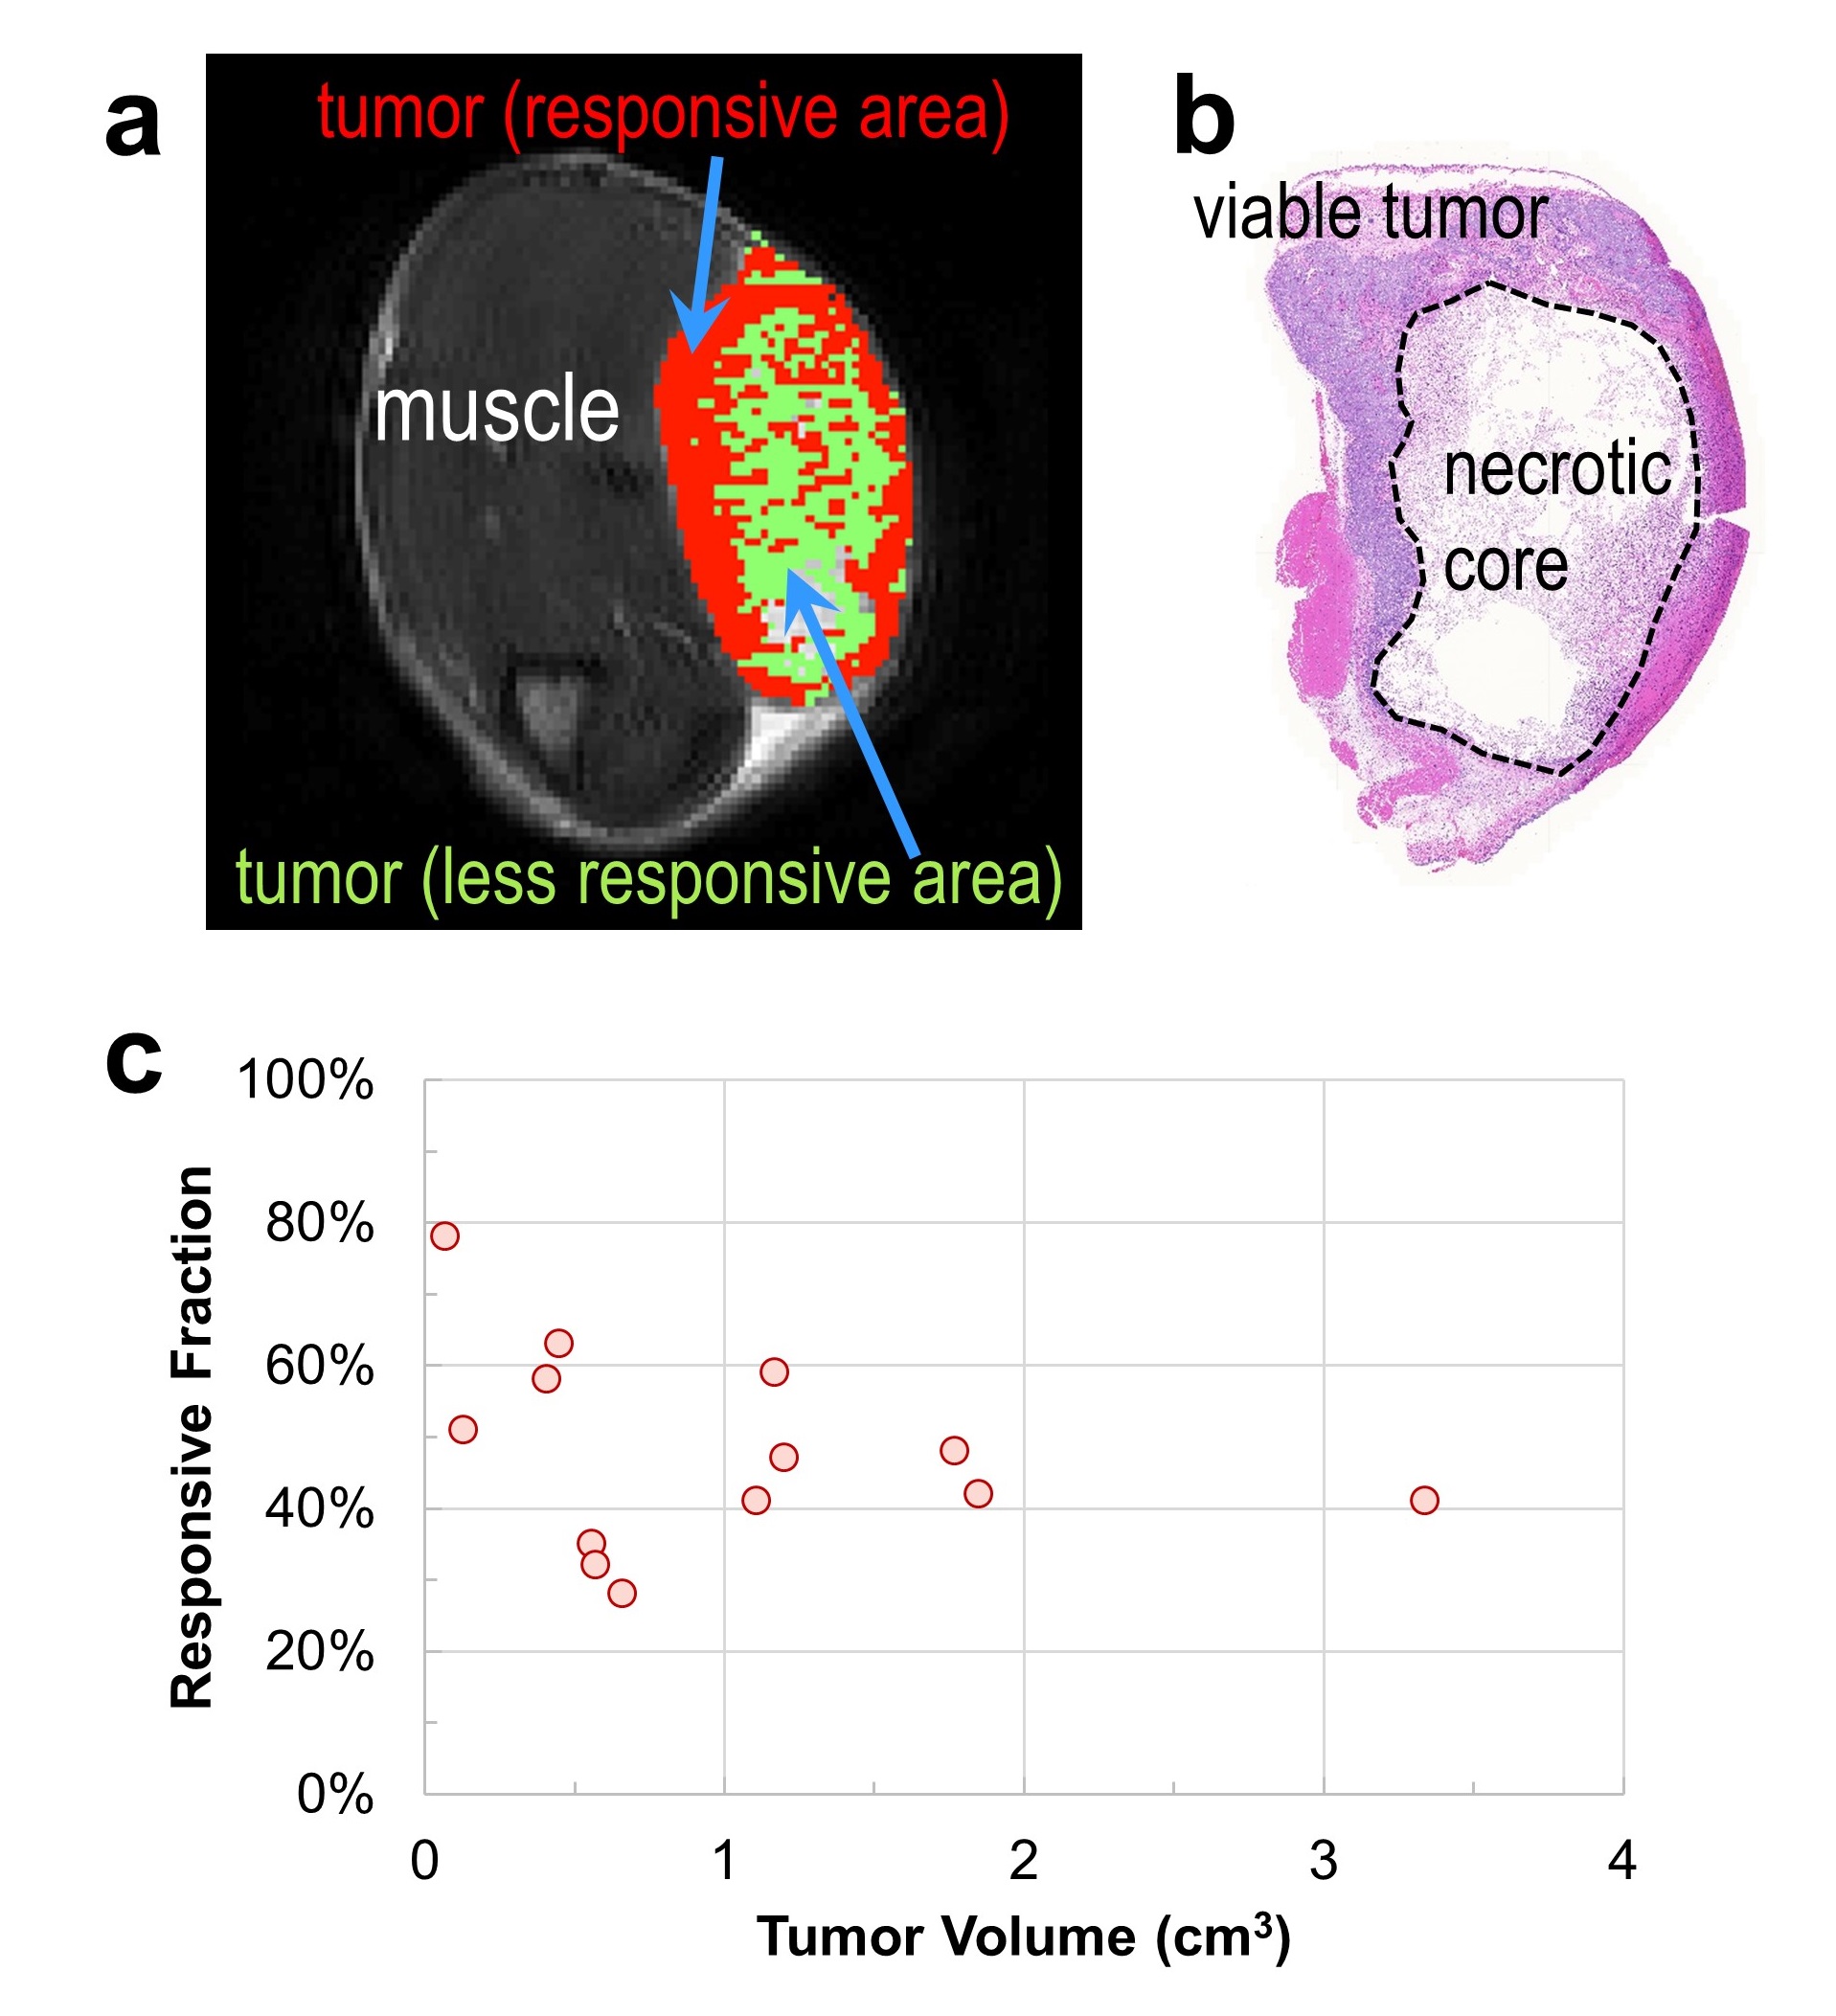
R1 and R2 maps (Fig. 1a & 1b) at air breathing highlight different levels of R1 and R2 within the tumor. The cluster of tumor voxels spreads continuously and widely in the map constructed using R1 and R2 as voxel coordinates (Fig. 1c). A large part of the tumor cluster is associated with low R1 and R2 values, which are commonly observed in necrosis in 13762NF tumors. Larger changes in R2* (decrease for 100% O2 breathing and increase for 16% O2 breathing) is located at the periphery of each tumor (Fig. 2a & 2b). The histogram of voxel-wise ΔR2* is continuous over a wide distribution, allowing no precise cutoff to differentiate the subregions showing different ΔR2* (in the simplest case, periphery vs. core). The R2* time courses of two representative voxels are shown in Fig. 3a to demonstrate the classification protocol. The core of the tumor is classified as less responsive in both hyperoxic and hypoxic gas breathing tests (Fig. 3b). The responsive areas in the two tests are not identical, but largely overlap, especially at the tumor periphery. The two classes of voxels (responsive vs. less responsive) reside in different locations in the maps employing R1 and R2 coordinates (Fig. 4). The classification correlates well with H&E staining (Fig. 5a & 5b). A general trend is observed, where the volume fraction of responsive area decreases with increasing tumor volume (Fig. 5c).Discussion
Rat 13762NF breast tumors develop large volume of necrosis which is associated with distinct MR properties compared with viable tumor3-4, making it crucial for the differentiation between the two types of tissue. R1 and R2 maps are useful for visualizing intratumoral heterogeneity but classification based on R1 or R2 is challenging due to the continuous, wide distribution of these parameters within the tumor. Previous work attempted outlining the outer rim of tumors (1–2 mm in thickness) based on visual and manual ROI identification4, which is time-consuming and subject to inconsistency/inaccuracy. BOLD MRI (R2* mapping here) is widely used for studying the oxygenation properties of tumor. Classification based on R2* dynamics with respect to gas breathing challenge is relevant to the structure and function of tumor vasculature. Similar analysis was attempted in the dynamic R1-weighted imaging, but led to less informative results due to its smaller dynamic range of signal (~±5%) in response to gas challenges.Conclusion
An image analysis framework is established to characterize the oxygenation-relevant, intratumoral heterogeneity based on the temporal dynamics in BOLD MRI during hyperoxic and hypoxic breathing challenges. Classification of heterogeneity is achieved in rat 13762NF tumors and applied for the differentiation of tumor subregions that exhibit different structural and functional properties.Acknowledgements
Supported in part by CPRIT RP-140399, NIH P41-EB015908 and P30-CA142543.References
1. Remmele, S.; Mason, R. P.; O’Connor, J. P. B., MRI Hypoxia Measurements. Functional Imaging in Oncology, Springer Berlin Heidelberg: 2014.
2. O'Connor, J. P. B.; Rose, C. J.; Waterton, J. C.; Carano, R. A. D.; Parker, G. J. M.; Jackson, A., Imaging Intratumor Heterogeneity: Role in Therapy Response, Resistance, and Clinical Outcome. Clin Cancer Res 2015, 21 (2), 249-257.
3. Song, Y. L.; Constantinescu, A.; Mason, R. P., Dynamic Breast Tumor Oximetry: The Development of Prognostic Radiology. Technol Cancer Res T 2002, 1 (6), 471-478.
4. Zhao, D. W.; Jiang, L.; Hahn, E. W.; Mason, R. P., Tumor Physiologic Response to Combretastatin A4 Phosphate Assessed by MRI. Int J Radiat Oncol 2005, 62 (3), 872-880.
Figures