4498
Probing Tumor Oxygenation Response to Hypoxic Gas Breathing1Radiology, The University of Texas Southwestern Medical Center, Dallas, TX, United States
Synopsis
Tumor oxygenation response to hypoxic gas breathing is studied in rat 13762NF breast tumors using BOLD and TOLD MRI, with hyperoxic gas breathing as
Introduction
Hypoxia in breast tumors is the target of a novel therapeutic strategy deploying bioreductively activatable prodrug conjugates. A prerequisite for developing this therapy is to evaluate the hypoxia profile in various breast tumor models in rodents and, if necessary, to aggravate hypoxia via hypoxic gas breathing. Compared with the extensively studied hyperoxic gas breathing1, hypoxic gas breathing provokes different physiological changes, and hence impacts MRI parameters through different patterns. Herein, we apply oxygenation-sensitive MRI methods to investigate the response to hypoxic gas breathing in rat 13762NF tumors.Methods
Rat 13762NF tumors were implanted subcutaneously into the right thigh of Fischer rats (n = 8) and grown to 0.1–3.5 cm3 in volume. Interleaved R2* (BOLD) mapping and short-TR, R1-weighted, gradient-echo (TOLD) imaging (scan time 41.4 and 16 s, respectively) at 4.7 T was performed across air to 16% O2 and air to 100% O2 breathing challenges (n = 4 in each challenge). In some experiments, R1 maps (8 min with 5 TI’s) were collected before and after the interleaved BOLD and TOLD time course. All images were acquired from a 2-mm slice crossing the center of the tumor with in-plane spatial resolution 0.202–0.312 mm2/pixel (128 × 128), depending on the tumor size. For one additional rat, hypoxic gas breathing challenge was extended to 14% O2 following the regular 16% O2 step. MRI parameters, i.e., R2*, R1-weighted (TOLD) signal intensity (SI), and R1, were analyzed voxel by voxel in tumor and thigh muscle. R2* baseline (air breathing) voxel-wise temporal variation was used as the criterion to distinguish the responsive vs. less responsive areas in the tumor for each gas breathing challenge. Raw TOLD SI was modified, voxel-by-voxel at each dynamic time point, to remove the R2*-weighted signal decay according to the following equation: SI(modified) = SI(raw) / exp(-R2*∙TE), where TE = 5 ms.Results
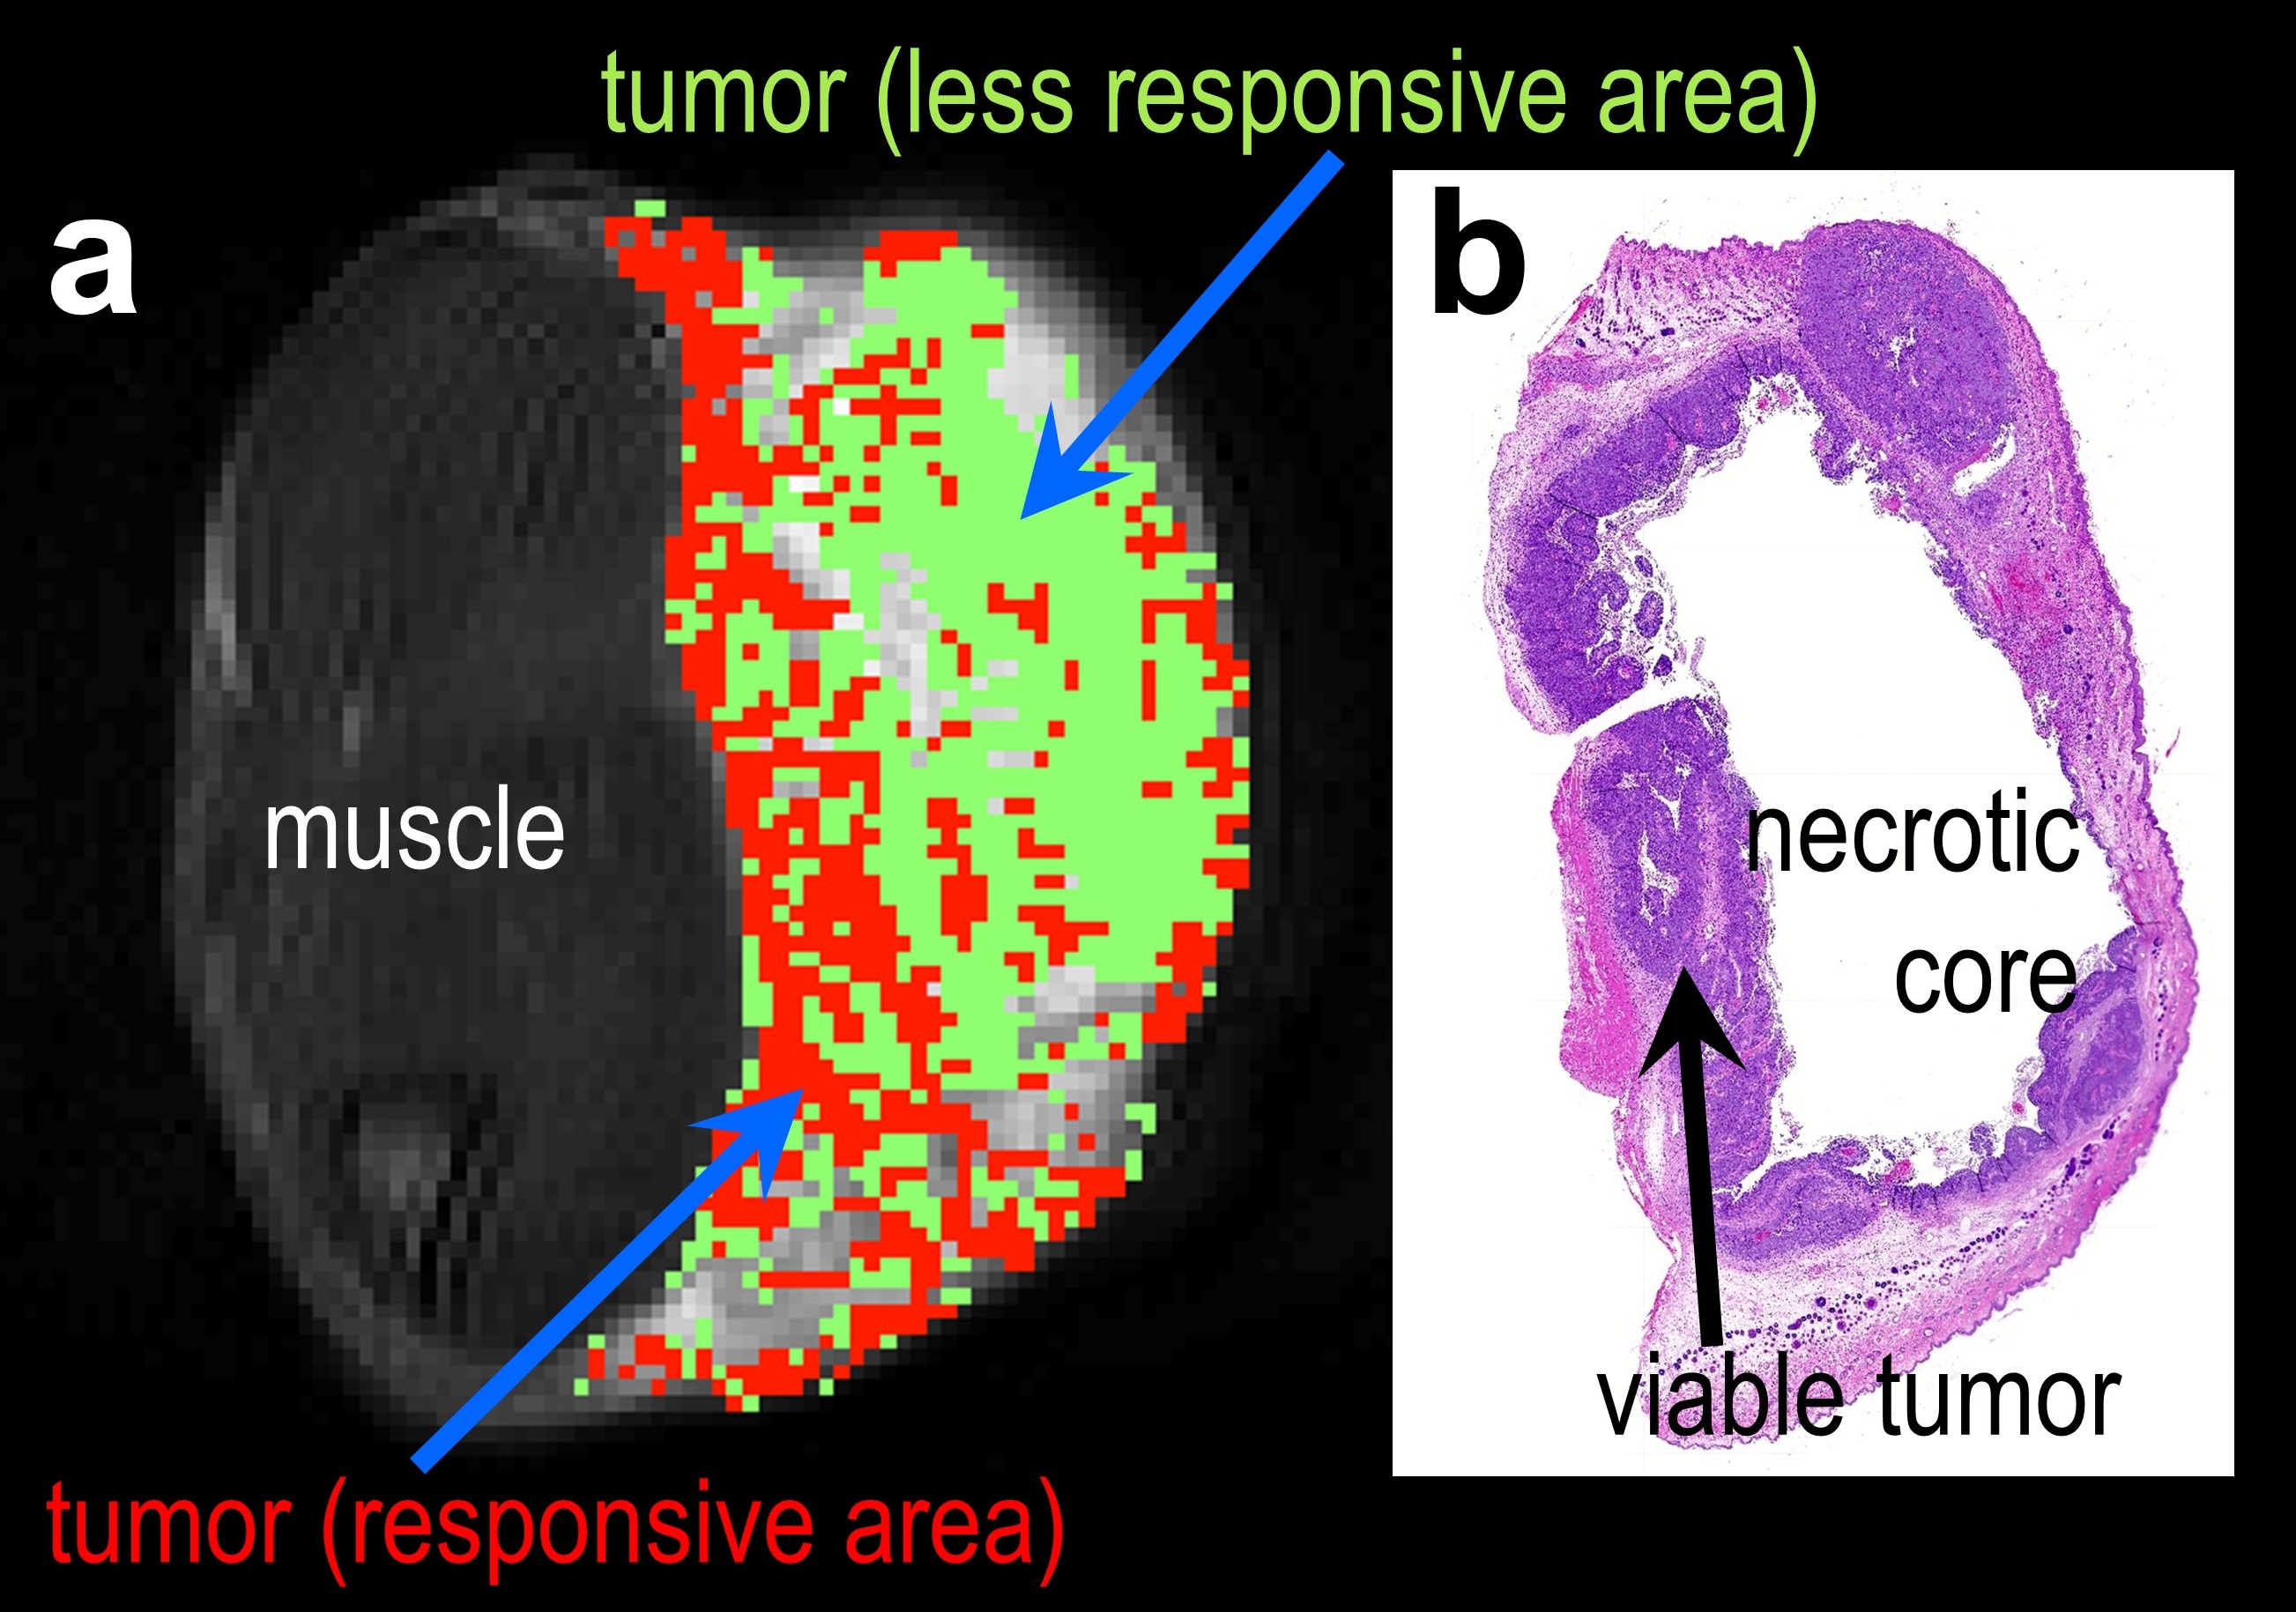
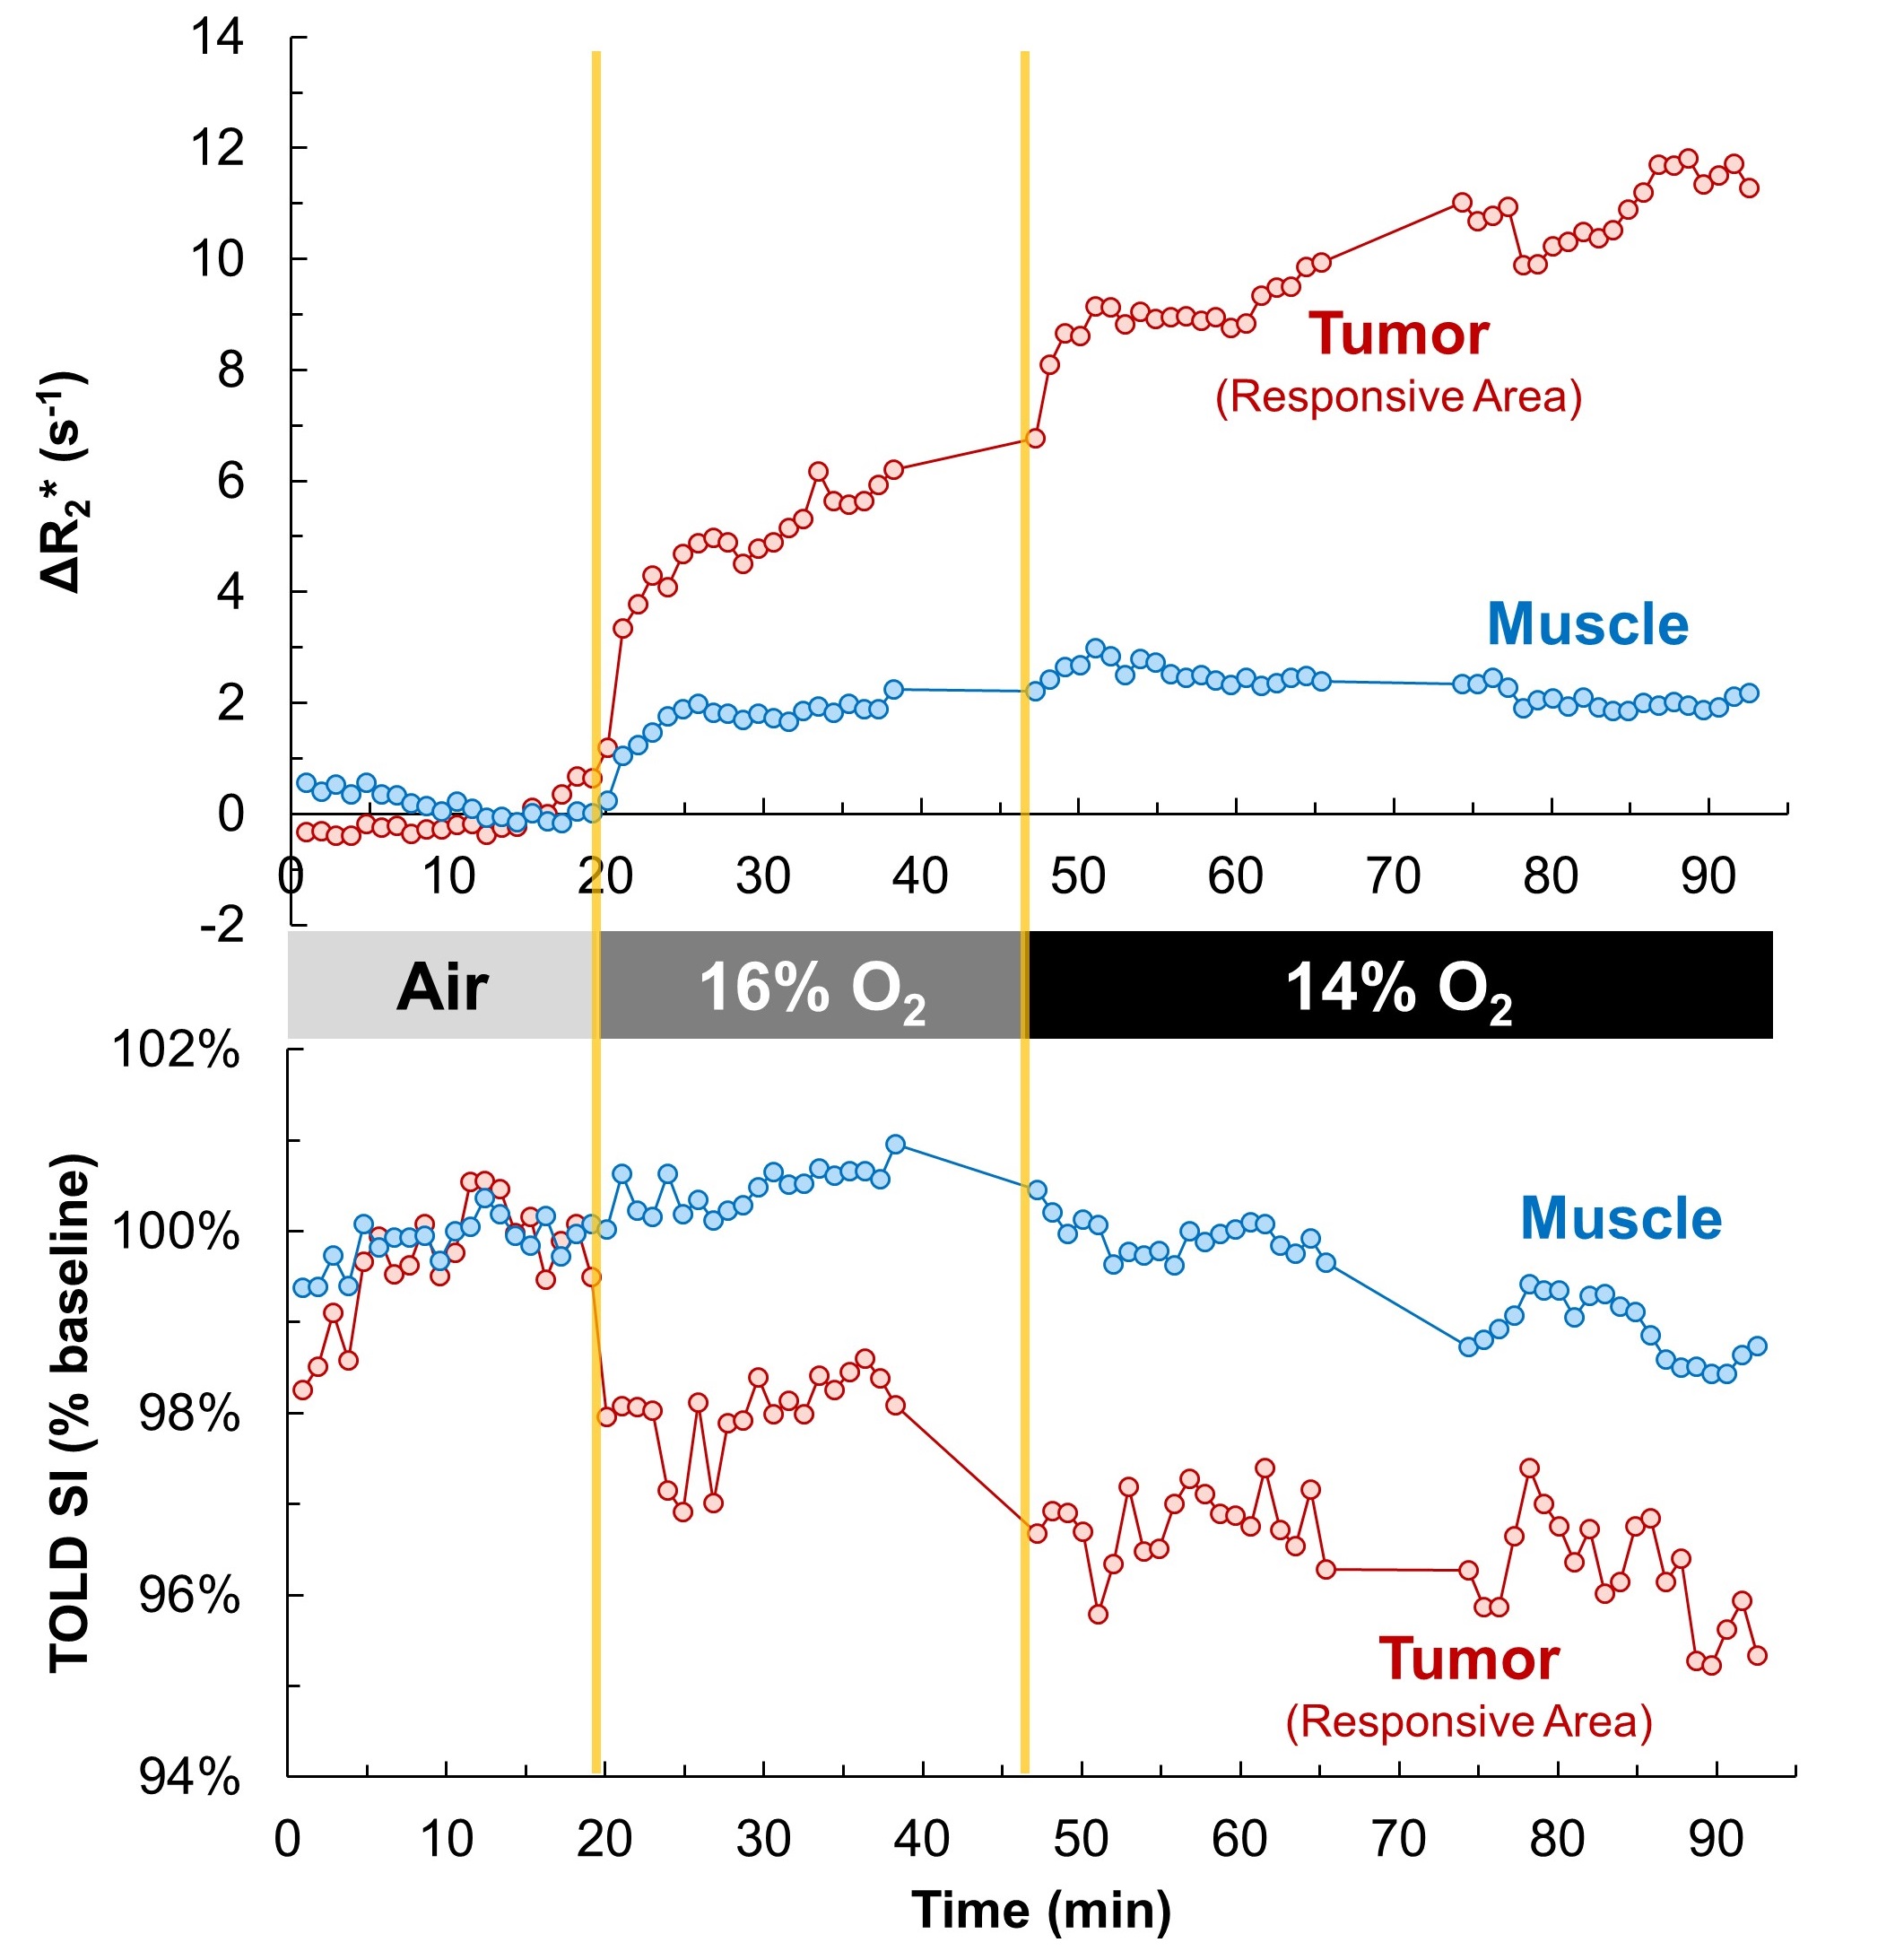
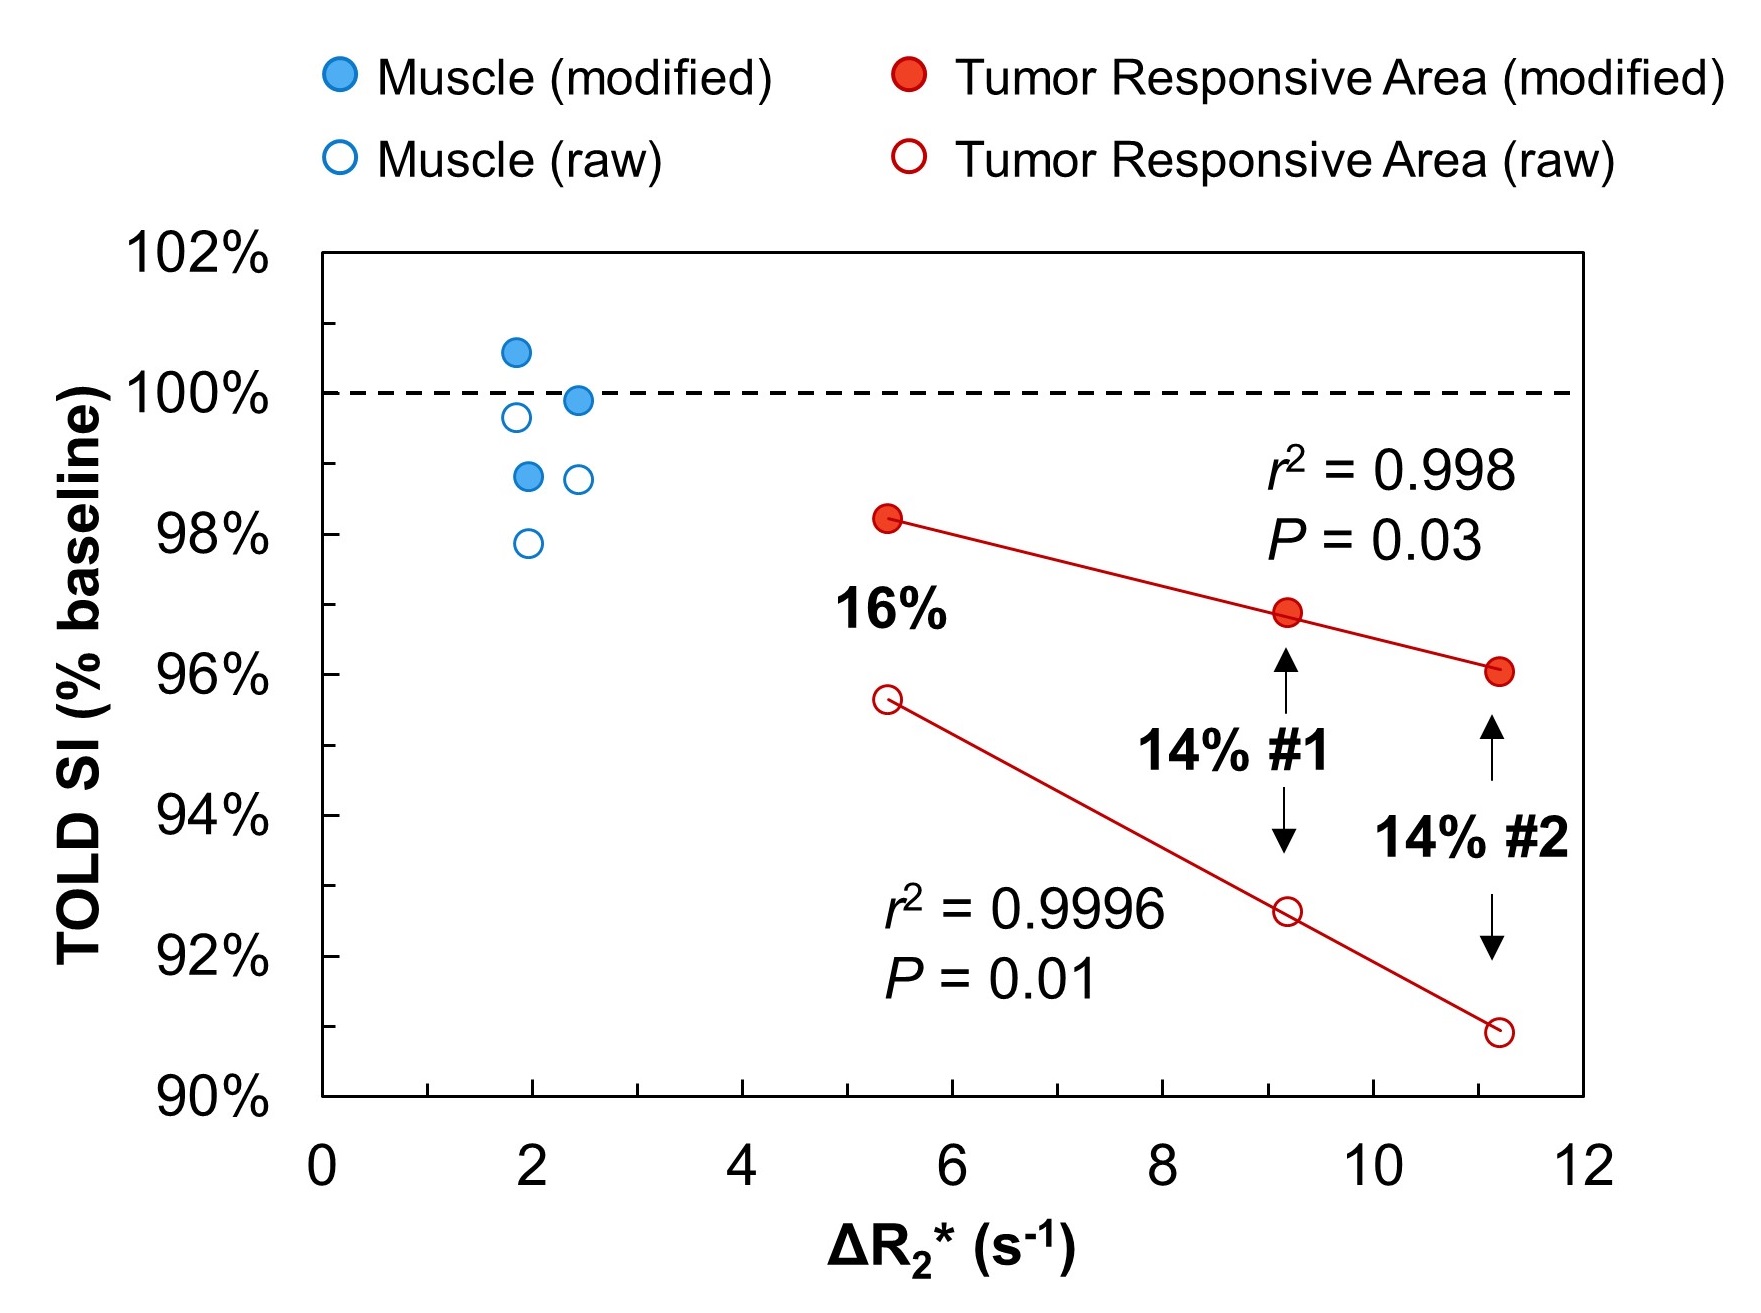
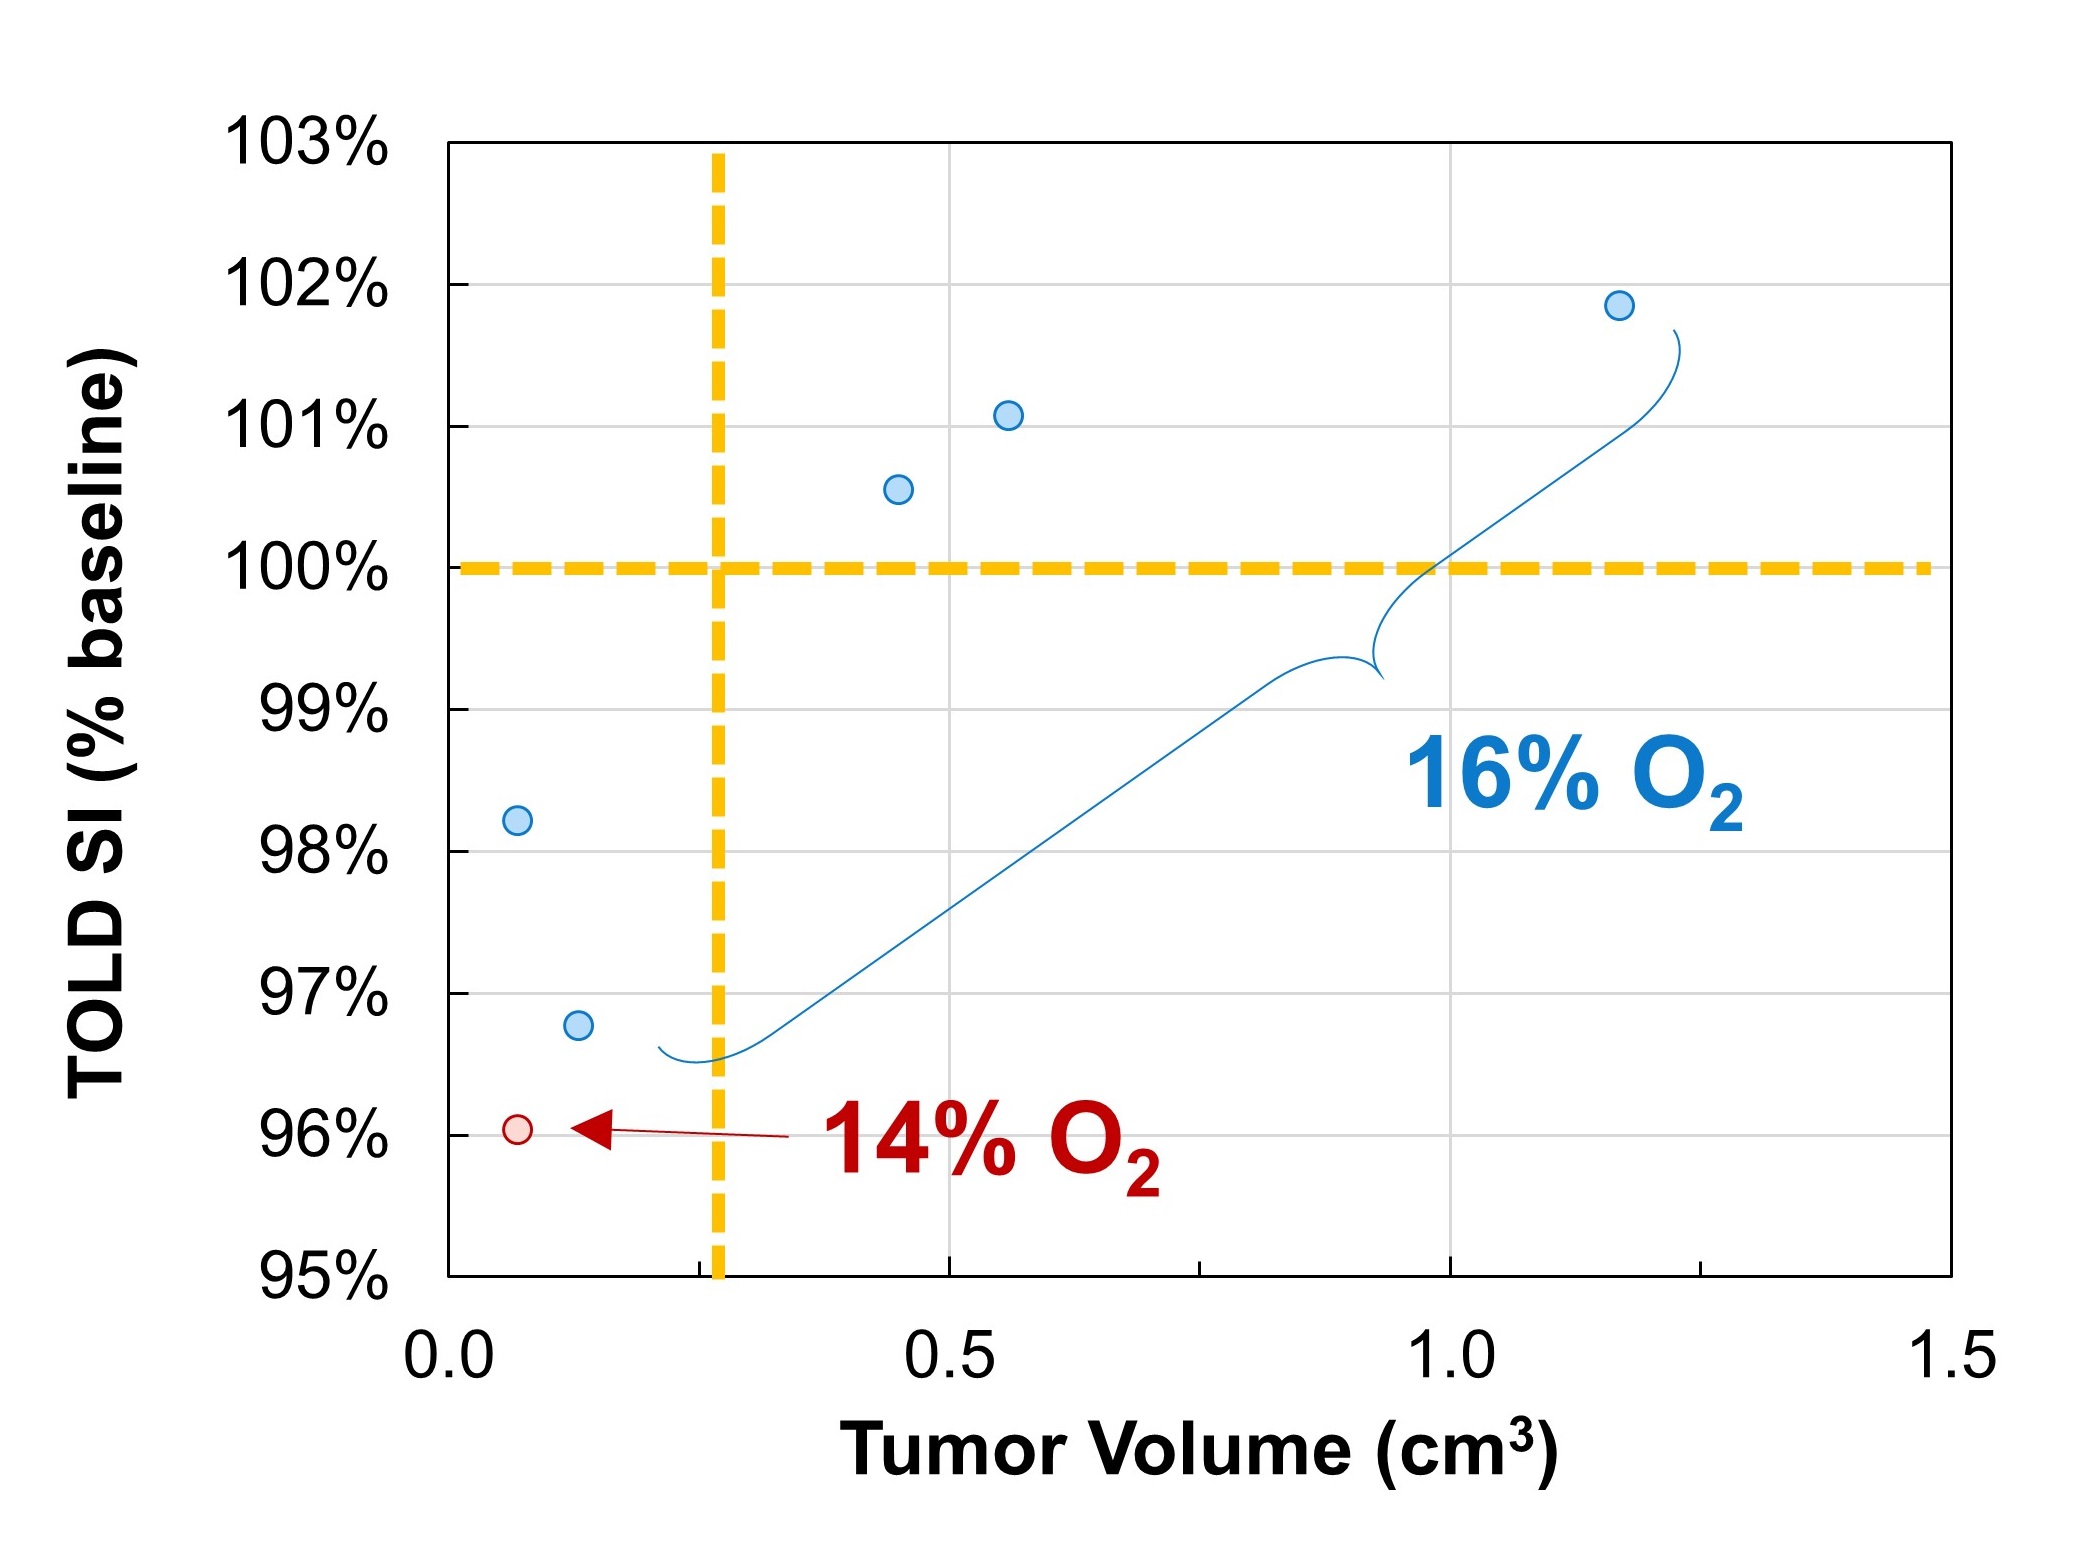
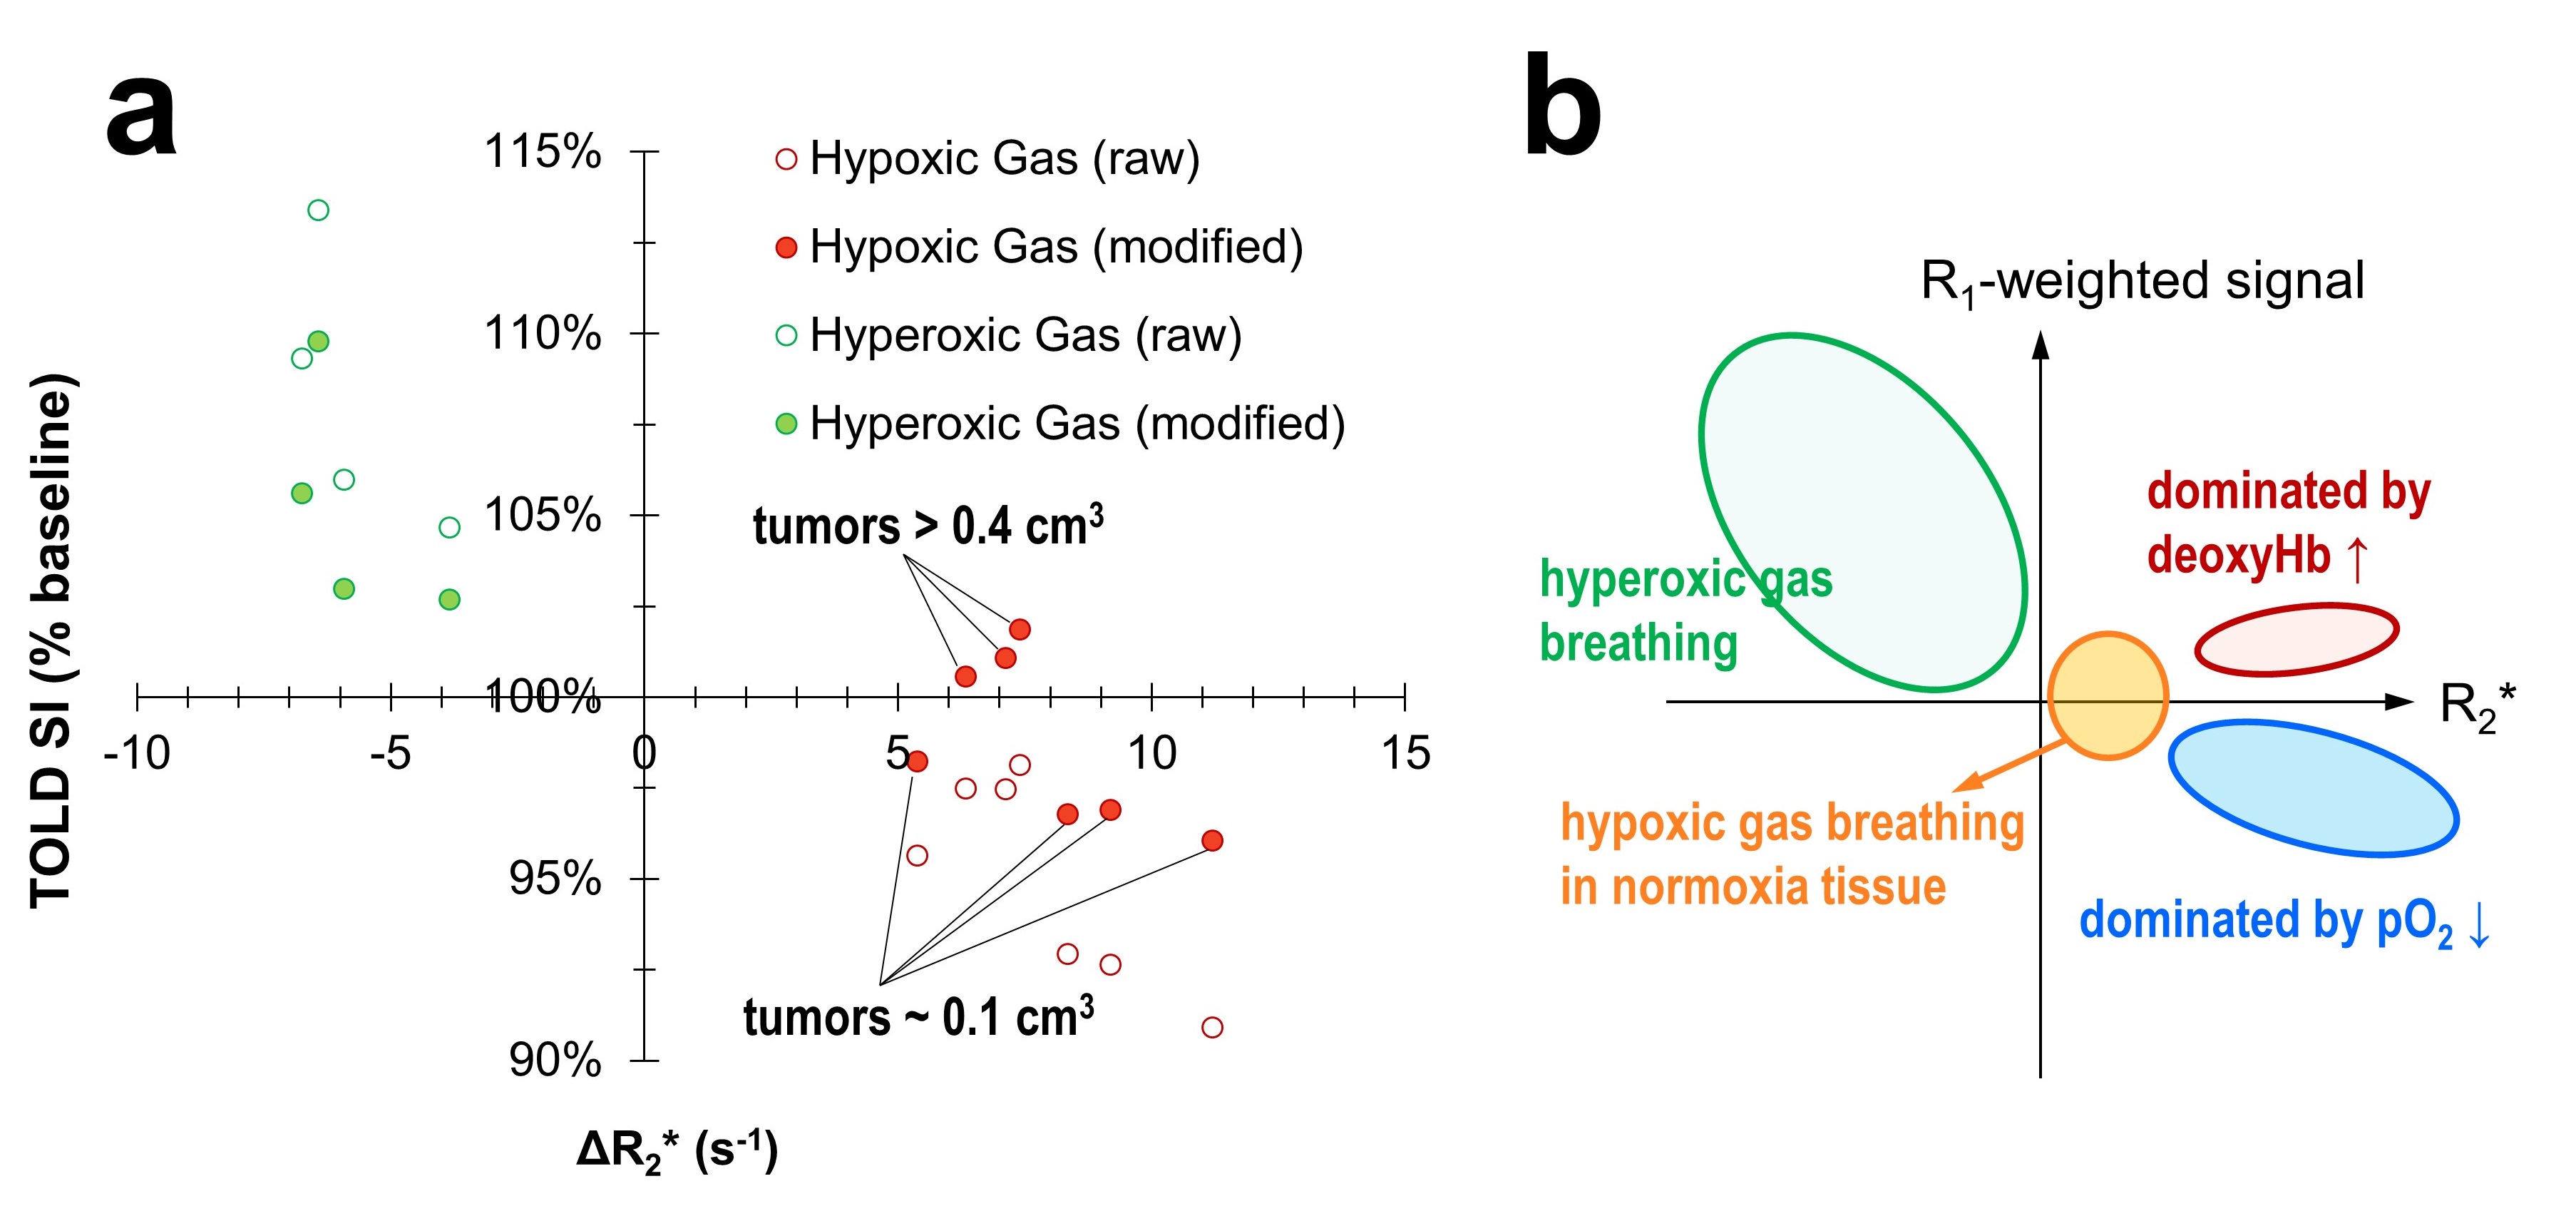
Rat 13762NF tumors are found to be highly heterogeneous and develop mucinous necrotic cores when grown larger than 0.5 cm3. Intratumoral responsive area, derived from R2* dynamics, is typically located in the tumor periphery (Fig. 1a), corresponding to viable tumor tissue with accessible vasculature (Fig. 1b). BOLD and TOLD responses to gas breathing challenges in the responsive area of tumor are invariably larger than those in muscle (Fig. 2). Progressive hypoxic gas breathing (air to 16% and then 14% O2) led to a linear correlation between ∆R2* and TOLD SI in tumor, but minimal change was observed in muscle (Fig. 3). Both regional decreased and increased TOLD SI during hypoxic gas breathing was observed in small (~0.1 cm3) and large (>0.4 cm3) tumors, respectively (Fig. 4). Similar magnitude of ∆R2*, yet in different directions, were observed during hypoxic and hyperoxic gas breathing (Fig. 5a). Discussion
Tissue R2* is positively correlated with the fraction of deoxyhemoglobin (deoxyHb) in the total hemoglobin in blood. TOLD SI, essentially R1-weighted signal, depends on the combined contribution from blood flow, tissue pO2, and blood deoxyHb fraction1, where molecular O2 and deoxyHb both act as R1 contrast agent. The effect of hyperoxic gas breathing, which has been extensively studied in various types of tumors, is generally decrease in R2* (due to deoxyHb decrease) and increase in TOLD signal (increase in R1 due to pO2 increase), the extent of which further depends on the native oxygenation status and vasculature function of the tissue (or tumor)2-4. Consistent results for 100% O2 breathing are shown here in 13762NF tumors. Hypoxic gas breathing enhances deoxyHb fraction in blood, demonstrated herein by the increased R2*. TOLD response differs for different tumor sizes. For large tumors, an increase in TOLD SI might be dominated by increased deoxyHb which overcomes the opposite impact of decreased pO2 (if any). For small tumors, the decrease in TOLD SI in the presence of evident deoxyHb increase (revealed by the increased R2*) might reflect a large decrease in tumor pO2. Interestingly, during the progressive 16% and 14% O2 breathing challenge, the two independently measured parameters, R2* and TOLD SI, correlate linearly (Fig. 3), implying similar underlying contributor(s). A schematic illustration of possible BOLD and TOLD response pathways is shown in Fig 5b. Future studies will address the role of tumor size and vascular perfusion in the observed BOLD and TOLD responses.Conclusion
This work explores the less studied effect of hypoxic gas breathing on oxygenation-sensitive MRI parameters in rat 13762NF breast tumors. Combined dynamic BOLD and TOLD measurement proves to be useful for probing changes in tumor oxygenation induced by hypoxic gas breathing.Acknowledgements
Supported in part by CPRIT RP-140399, NIH P41-EB015908 and P30-CA142543.References
1. Remmele, S.; Mason, R. P.; O’Connor, J. P. B., MRI Hypoxia Measurements. Functional Imaging in Oncology, Springer Berlin Heidelberg: 2014.
2. Hallac, R. R.; Zhou, H. L.; Pidikiti, R.; Song, K.; Stojadinovic, S.; Zhao, D. W.; Solberg, T.; Peschke, P.; Mason, R. P., Correlations of Noninvasive BOLD and TOLD MRI with pO2 and Relevance to Tumor Radiation Response. Magnet Reson Med 2014, 71 (5), 1863-1873.
3. Beeman, S. C.; Shui, Y. B.; Perez-Torres, C. J.; Engelbach, J. A.; Ackerman, J. J. H.; Garbow, J. R., O2-Sensitive MRI Distinguishes Brain Tumor Versus Radiation Necrosis in Murine Models. Magnet Reson Med 2016, 75 (6), 2442-2447.
4. O'Connor, J. P. B.; Boult, J. K. R.; Jamin, Y.; Babur, M.; Finegan, K. G.; Williams, K. J.; Little, R. A.; Jackson, A.; Parker, G. J. M.; Reynolds, A. R.; Waterton, J. C.; Robinson, S. P., Oxygen-Enhanced MRI Accurately Identifies, Quantifies, and Maps Tumor Hypoxia in Preclinical Cancer Models. Cancer Res 2016, 76 (4), 787-795.
Figures