4497
Improved quantification of SPIO in peripheral tumor xenografts using QSM1Weill Cornell Medical College, New York, NY, United States
Synopsis
The use of MRI relaxometry for super-paramagnetic iron oxide (SPIO) quantification in a murine peripheral tumor xenograft, a frequently performed procedure in drug development research, may result in inaccurate estimates because of the dependence of relaxivity on tissue microenvironment. SPIO complexes conjugated to PET radiotracers have been proposed for more accurate SPIO quantification, but these have disadvantages of a cyclotron requirement, low spatial resolution and confounding tumoricidal effects. We demonstrate that SPIO quantification in peripheral tumor xenografts using new quantitative susceptibility mapping (QSM) algorithms has good agreement with quantification using PET suggesting that QSM may provide value for quantification in drug development research.
Purpose
The ultimate goal of this project is to develop a clinically translatable preclinical quantitative imaging system. MRI, with its excellent soft tissue contrast and lack of ionizing radiation is ideally suited for clinically translatable preclinical imaging of tumor xenografts. Quantitative susceptibility mapping has been successfully applied to quantification of iron stores and gadolinium in the brain, but the presence of fat in the body and difficulty of background field removal at the edge of the body had hampered its application to tumor xenograft imaging. We apply recently developed chemical shift correction and total field dipole inversion algorithms to overcome these problems and obtain qualitatively improved QSM maps. Improvements in quantitative estimates were validated by dual-mode MRI-PET imaging.Methods
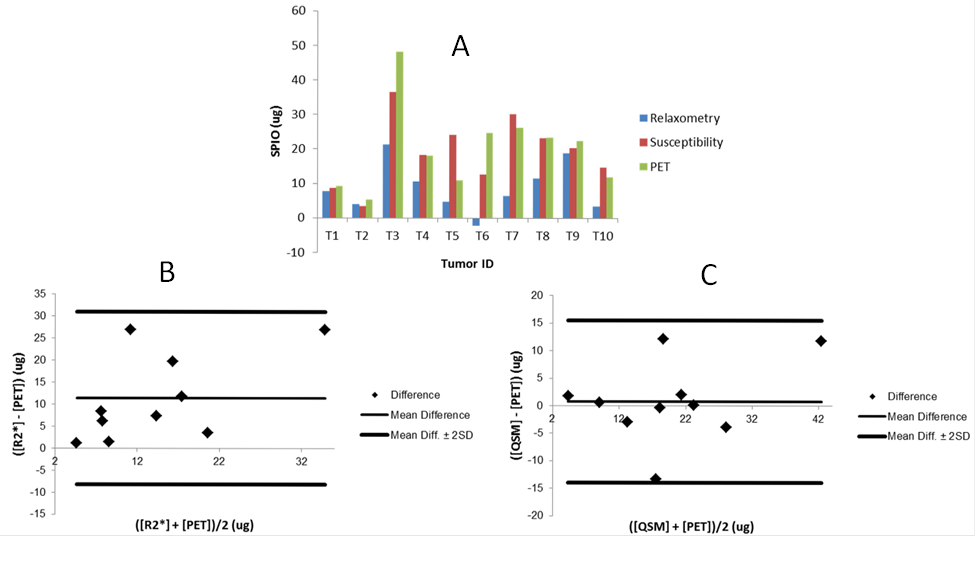
Various amounts (75 to 255 μg) of a dual-modality contrast agent, 89Zr-ferumoxytol, were injected intratumorally into 10 tumor-bearing mice. List-mode PET and multi-echo gradient echo 7 Tesla MRI acquisition were performed sequentially on the mice, 17 hours post-injection. PET data was reconstructed using OSEM3D/MAP algorithm, while MRI gradient echo DICOMs were post-processed in R2* maps using an auto-regressive monoexponential fitting algorithm, ARLO, and into QSM maps by nonlinear voxelwise fitting, phase unwrapping and chemical shift correction and preconditioned total field dipole inversion1-3. PET/CT and MRI images were co-registered in the AMIDE multimodality analysis software4. An ellipsoidal volume of interest (VOI) was described on the PET/CT image and the mean voxel estimates from this VOI for PET, R2* and QSM images were converted to SPIO mass using molar activity, relaxivity and susceptibility values determined previously from a phantom study. A Bland-Altman analysis was performed to assess the agreement SPIO quantification using PET and the two MRI post-processing techniques.Results
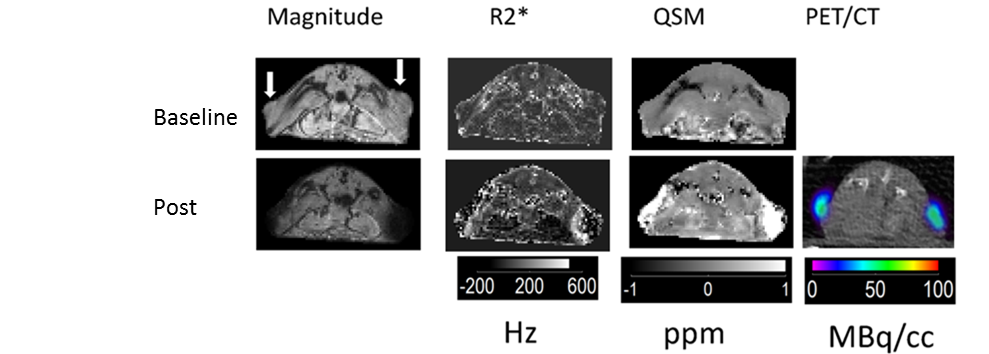
Representative axial views of GRE magnitude, R2*, susceptibility, and PET images are shown in Figure 1. White arrows are drawn on the pre-contrast magnitude image, pointing to the tumor’s location. On post-injection R2* images, the peripheral tumor can be identified by a bright periphery with darkened interior, while on post-injection QSM images, the tumor is identified as a uniformly bright region. The specific activity, relaxivity and susceptibility of 89Zr-ferumoxytol were determined from a phantom study to be 2229 (MBq/cc)(L/g), 1711 Hz (L/g) and 11.7 ppm L/g respectively. Concentration estimates obtained by multiplying these coefficients with the mean VOI values from the respective images showed good agreement between QSM and PET. A Bland-Altman analysis was performed to assess agreement between PET and the two MRI quantification techniques. The plot of the average and difference for each corresponding pair of PET and MRI measurement is shown in Figure 2. The mean percentage difference in estimates of SPIO amount using PET was greater than estimates using R2* by 81% and greater than estimates using QSM by 3.7%.Acknowledgements
We gratefully acknowledge support from the following NIH grants: R01NS072370, R01NS090464, R01NS095562, R01 CA178007 and F31EB019883.References
1. Liu J, Liu T, de Rochefort L, Ledoux J, Khalidov I, Chen W et al. Morphology enabled dipole inversion for quantitative susceptibility mapping using structural consistency between the magnitude image and the susceptibility map. Neuroimage 2012; 59(3): 2560-8.
2. Dong J, Liu T, Chen F, Zhou D, Dimov A, Raj A et al. Simultaneous phase unwrapping and removal of chemical shift (SPURS) using graph cuts: application in quantitative susceptibility mapping. IEEE Trans Med Imaging 2015; 34(2): 531-40.
3.Liu Z, Kee Y, Zhou D, Wang Y, Spincemaille P. Preconditioned total field inversion (TFI) method for quantitative susceptibility mapping. Magn Reson Med 2016.
4.Loening AM, Gambhir SS. AMIDE: a free software tool for multimodality medical image analysis. Mol Imaging 2003; 2(3): 131-7.
Figures