4496
Numerical Model of Bi-Exponential T2 Decay-Based Magnetic Resonance Oximetry Imaging (MOXI).1Radiology, UT Southwestern Medical Center, Dallas, TX, United States
Synopsis
The present work seeks to explore the accuracy and precision of proton MR oximetry imaging (MOXI) in silico. MOXI technique relies on the separation of oxygen sensitive T2Blood from the bi-exponential nature of overall T2 decay. The bi-exponential T2 decay models with Rician distribution noise were numerically generated, simulating the preclinical prostate tumor model experiments. The present in silico study showed the feasibility of the proton based MOXI technique. However, the results suggest that the MOXI technique may lack the accuracy and precision of measuring short T2Blood (< 30 ms), which is essential to measure hypoxia in a tumor.
Purpose
A non-invasive approach to quantitative tumor oximetry was recently presented by Zhang et al.[1] and the current study seeks to explore the accuracy and precision of proton MR oximetry imaging (MOXI) in silico. Zhang et al. demonstrated that T2 decay contains two components: blood and non-blood. The ratio of the two signal intensity components is proportional to perfusion fraction (Fp). The multi-parametric MRI technique enables separation of T2Blood from the bi-exponential decay model. Thus, the local hemoglobin saturation level (SpO2) may be estimated from T2Blood. In this study, bi-exponential T2 decay models with realistic Rician distribution noise were numerically generated, approximating the experimentally obtained apparent T2 (i.e., mono-exponential T2 decay combining both blood and non-blood components) and signal-to-noise-ratio (SNR) using Carr-Purcell-Meiboom-Gill (CPMG) sequence in subcutaneously implanted Dunning-R3327-AT1 prostate tumors and adjacent limb muscles in rats. Accuracy and precision of the MOXI method were evaluated by comparing the ground truth T2Blood with estimated “T2Blood”.Methods
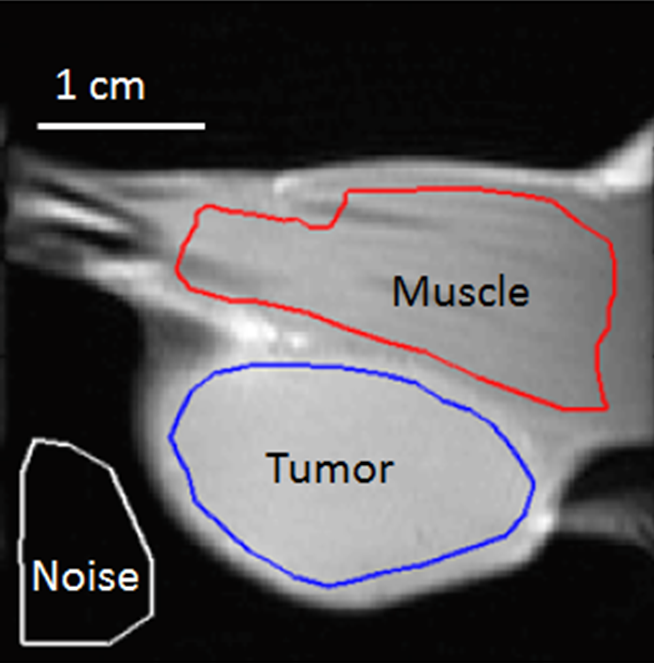
(1) MRI data were collected at 4.7-T. T2 decays in both tumor and muscle regions were measured using a CPMG sequence (TR = 2000 ms, τcp = 10 ms, TE = n × τcp (1 ≤ n ≤ 12), matrix 128 × 64, slice thickness of 2 mm, and field of view of 40 mm × 40 mm). A single slice encompassing the largest cross-section area of tumor was selected (Figure 1). (2) The bi-exponential based T2Blood measurement was tested in silico. A Rician noise was added to bi-exponential model to simulate T2 signal decays with various levels of SNR, Fp, and blood and non-blood components of T2. The models were classified into two groups (tumor and muscle) based on their apparent T2. In the first analysis, true T2nonBlood, S0 (initial transverse magnetization at TE = 0 ms) and Fp were used to extract T2Blood from the model based on an implicit assumption that three input values were known in advance. The non-blood component of T2 decay was subtracted from the overall bi-exponential model and T2Blood was computed from the remainder. Sensitivity analysis was also performed to investigate the impact of slight deviations in T2nonBlood and S0 from their true values on T2Blood estimation. In this analysis, Fp and T2Blood were 0.21 and 20 ms, respectively and two SNR conditions (i.e. with and without Rician noise) were tested.Results
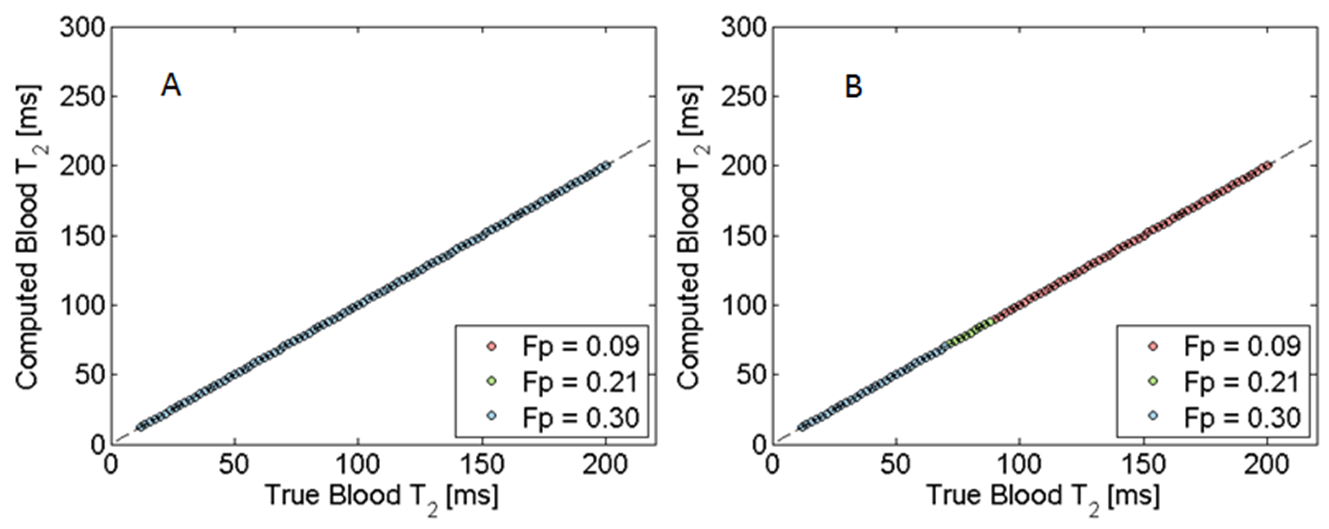
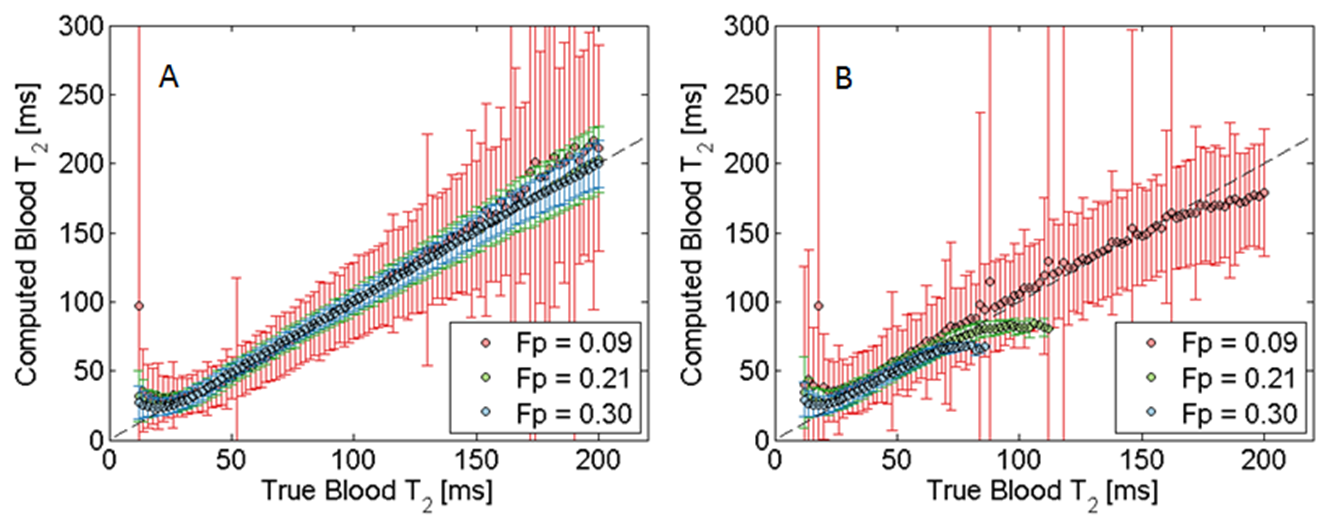
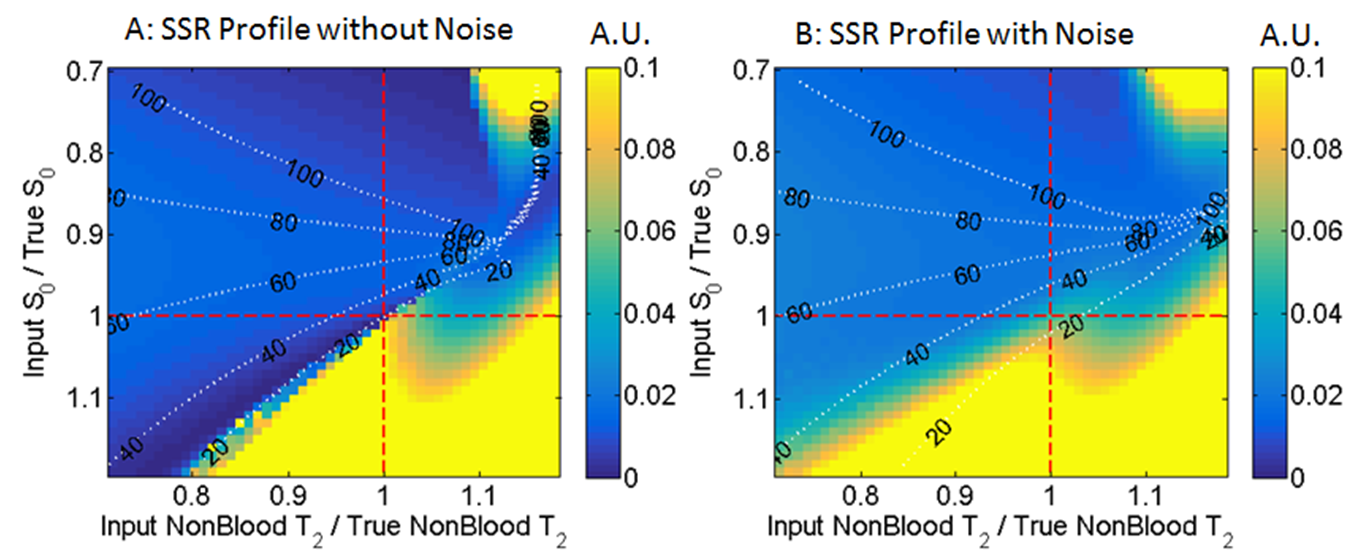
The experimental data showed apparent T2 in tumor and muscle were 79.0 ± 5.6 ms and 32.6 ± 1.2 ms, respectively (mean ± s.d. over six animals). A ratio of S0 to an MRI signal intensity where no object was present (µRayleigh) was used as the metric of SNR. S0/µRayleigh in tumor was 79.9 ± 12.9, while that in muscle was 84.8 ± 18.1. Based on the results, bi-exponential models with Rician noise were generated with the combinations of two apparent T2 conditions (Tumor: 70-90 ms and Muscle 25-45 ms), two SNR conditions (zero noise and S0/µRayleigh of 56-112), and three perfusion fractions (0.09, 0.21, and 0.30). Without noise, the bi-exponential model always attained the true T2Blood (Figure 2). With added noise, the precision of T2Blood measurement worsened (represented by the error-bars in Figure 3). The greater Fp corresponded to the better precision of T2Blood. The estimated T2Blood deviated from its true value in the low T2Blood region (< 30 ms). The results of sensitivity analysis are presented in Figure 4. The color-scale corresponds to sum-of-squared-residuals, where the local minima correspond to the optimal set of T2Blood, T2nonBlood and S0. The local minimum was not found on the set of true input values when the noise was presented (Figure 4B).Discussion
Accuracy and precision of T2Blood estimation largely depended on SNR. Although T2Blood was still accurately computed in the high T2Blood region of tumor, the low T2Blood (< 30 ms) was not accurately estimated even with a-priori information. T2Blood of 30 ms accounts for SpO2 of 0.5 according to both Luz-Meiboom and a weak-field diffusion Jensen-Chandra models[2] estimated at 4.7-T. The sensitivity analysis suggested that the local minimum was not found on the set of true input values when the noise was presented. Hence, T2Blood is likely subject to substantial uncertainty with the realistic level of SNR. It is crucial to improve the accuracy and precision of T2Blood estimation especially in short T2Blood region which is associated with tumor hypoxia.Conclusion
The present in silico study confirmed the feasibility of the proton based MOXI technique. However, the results suggest that the MOXI technique may lack the accuracy and precision of measuring short T2Blood, which is essential to monitor tumor hypoxia.Acknowledgements
GrantsCPRIT: RP140285
NIH: P30 CA142543; EB015908; S10 RR028011
References
[1] : Zhang et al. Magn. Reson. Med. 71:561–569 (2014)
[2] : Gardener et al. Magn. Reson. Med. 64:967–974 (2010)
Figures