4494
On Molecular Aspects of Ktrans and Angiogenesis: Cerebral GliomasCharles S. Springer, Jr.1, Xin Li1, Seymur Gahramanov2, Martin M. Pike1, William D. Rooney1, and Edward A. Neuwelt3
1Advanced Imaging Research Center, Oregon Health & Science University, Portland, OR, United States, 2Neurosurgery, University of New Mexico, Albuquerque, NM, United States, 3Blood Brain Barrier Program, Oregon Health & Science University, Portland, OR, United States
Synopsis
It is often thought that tumor Ktrans value differences correspond to changes in capillary contrast agent (CA) permeability. We show this is not the case for implanted glioma in rat brain. Over an almost eight-fold Ktrans change, the tumor CA extravasation rate constant kpe remains relatively fixed, as if regulated, but at a value greater than normal. The Ktrans changes reflect cerebral blood volume fraction changes.
Introduction:
The most examined biomarker1 in Dynamic-Contrast-Enhanced Magnetic Resonance Imaging (DCE-MRI) is the pharmacokinetic parameter Ktrans, the contrast agent (CA) extravasation transfer constant. Perhaps the prevailing expectation is that Ktrans measures microvascular wall CA “permeability.” By far the most common CAs are monomeric Gd(III) chelates. For these, the Renkin-Crone expression for CA extravasation blood flow-dependence is generally in the permeability limit: Ktrans is essentially equal to the PCA•S product; where PCA is the capillary wall CA permeability coefficient and S is the total vascular surface area per voxel volume.2 Thus, only one Ktrans factor, PCA, actually measures permeability. Another “pure” permeability measure is the unidirectional rate constant for CA extravasation, kpe, which is given by Ktrans/vp or 4PCA/d.3 In these latter expressions, vp is the blood plasma volume fraction and d is the mean capillary diameter. Here, with implanted human U87 glioma in rat brain, we show that Ktrans changes essentially reflect changes in only S, not CA permeability.Methods
Seven male athymic nude rats were anesthetized, and human U87 cells stereotactically injected into the right caudate nucleus. Four to ten weeks later, tumor‑bearing animals were re-anesthetized, and coronal-equivalent DCE-MRI scans of the head were performed at 11.75 T.4 For each animal, a dose of only 50 μmol/kg of GdDTPA-BMA was injected via tail vein catheter.4 The three-slice, fast-gradient-echo DCE-MRI sequence parameters were: TR/TE, 25/1.4 ms, flip angle 20º, slice thickness 1.0 mm, rectangular FOV (4.48 x 2.24) cm2, with a 1.6 s intersampling interval. The nominal voxel size is 1.0 x 0.35 x 0.35 mm3. The data were analyzed with the shutter-speed paradigm pharmacokinetic model assuming three 1H2O signals,5,6 applied in an adaptive (i.e., recursive or successive approximation) manner.4Results
Figure 1 displays coronal-equivalent tumor parametric maps for one rat. A histological slice from the same animal brain, comparable to the DCE image slice (1a) is also shown (1d): the darker brown color shows human mitochondrial staining. Of particular interest are the vb (1c) and Ktrans (1b) maps: vb is the blood volume fraction [often called CBV]. Although these exhibit heterogeneity, the patterns are similar: elevated in the upper left and lower right quadrants. Much vb map noise arises from compromised DCE tumor vb precision when using an extravasating CA:4 the precision is high for normal brain.3 Thus, we averaged Ktrans and vb over the entire tumor evident in the image slice [e.g., <Ktrans>sl] for each of the seven animals. Assuming a microvascular hematocrit of 0.3, we calculated pixel vp values as 0.7 vb. The <Ktrans>sl value divided by <vp>sl gives the <kpe>sl value for each tumor. Figure 2 plots <kpe>sl vs. <Ktrans>sl, for all seven rats. Four-to-ten weeks after tumor seeding, the <Ktrans>sl value [abscissa] varies by almost eight-fold. However, the <kpe>sl value [ordinate] varies by less than two [much due to vp imprecision], and is effectively constant at ~0.04 s-1.Discussion
Since normal brain Ktrans ≈ 10‑5 min-1,7 normal capillary kpe [often called k1 in the tracer literature] is effectively zero on the Fig. 2 ordinate scale (red point). Thus, within the first four to ten weeks of growth, tumor capillaries with kpe ≈ 0.04 s-1 have been established. One possibility is they result from alterations of normal brain capillaries. If so, surely PCA increases during the alteration. Recall kpe is proportional to the PCA/d ratio, and it seems unlikely that the mean capillary diameter d would decrease. More importantly, however, the tumor capillary kpe is so constant over time and animals that it appears regulated. Therefore, the more likely possibility is that the tumor begins by growing new capillaries (angiogenesis) with kpe ≈ 0.04 s-1. As Ktrans increases (say, with tumor size and/or age), it seems to do so by increasing capillary density (increasing S), not by increasing microvessel permeability (PCA): the capillary pore size and density seem fixed. For essentially all DCE‑MRI studies of gliomas and other cancers, the Ktrans responses to therapies (mostly antiangiogenic) are disappointingly qualitatively, and quantitatively, very similar.1 The Ktrans value is essentially always decreased by therapy. Our results suggest this most likely happens by pruning tumor capillary density. Though it is often hoped that Ktrans changes reflect PCA changes, this is likely not the case. The Ktrans biomarker is an ordinary intensive property, while kpe is a supra‑intensive property.3 Precise DCE tumor vb can be mapped with an intravascular CA.3 Combining this with Ktrans from a Gd(III) CA will allow kpe mapping, which could show regional kpe variations. Our results suggest these will be small.Acknowledgements
Grant Support: NIH: UO1-CA154602; R44 CA180425.References
1. O’Connor, Jackson, Parker, Roberts, Jayson, Nat Rev Clin Oncol 9:167-177 (2012). 2. Li, Springer, Jerosch-Herold, NMRB 22:148-157 (2009). 3. Rooney, Li, Sammi, Bourdette, Neuwelt, Springer, NMRB 28:6-7-623 (2015). 4. Li, Rooney, Varallyay, Gahramanov, Muldoon, Goodman, Tagge, Selzer, Pike, Neuwelt, Springer, JMR 206:190-199 (2010). 5. Li, Rooney, Springer, MRM 54:1351-1359 (2005). 6. Li, Priest, Woodward, Siddiqui, Beer, Garzotto, Rooney, Springer, JMR 218:77-85 (2012). 7. Njus, Li, Springer, Taylor, Greisel, Telang, Coyle, Rooney, PISMRM 16:3431 (2008).Figures
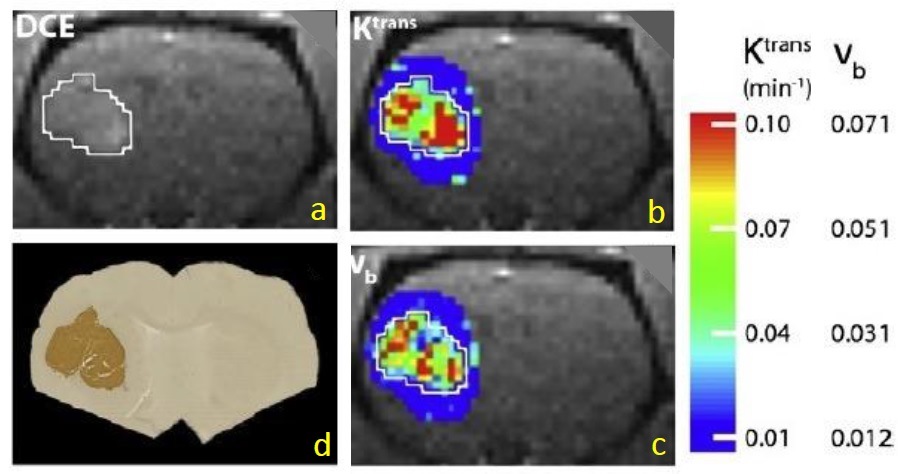
Figure 1. a) DCE coronal-equivalent rat
image: the left brain U87 tumor ROI within white border. b),
c) the tumor Ktrans and vb
parametric maps, respectively (color bar scales). Tumor vb is elevated from surrounding
brain parenchyma. d) human mitochondria staining (darker brown) of a histological
slice comparable to a).
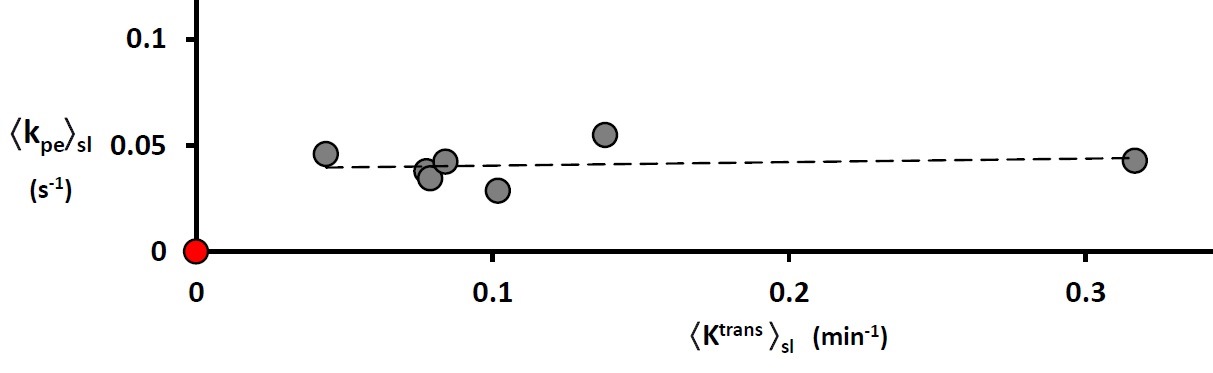
Figure 2. The value of slice-averaged kpe [≡ Ktrans/vp] is independent of
slice-averaged Ktrans for each of the seven animals. It seems regulated, but at a value greater
than for normal brain capillaries (red point).