4486
Multiparametric MRI for optimal prostate cancer detection in TRAMP mice1Department of Circulation and Medical Imaging, NTNU - Norwegian University of Science and Technology, Trondheim, Norway, 2Diagnostics, Imaging and Biomedical Technologies, GE Global Research Center, Niskayuna, NY, United States, 3GE Healthcare AS, Oslo, Norway, 4Department of Biomedicine, University of Bergen, Bergen, Norway
Synopsis
Multiparametric MRI is the standard for the detection and characterization of prostate cancer. In this study we compared the diagnostic value of clinically used DW-MRI and DCE-MRI in a transgenic mouse model of prostate cancer (TRAMP). Additionally, we investigated the potential utility of SSC-MRI using a USPIOs contrast agent for prostate cancer detection. The results of this study confirm the utility of DW-MRI and the potential value of DCE-MRI in early-stage detection and monitoring of prostate cancer. SSC-MRI appears to be less useful for this task in the TRAMP model, but further analysis is required to draw a clear conclusion.
Introduction
Multiparametric MRI is a promising tool for prostate cancer diagnosis and characterization. According to the current PI-RADS guidelines 1, T2w and diffusion weighted imaging (DW-MRI) are the most important imaging techniques for prostate cancer. Dynamic contrast-enhanced (DCE)-MRI is also usually acquired, and it typically plays a supporting role for the detection of peripheral zone lesions. Contrast-enhanced MRI using ultrasmall superparamagnetic iron oxide particles (USPIOs) has demonstrated potential for detection of metastatic lymph nodes 2 and for vascular characterization of solid tumors 3. The aims of this study were to compare the diagnostic accuracy of DW-MRI and DCE-MRI in a transgenic model of prostate cancer, and to investigate whether steady-state susceptibility contrast (SSC)-MRI using USPIOs can be used for detection of primary prostate cancer and potentially replace DCE-MRI in multiparametric protocols.Methods
TRAMP mice (n=11) were imaged with MRI between the age of 22 to 34 weeks. At the stage of abstract submission, five of the eleven prostates have been analyzed. MRI was performed on a 7T Bruker scanner with a 72-mm transmit-only volume coil and a planar surface coil with a diameter of 20mm for reception. Since two contrast agent injections were required for this study, we performed two sets of scans on separate days. On day 1, we acquired high resolution T2w images, diffusion weighted (DW) images, T1 maps and a series of DCE-images with an injection of 0.1mmol/kg Dotarem (Guerbet) after the 10th baseline scan. On day 3, we repeated the same high resolution T2w, DW and T1 map protocols and added T2 maps and T2* maps. The T1, T2 and T2* maps were repeated after injection of 5mg/kg iron oxides GEH121333 (GE Global Research, Niskayuna, NY, USA, supplied through GE Healthcare AS, Oslo, Norway). Sequence details are given in Table 1.
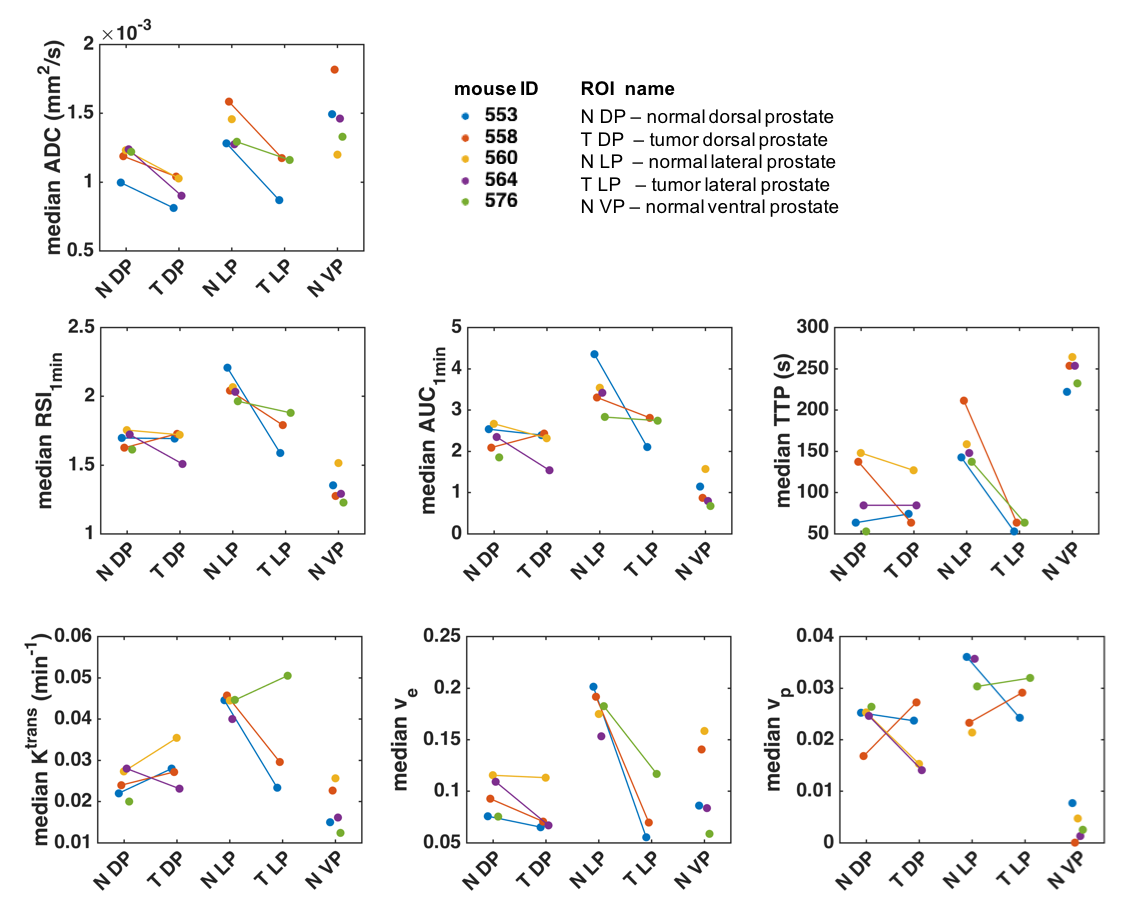
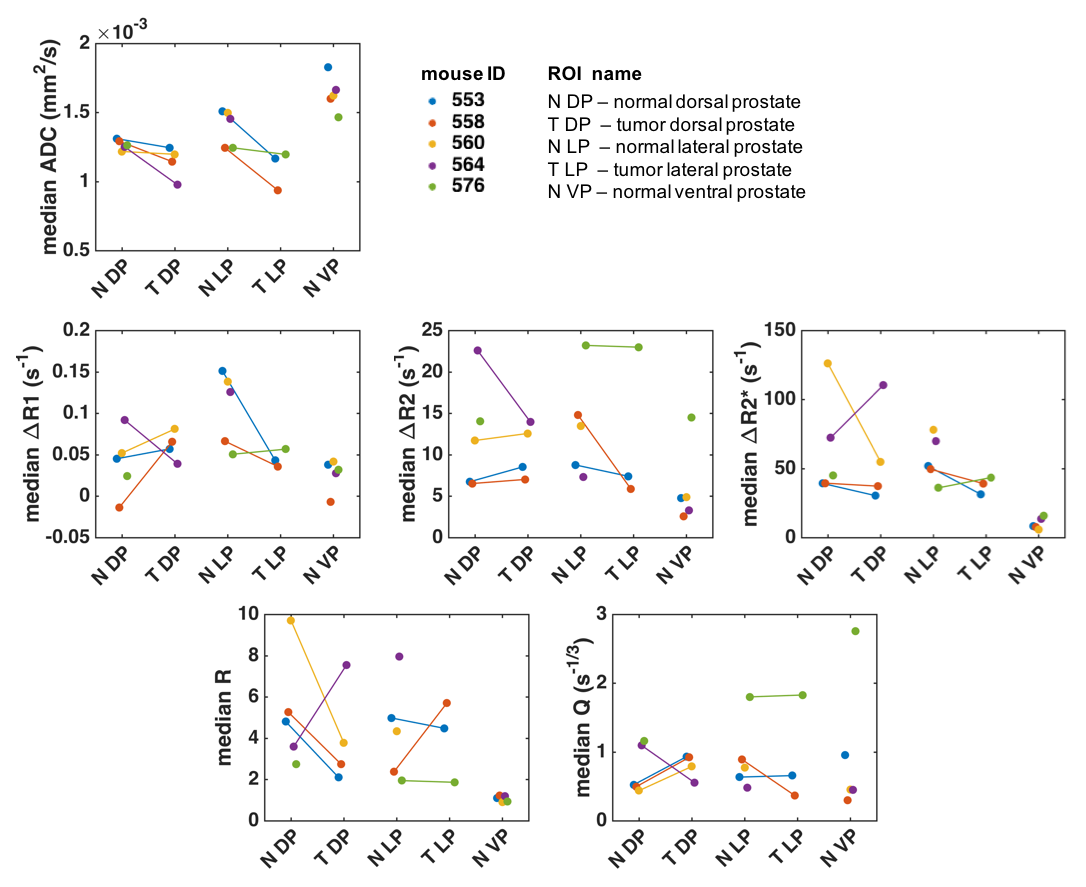
After imaging, the genitourinary tract was excised, formalin-fixed and sectioned into 4µm thick sections, which were HES stained. DW images were used to identify regions of cancer from normal prostate 4, and ROIs of tumor and normal TRAMP prostate regions were drawn in the T2w images; histology images were matched to MRI for validation (Figure 1). Finally, the ROIs were downsampled to match the resolution of the other imaging sequences. Apparent diffusion coefficient (ADC) maps were computed from the DW images. From the DCE-MRI, we computed the semi-quantitative parameters ‘area under the enhancement curve in the first minute’ (AUC1min), ‘relative signal intensity after one minute’ (RSI1min), and ‘time to peak enhancement’ (TTP); and the Tofts parameters ‘volume transfer constant’ (Ktrans), ‘extravascular-extracellular volume fraction' (ve), and ‘plasma volume fraction’ (vp). From the SSC-MRI, we computed the change in relaxation rates ∆R1, ∆R2 and ∆R2*. Estimates of blood vessel density (Q) and size (R) were calculated according to Q= ΔR2/ (ΔR2*)2/3 5 and R= ΔR2*/ ΔR2 6.
Results
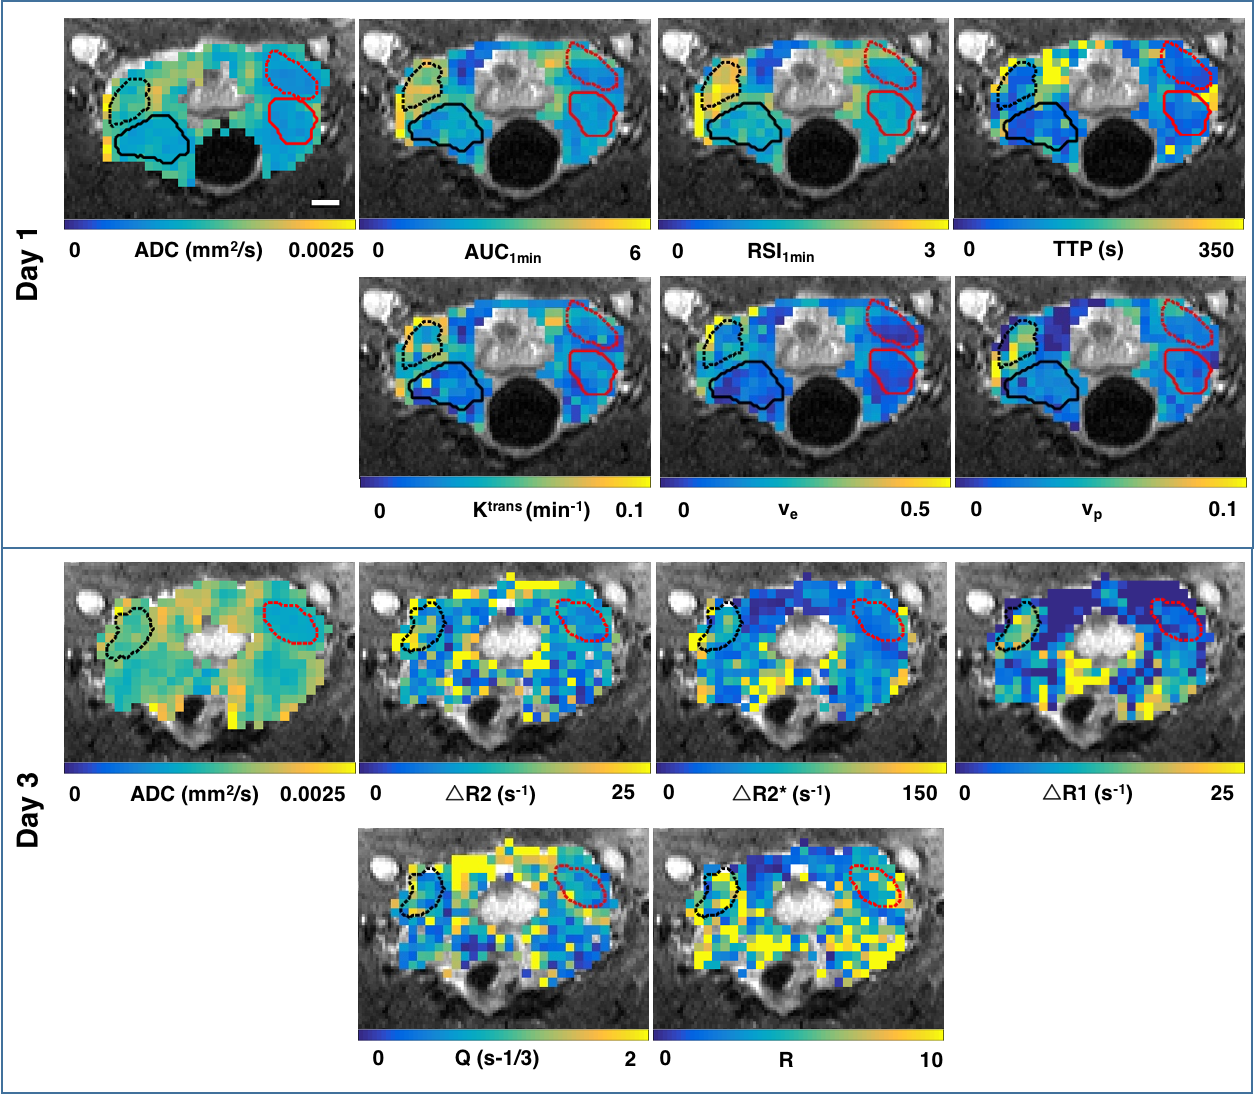
Histology confirmed the presence of well-differentiated prostate cancer in locations corresponding to the ROIs drawn in the MR images (Figure 1). The tumor ROIs showed lower ADC compared to normal TRAMP prostate (Figures 1-4), in accordance with the ROI selection and previously reported ADC values [4]. For DCE-MRI the parameters RSI1min, AUC1min, TTP and ve showed lower values for cancerous compared to normal tissue, but mostly for the lateral prostate (Figure 2). None of the SSC-MRI parameters showed differences between tumor and normal TRAMP prostate (Figure 3). Overall, the prostates were very heterogeneous with respect to all parameters (Figure 4). The ventral prostates did not exhibit tumors and were poorly perfused and/or vascularized (Figures 2,3).Discussion
All tumors were located in the lateral or dorsal prostate lobes, which resemble the peripheral zone in the human prostate where most cancers occur 7. Differences between normal TRAMP prostate and tumors were more pronounced in the lateral prostate than in the dorsal prostate. This may be caused by the more widespread malignant appearance of the dorsal prostate, in which it was difficult to define normal TRAMP ROIs. The animals imaged in this study developed well-differentiated prostate cancer corresponding to low-grade prostate cancer in humans. Patients with low grade prostate cancer may not receive treatment, but are referred to active surveillance until evidence that the patient is at increased risk for disease progression and needs treatment. The results of this study confirm the utility of DW-MRI and the potential value of DCE-MRI in early-stage detection and monitoring of prostate cancer. Preliminary results do not suggest that SSC-MRI can be used instead of DCE-MRI for the detection of prostate lesions. Analysis of the remaining datasets is required for a conclusive comparison of the different MRI techniques.Acknowledgements
We thank Nils Hagen (NTNU) for taking care of the TRAMP colony, Ingunn Nervik (NTNU) for help with histology and Brian Bales2, Bruce Hay2 and Ingrid Henriksen2 for the synthesis, formulation and characterization of GEH121333.References
1. Barentsz JO, Weinreb JC, Verma S, et al. Synopsis of the PI-RADS v2 Guidelines for Multiparametric Prostate Magnetic Resonance Imaging and Recommendations for Use. Eur Urol. 2016;69(1):41-9.
2. Sankineni S, Brown AM, Fascelli M, et al. Lymph Node Staging in Prostate Cancer. Curr Urol Rep. 2015;16(5):30.
3. Fredrickson J, Serkova NJ, Wyatt SK, et al. Clinical translation of ferumoxytol-based vessel size imaging (VSI): Feasibility in a phase I oncology clinical trial population. Magn Reson Med. 2016 [Epub ahead of print].
4. Hill DK, Kim EK, Teruel JR, et al. Diffusion-weighted MRI for early detection and characterization of prostate cancer in the transgenic adenocarcinoma of the mouse prostate model. J Magn Reson Imaging. 2016;43(5):1207-17.
5. Jensen JH, Chandra R. MR imaging of microvasculature. Magn Reson Med. 2000;44: 224-30.
6. Dennie J, Mandeville JB, Boxerman JL, et al. NMR imaging of changes in vascular morphology due to tumor angiogenesis. Magn Reson Med. 1998;40: 793-9.
7. Oliveira DS, Dzinic S, Bonfil AI, et al. The mouse prostate: a basic anatomical and histological guideline. Bosn J Basic Med Sci. 2016;16(1):8-13.
Figures
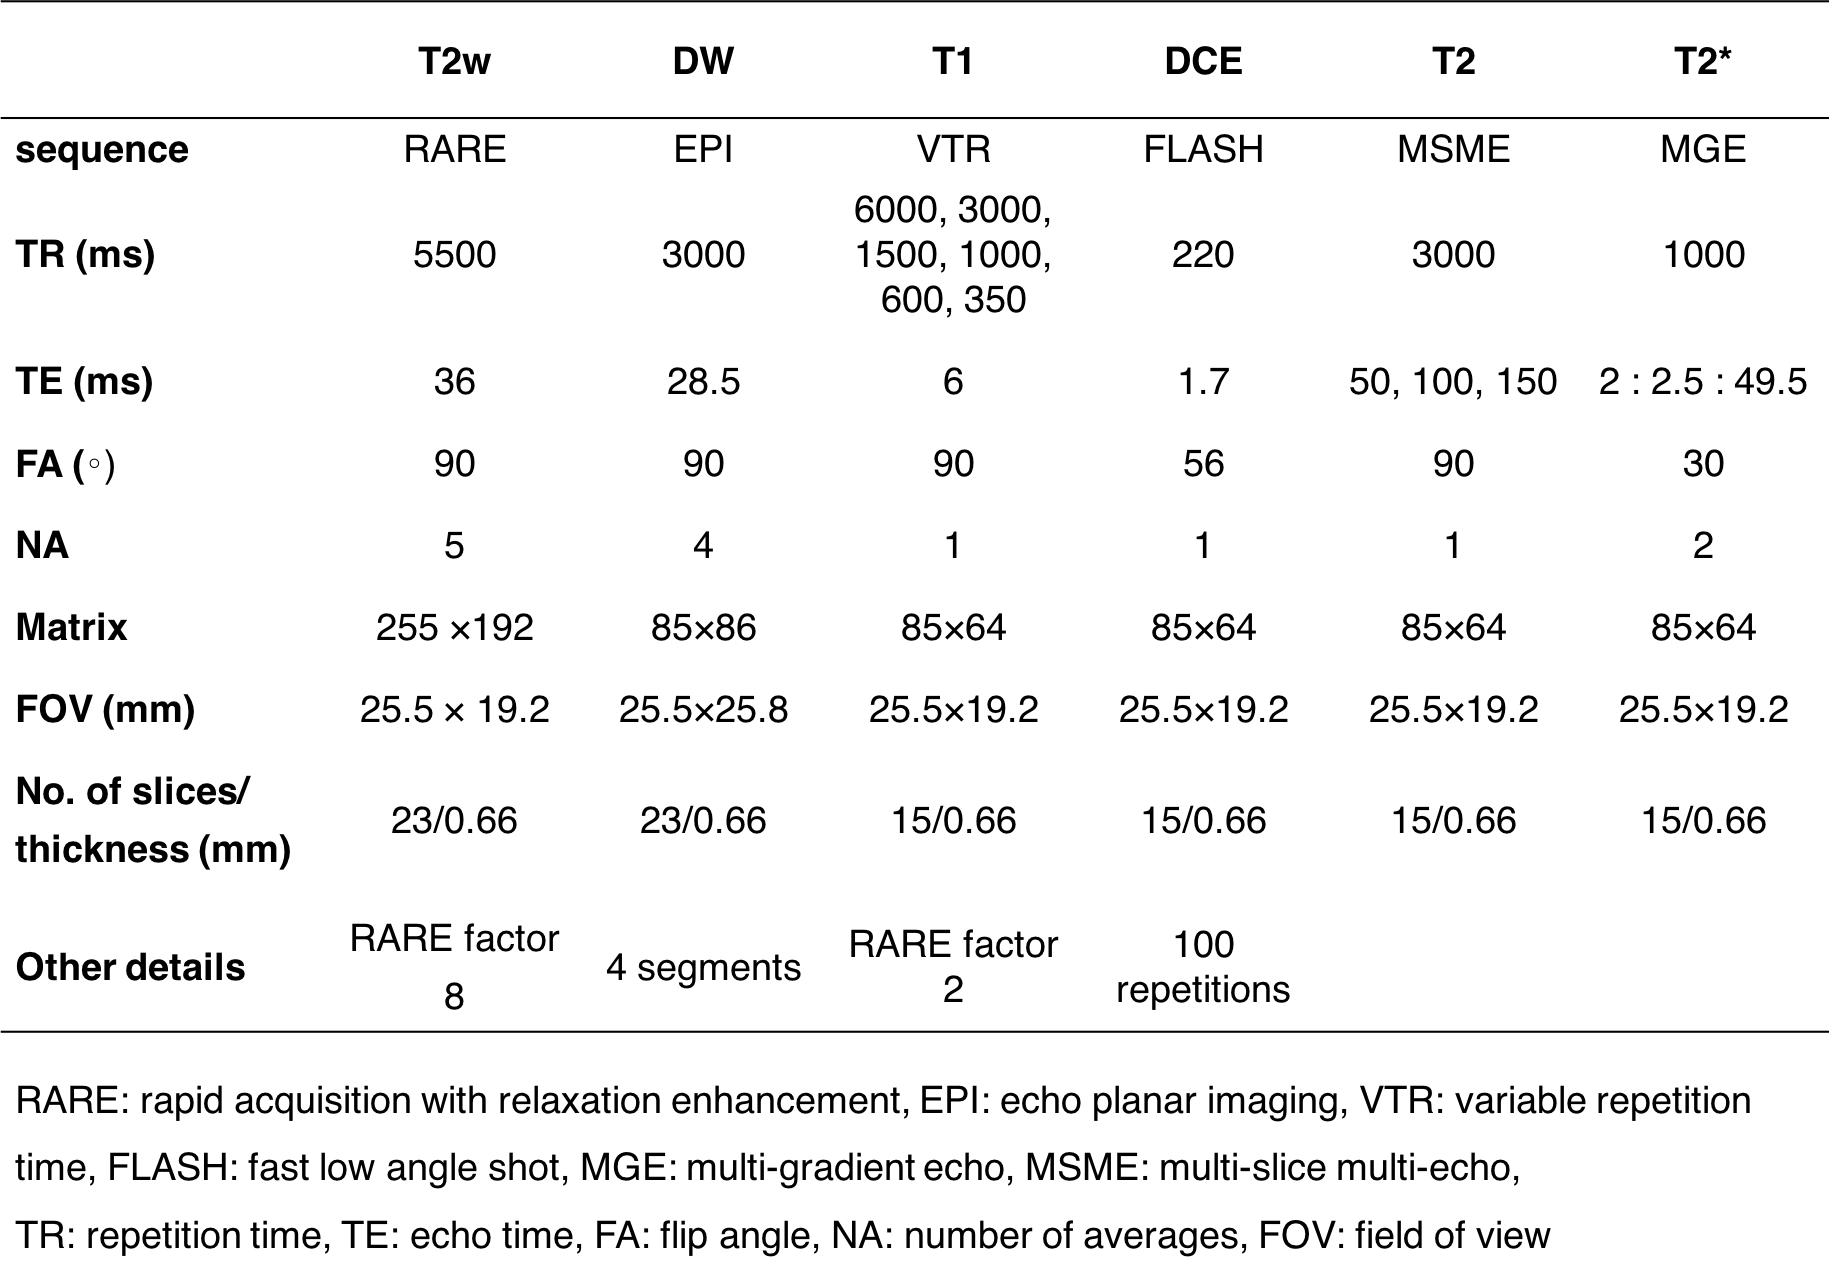
Table 1. MRI sequence parameters.
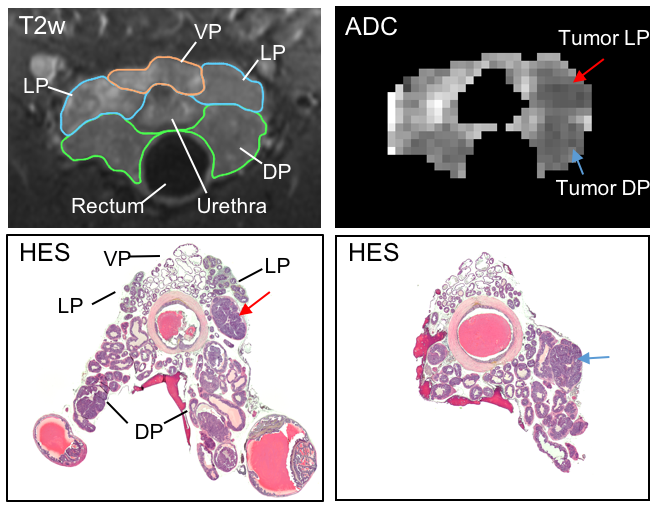
Figure 1. First row: High resolution T2w images ( mouse ID 553) with outlines of the ventral prostate (VP - orange), lateral prostate (LP - blue) and dorsal prostate (DP – green) and ADC map of the prostate with low ADC regions indicating presence of tumors (red and blue arrows). Second row: HES stained tumor sections where tumors matching the DW data are indicated with red and blue arrows. Note that the orientation of the histology does not completely match the MRI, so the dorsal and lateral tumors are not in the same section.