4483
Multi-agent dynamic contrast enhanced MRI to assess vascular changes induced by prolonged VEGFR2 inhibition in oesophageal cancer1Medical Oncology, Academic Medical Center, Amsterdam, Netherlands, 2LEXOR, Academic Medical Center, Amsterdam, Netherlands, 3Advanced Imaging Research Center, Oregon Health & Science University, Portland, OH, United States, 4Utah Center for Advanced Imaging Research, University of Utah, Salt Lake City, UT, 5Biomedical NMR, Department of Biomedical Engineering, Eindhoven University of Technology, Eindhoven, Netherlands, 6Radiology, Academic Medical Center, Amsterdam, Netherlands, 7Biomedical Engineering and Physics, Academic Medical Center, Amsterdam, Netherlands
Synopsis
The effective vascular changes induced by prolonged VEGFR2 inhibition and the resulting changes in vascular function are difficult to monitor in vivo and therefore largely unexplored. In this study we show a multi-agent DCE-MRI approach, using 3 different-sized contrast agents, to quantify effects on vascularization induced by prolonged VEGFR2 inhibition in an oesophageal cancer mouse model. Effects on vascularization were predominantly observed in parameters dependent on the larger-sized contrast agents, where no effects where found for the traditional low-molecular weight contrast agent.
Purpose
Chronic inhibition of vascular endothelial growth factor 2 (VEGFR2) has shown a survival benefit in patients with oesophagogastric cancer.1 However, the effective vascular changes induced by prolonged VEGFR2 inhibition and the resulting changes in vascular function are difficult to monitor in vivo and therefore largely unknown. In this study we performed multi-agent dynamic contrast enhanced (DCE) MRI with 3 different-sized contrast agents to obtain insights in the changes in vascular functionality in the tumor after long term inhibition of VEGFR2 in an oesophageal cancer mouse model.Methods
Ten athymic nude mice were injected subcutaneously on the right hind limb with primary human oesophageal cancer cells. Therapy started when the tumor reached 50-100 mm3 in size and 40 mg/kg of VEGFR2 inhibitor DC101 (n=5) or PBS (n=5) for controls was administered i.p. twice a week. MRI was performed after four weeks of treatment or until the tumor reached the maximum size of ~1000 mm3.
MRI was performed with a 7T Bruker BioSpec 70/30. Imaging comprised a T2-weighted sequence for anatomical reference, B1 mapping based on the 180° signal-null method2 and pre-contrast T1 mapping using a variable flip angle approach. Multi-agent DCE-MRI3 was performed using an RF-spoiled 3D FLASH sequence: TR = 1.38ms, TE = 0.69ms, FA = 15°, acquisition matrix = 50x39x14 (reconstructed to 75x75x16), FOV = 30x30x24mm3 , temporal resolution = 0.82s, total scan time = 10min.
Three different-sized contrast agents were used; modified poly(propylene imine) (PPI) dendrimers of generation 5 (G5-PPI-(PEG6-GdDOTA)64) and 2 (G2-PPI-(PEG6-GdDOTA)8) (SyMO-Chem BV, Eindhoven, The Netherlands) and Gd-DOTA (Dotarem, Guerbet, Villepinte, France), with molecular weights of 59517, 7317, and 754 Da, respectively. Contrast agents (0.1 mmol Gd/kg) were injected at 1 (G5 dendrimer), 4 (G2 dendrimer) and 7 (Gd-DOTA) minutes after start of the acquisition, at a rate of 2 mL/min using an infusion pump. ΔR1 values were calculated, using the B1-corrected pre-contrast T1 values and dynamic signal intensities followed by correction for contrast agent relaxivity, measured in mouse plasma at 7T at 37°C.
Arterial input functions were determined using the Monte Carlo Blind Estimation algorithm.4 Multi-agent data were simultaneously fit with the gamma capillary transit time (GCTT) model.5,6 Fractional blood volume (vb), mean capillary transit time (tc), vascular heterogeneity index (α-1), interstitial space volume fraction (ve) and delay time between contrast agent injection and bolus arrival in the tumor (td) were constrained to be identical between the boluses, while the extraction fraction (E) was separately assessed for each agent. Blood flow (F) $$$F=\frac{v_{b}}{t_{c}}$$$, transfer constant (Ktrans) $$$K^{trans}=E\cdot F$$$, and permeability surface area product (PS) $$$PS=-F\cdot\log\left(1-E\right)$$$ were calculated from the resulting fit parameters.
Median tracer-kinetic parameters were calculated per mouse for tumor voxels with a reliable fit (r2>0.75). Group median ± median absolute difference, control vs treated, were compared using Mood’s median test using chi-squared analysis considering p<0.05 statistically significant.
Results
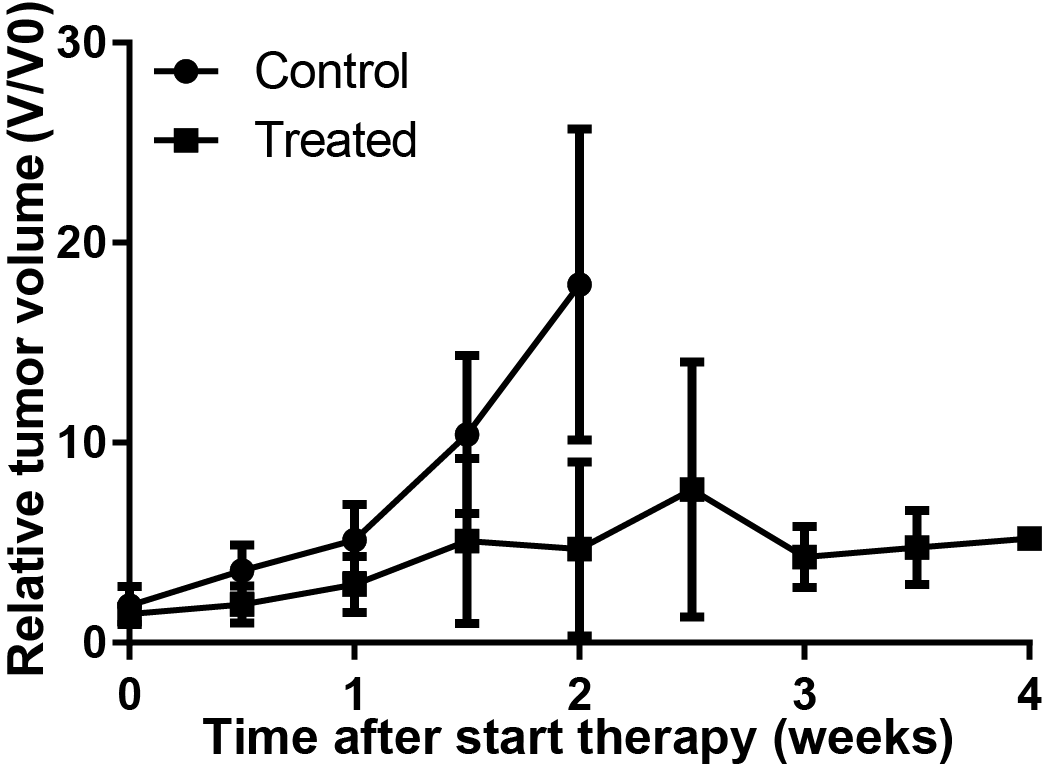
Mice treated with DC101 showed delayed tumor growth, resulting in longer time until MRI compared to controls (Figure 1).
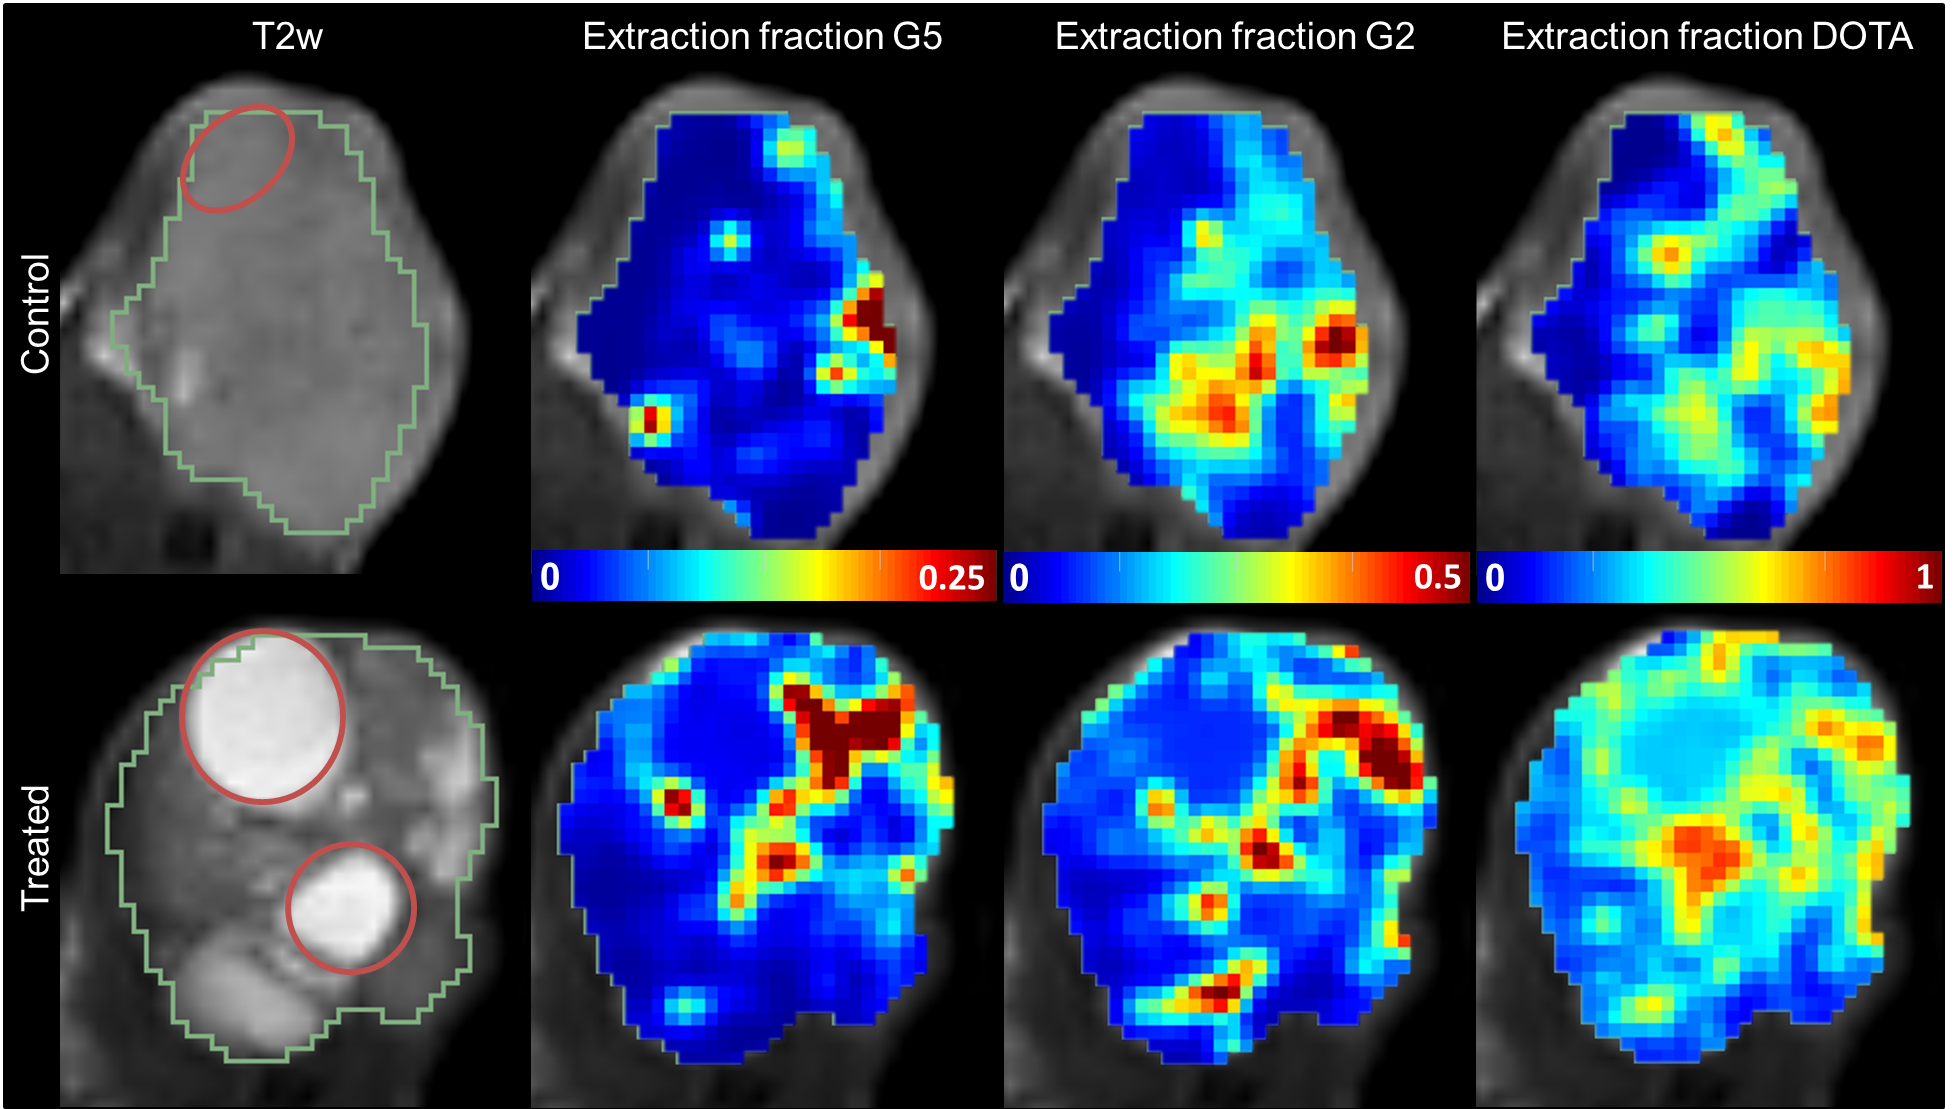
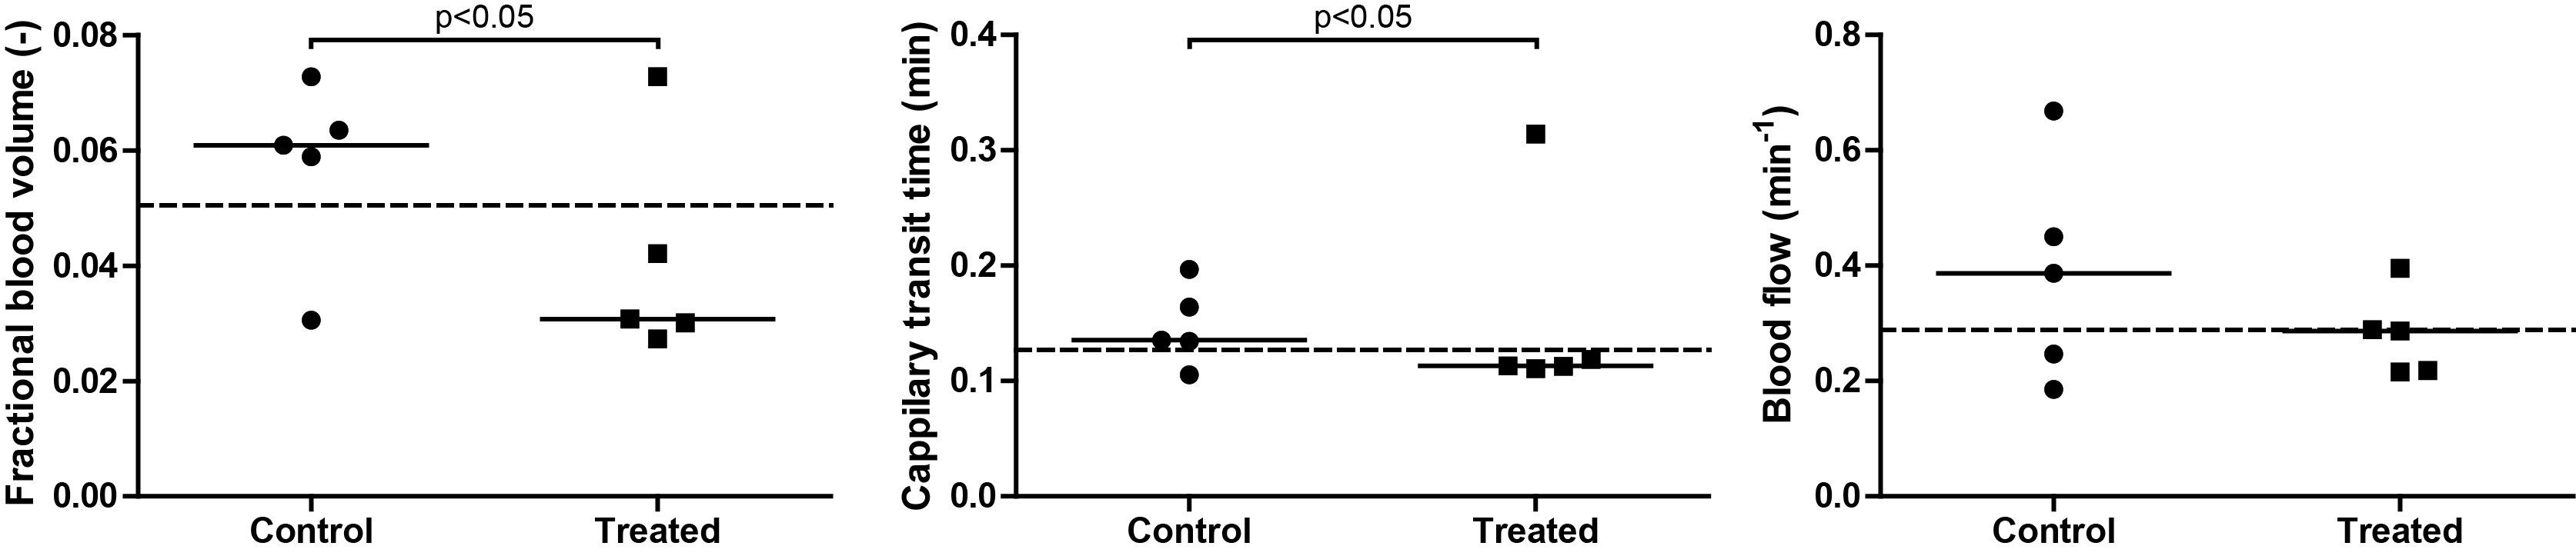
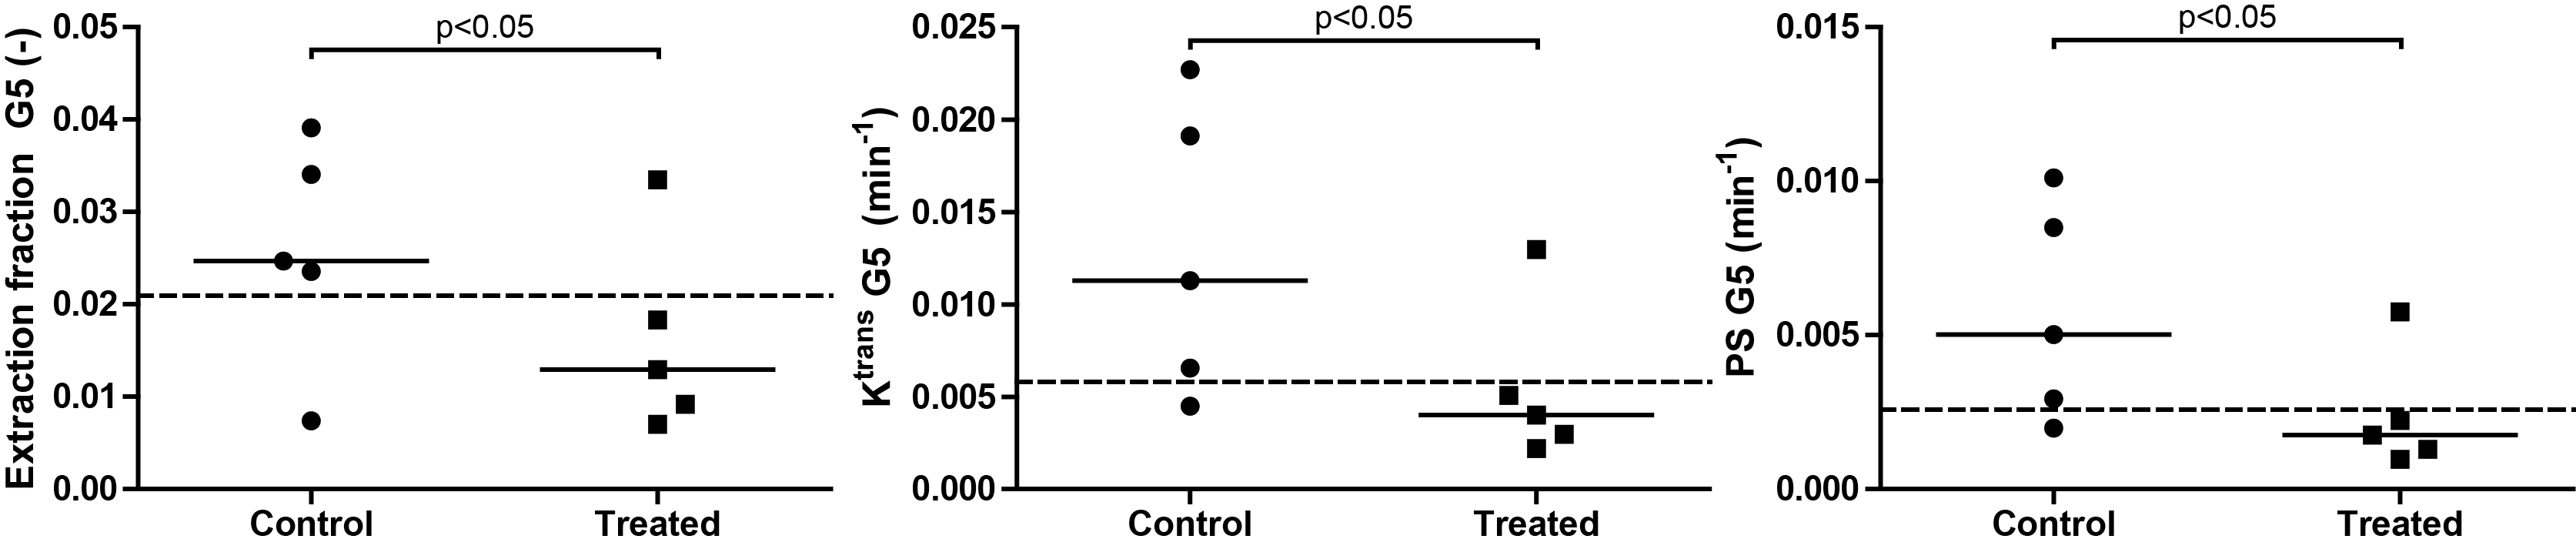
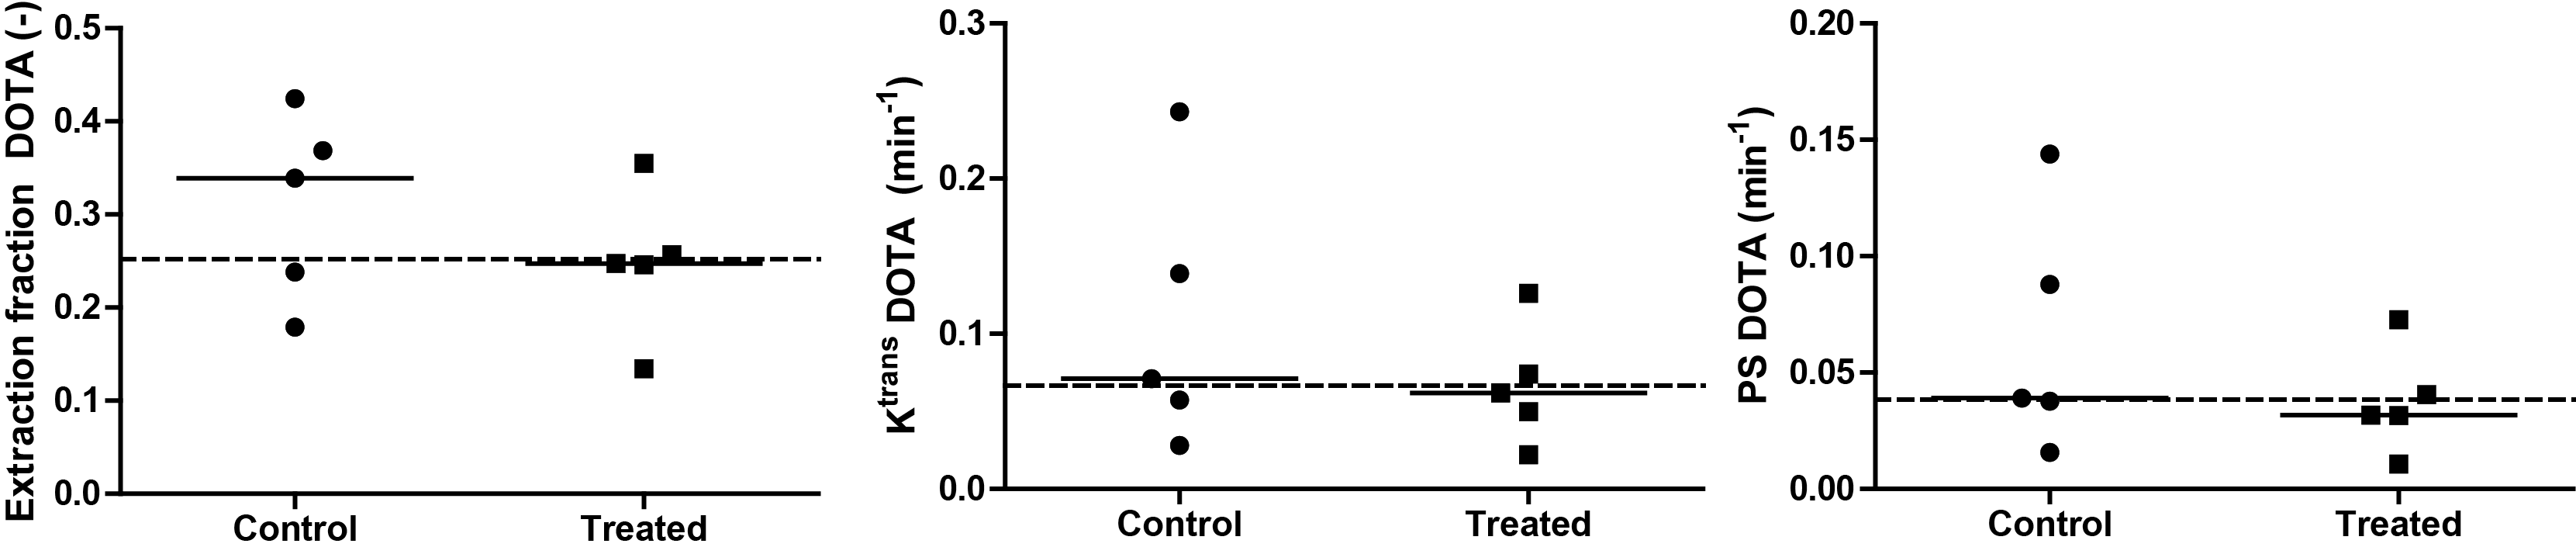
Figure 2 shows a typical result of the different extraction fractions in a treated and control mouse. Blood volume, vb (0.061±0.003 vs 0.031±0.003, p<0.05) and capillary transit time tc (0.14±0.03 vs 0.11±0.002 min, p<0.05) were lower in 4 out of 5 treated mice compared to controls, resulting in overall slightly lower perfusion F (0.39±0.14 vs 0.29±0.07 min-1, p=0.36). Most prominent differences in vascular parameters were observed in G5 related permeability parameters and are summarized in Figure 3. In the treated group; E_G5 (0.024±0.009 vs 0.012±0.005, p<0.05) Ktrans_G5 (0.011±0.007 vs. 0.004±0.001 min-1, p<0.05), PS_G5 (0.005±0.003 vs 0.001±0.0004 min-1, p<0.05) were lower compared to controls. In contrast, the Gd-DOTA derived parameters were close to equal between the groups (Figure 5).
Discussion & Conclusion
We have measured functional vascular changes induced by VEGFR2 inhibition. First results show lower fractional blood volume and reduced permeability for larger agents after prolonged VEGFR2 inhibition. Additional analysis will have to show how these findings relate to the underlying pathophysiological changes in the tissue and the implications of these findings on treatment delivery of combination treatments.Acknowledgements
DC101 was kindly provided by Eli Lilly and CompanyReferences
1. Wilke, H. et al. Ramucirumab plus paclitaxel versus placebo plus paclitaxel in patients with previously treated advanced gastric or gastro-oesophageal junction adenocarcinoma (RAINBOW): a double-blind, randomised phase 3 trial. Lancet Oncol. 15, 1224–1235 (2014).
2. Dowell, N. G. & Tofts, P. S. Fast, accurate, and precise mapping of the RF field in vivo using the 180° signal null. Magn. Reson. Med. 58, 622–630 (2007).
3. Jacobs, I., Hectors, S., Strijkers, G., Nicolay, K. & Schabel, M. Constrained multi-agent tracer-kinetic modeling to assess tumor vascular changes induced by DMXAA treatment. Proc. Intl. Soc. Mag. Reson. Med. 23 3856 (2015).
4. Schabel, M. C., Fluckiger, J. U. & DiBella, E. V. R. A model-constrained Monte Carlo method for blind arterial input function estimation in dynamic contrast-enhanced MRI: I. Simulations. Phys. Med. Biol. 55, 4783–806 (2010).
5. Schabel, M. C. A unified impulse response model for DCE-MRI. Magn. Reson. Med. 68, 1632–1646 (2012).
6. Jacobs, I. et al. A novel approach to tracer-kinetic modeling for (macromolecular) dynamic contrast-enhanced MRI. Magn. Reson. Med. 1153, 1142–1153 (2015).
Figures