4482
In vivo hyperpolarized [1-13C]pyruvate and [18F]-FDG PET/CT studies of prostate cancer metastasis xenografts in mice1Radiology and Nuclear Medicine, Radboud University Medical Center, Nijmegen, Netherlands
Synopsis
Understanding the underlying mechanisms of aggressiveness is important for better staging and treatment of prostate cancer. In this study two murine xenograft models of early and late stage prostate cancer were investigated. [1-13C]pyruvate was hyperpolarized by Dynamic Nuclear Polarization (DNP) and pyruvate metabolism is followed by 13C-MR. This is combined with [18F]FDG-PET/CT to study glucose metabolism. We found differences in pyruvate conversion and glucose uptake in vivo in the murine models.
Introduction
Prostate cancer metastasis cell lines LNCaP and PC3 are thought to represent low aggressive and high aggressive prostate cancer phenotypes, respectively.[1][2] Understanding the underlying mechanisms of aggressiveness is important for better staging and treatment of tumors. An important factor in cancer development is the change in energy metabolism. Goal of this study is to investigate the in vivo energy metabolism of LNCaP and PC3 xenografts using dissolution Dynamic Nuclear Polarization (DNP) MR[3] and [18F]FDG-PET. DNP hyperpolarization in MR can increase SNR with a factor 104, allowing single-shot detection of metabolites in vivo.[4] This technique can be used to dynamically monitor pyruvate to lactate conversion by Lactate Dehydrogenase (LDH) in tumors in vivo, while [18F]FDG-PET measures the uptake of 2-deoxy-2-[18F]fluoro-D-glucose in the tumor as a measure of glucose metabolism.[5]Methods
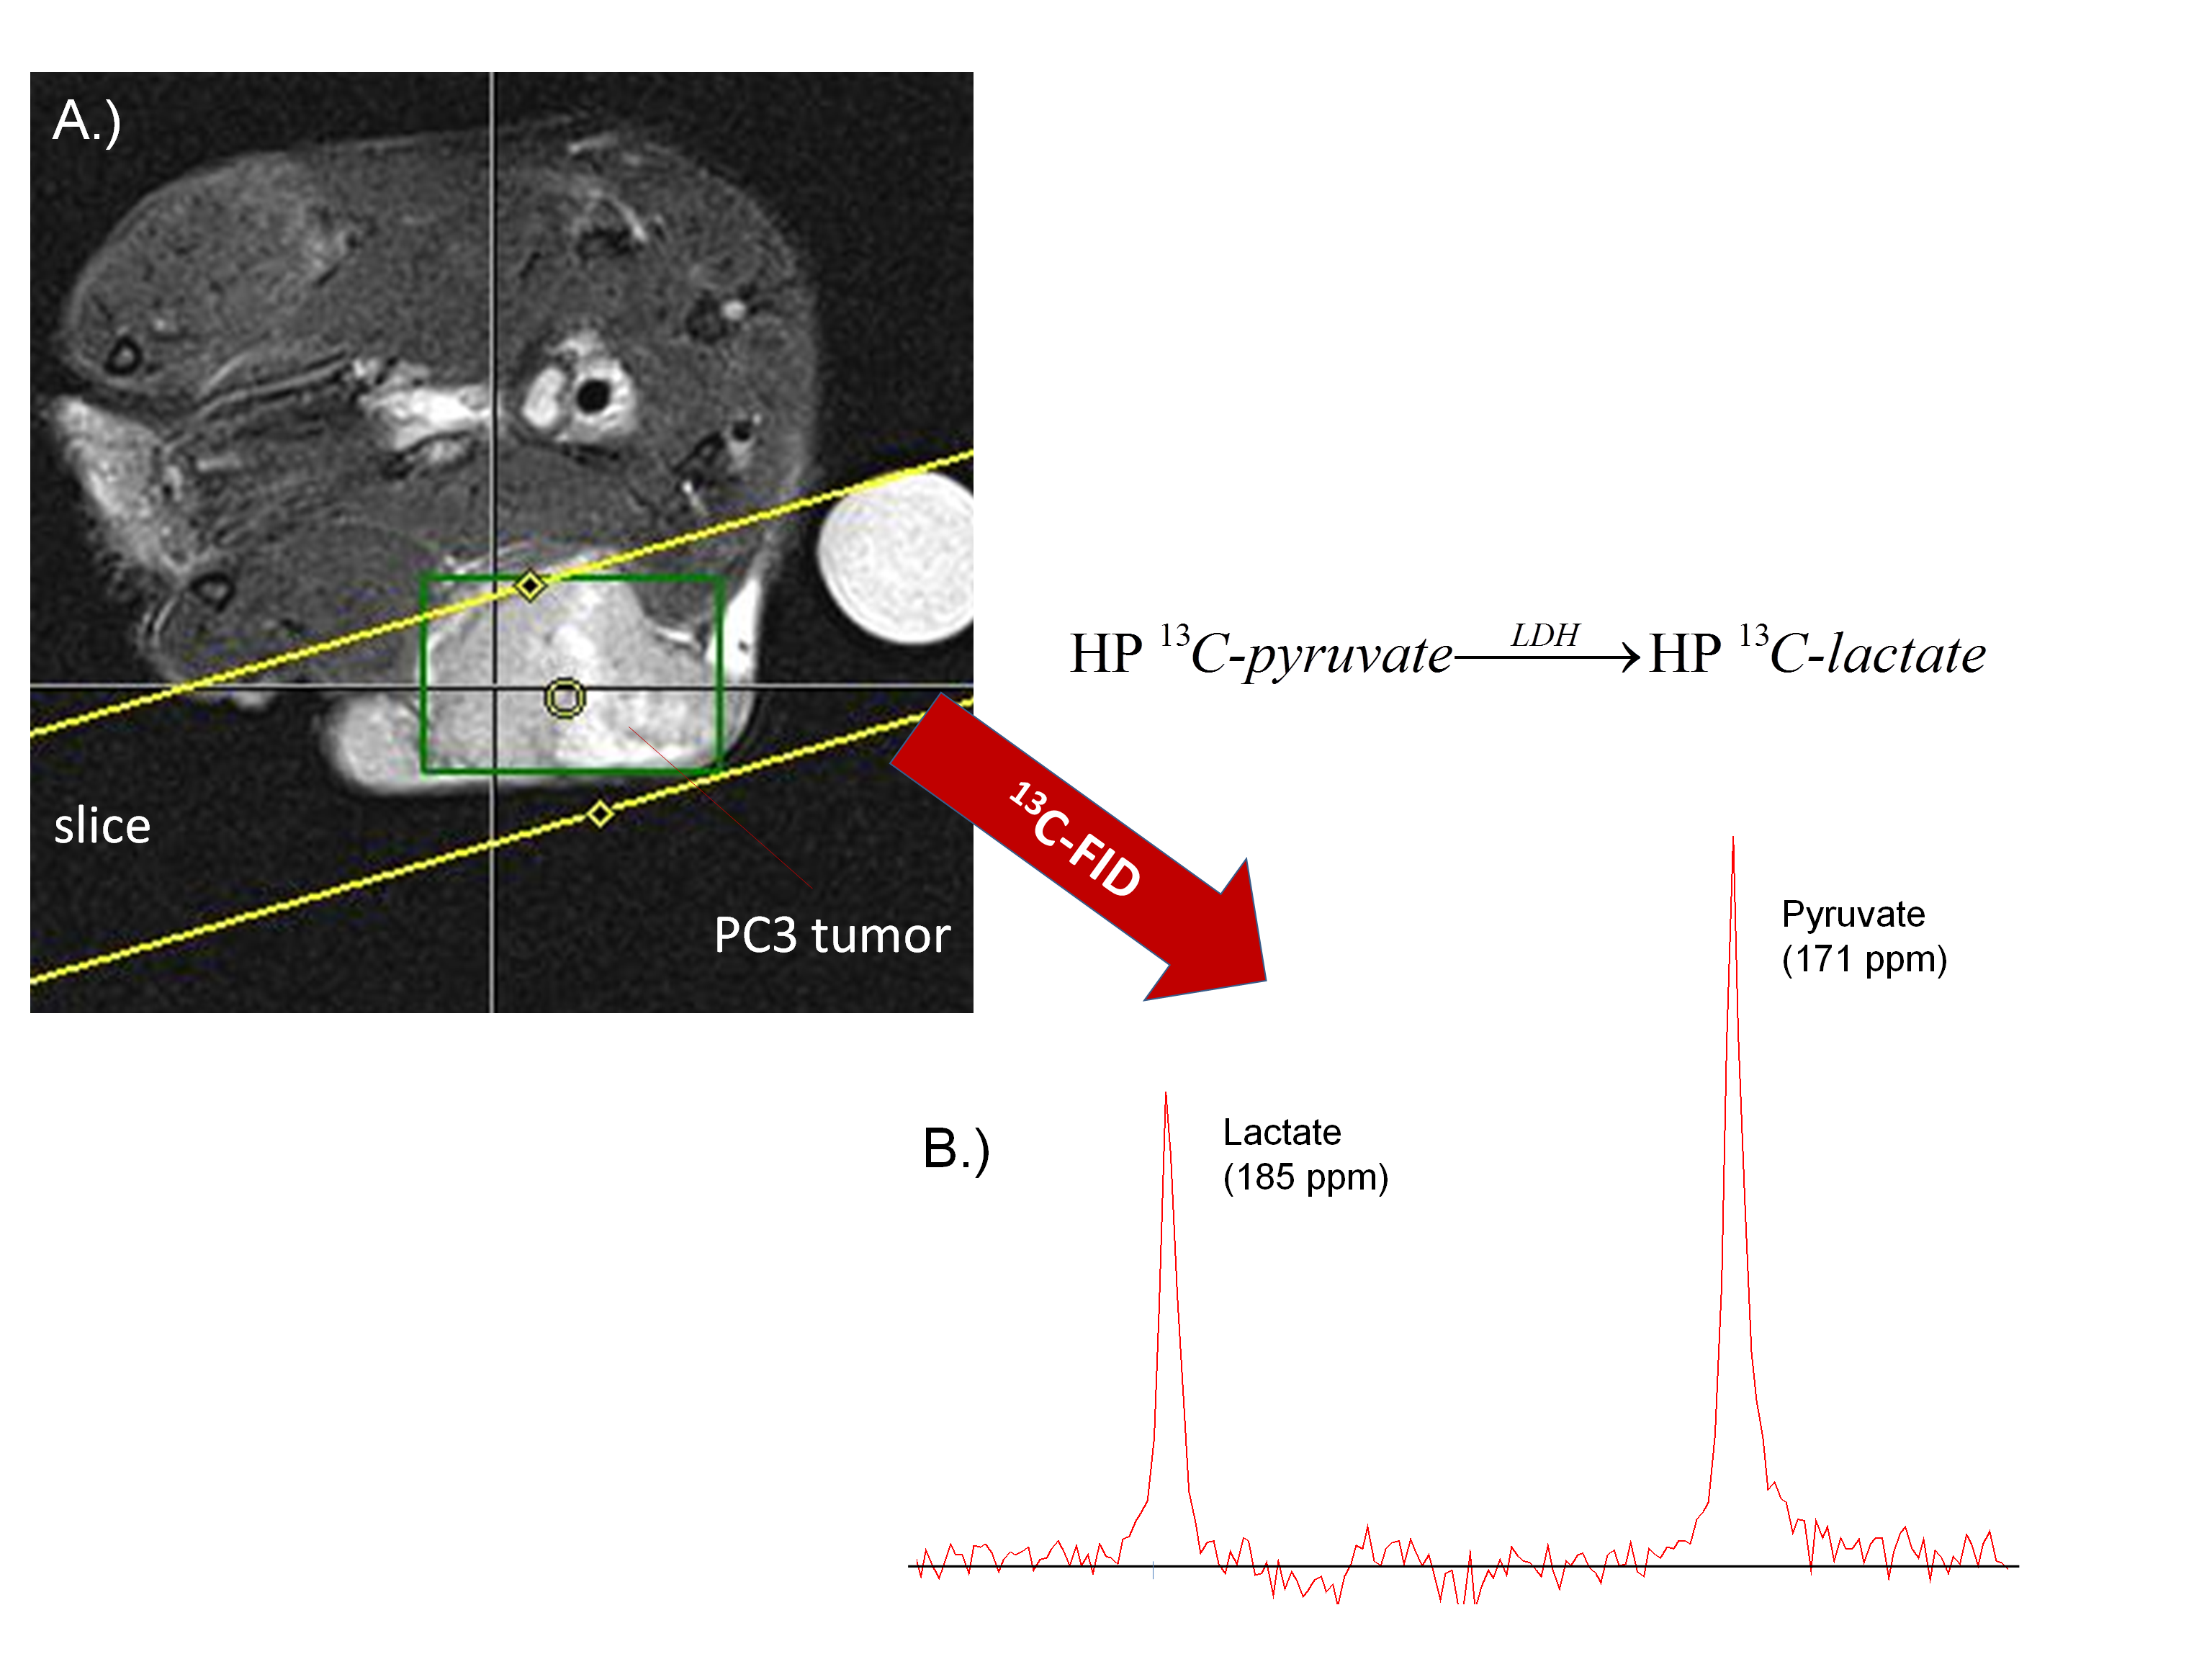
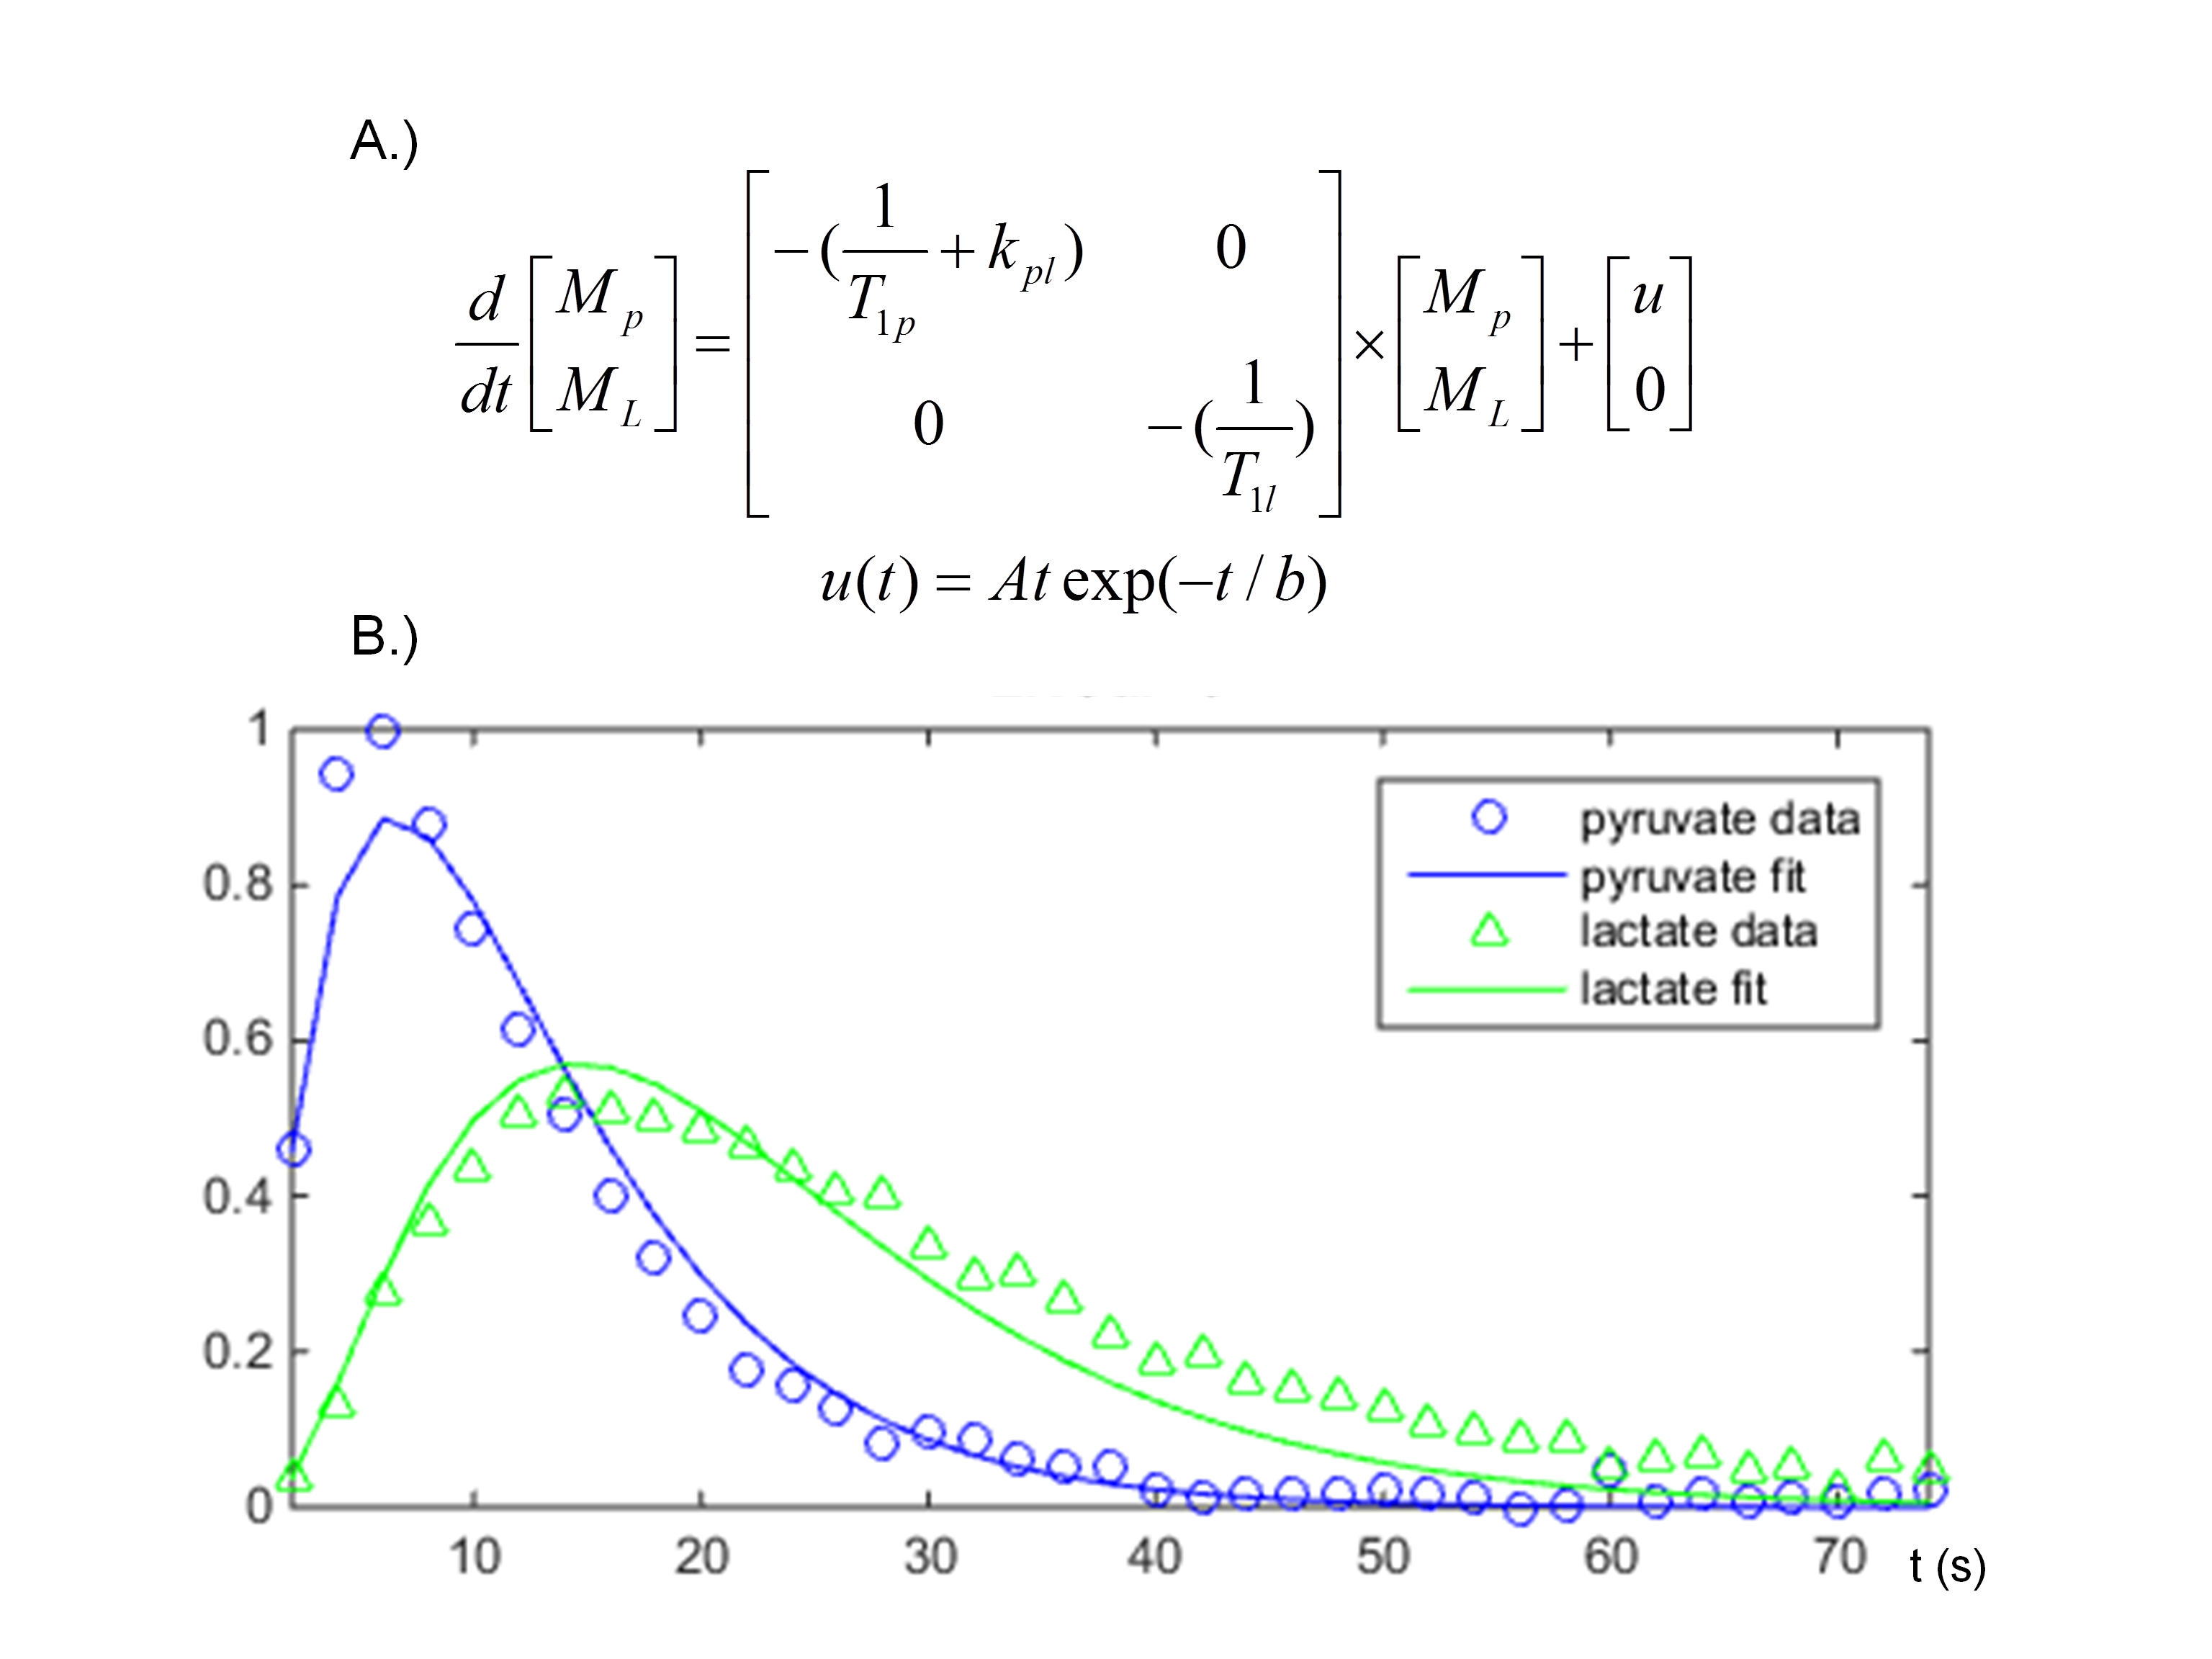
All experiments were approved by Animal Ethical Committee. LNCaP and PC3 tumor cells were injected subcutaneously at the right hind leg of Balb/c nude mice. Mice were anesthesized followed by T2-weighted MRI. Subsequently, [1-13C]pyruvate was hyperpolarized using DNP and injected intravenously (final concentration 80 mM). MR was performed on a 7T MR system (Bruker, Clinscan) with a dedicated 13C/1H-probe. The conversion of pyruvate into lactate was followed by measuring a slice-selective 13C-FID every 2s (FA=30°) (Fig.1A). Time courses of pyruvate and lactate signal integrals are fitted by an one-pool unidirectional kinetic model[6] (Fig.2A) and rate constants kpl are determined for the conversion of pyruvate into lactate. About 24h after the MR measurement, mice were injected with 10 MBq of [18F]FDG and the tumor uptake was measured after 1h using PET/CT (under anesthesia). After the [18F]-FDG-PET measurements, mice were sacrificed, the ex-vivo biodistribution of [18F]-FDG was measured and H/E staining was performed on tumor slices. Maximum standardized uptake values (SUVmax) were calculated from the PET/CT images.Results
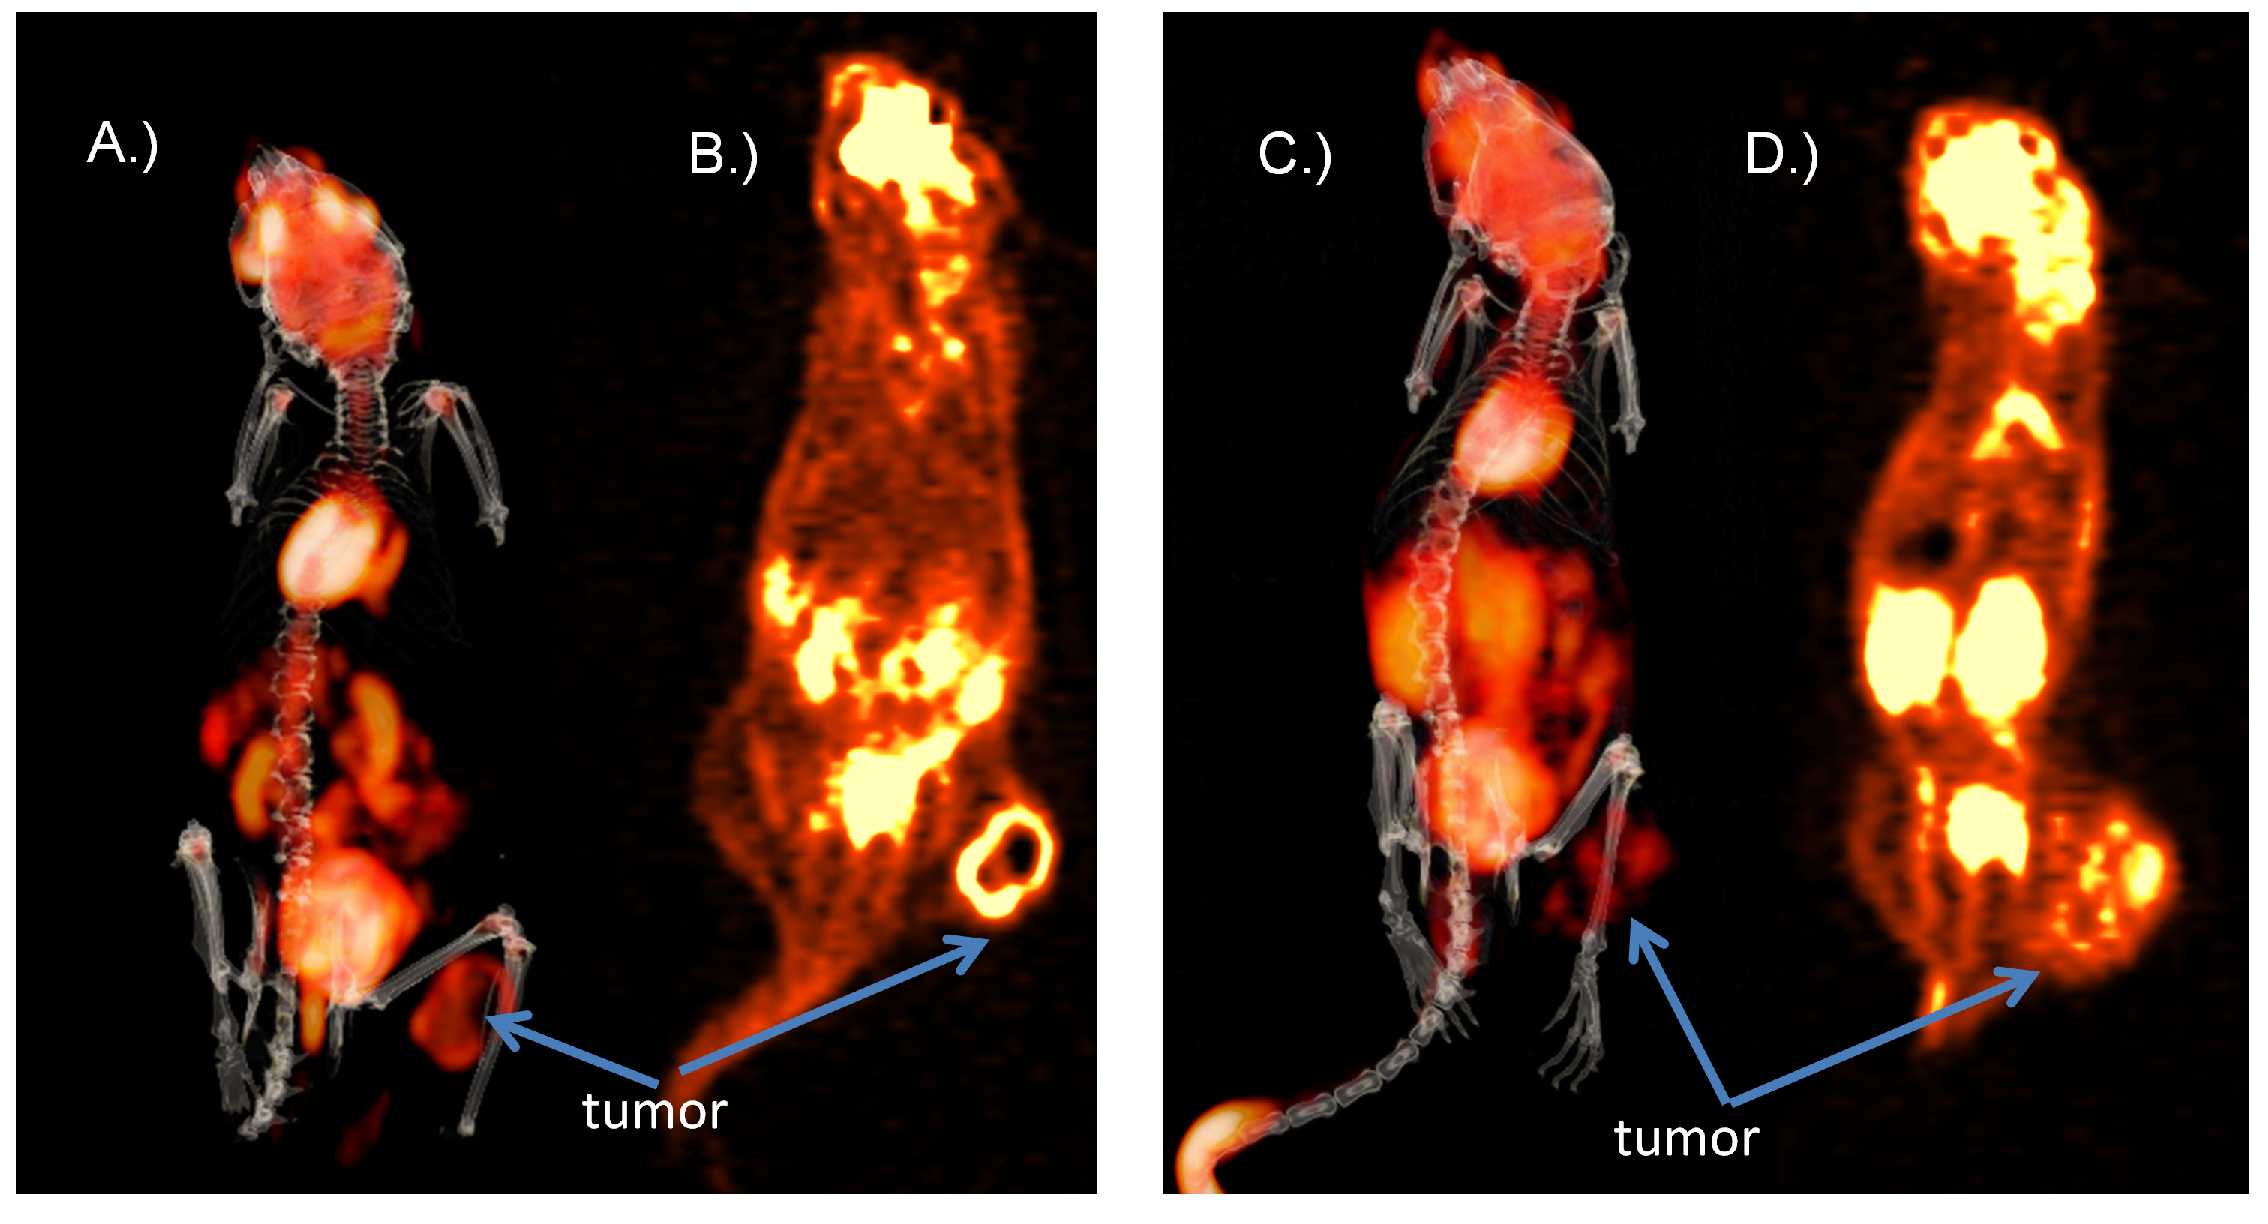
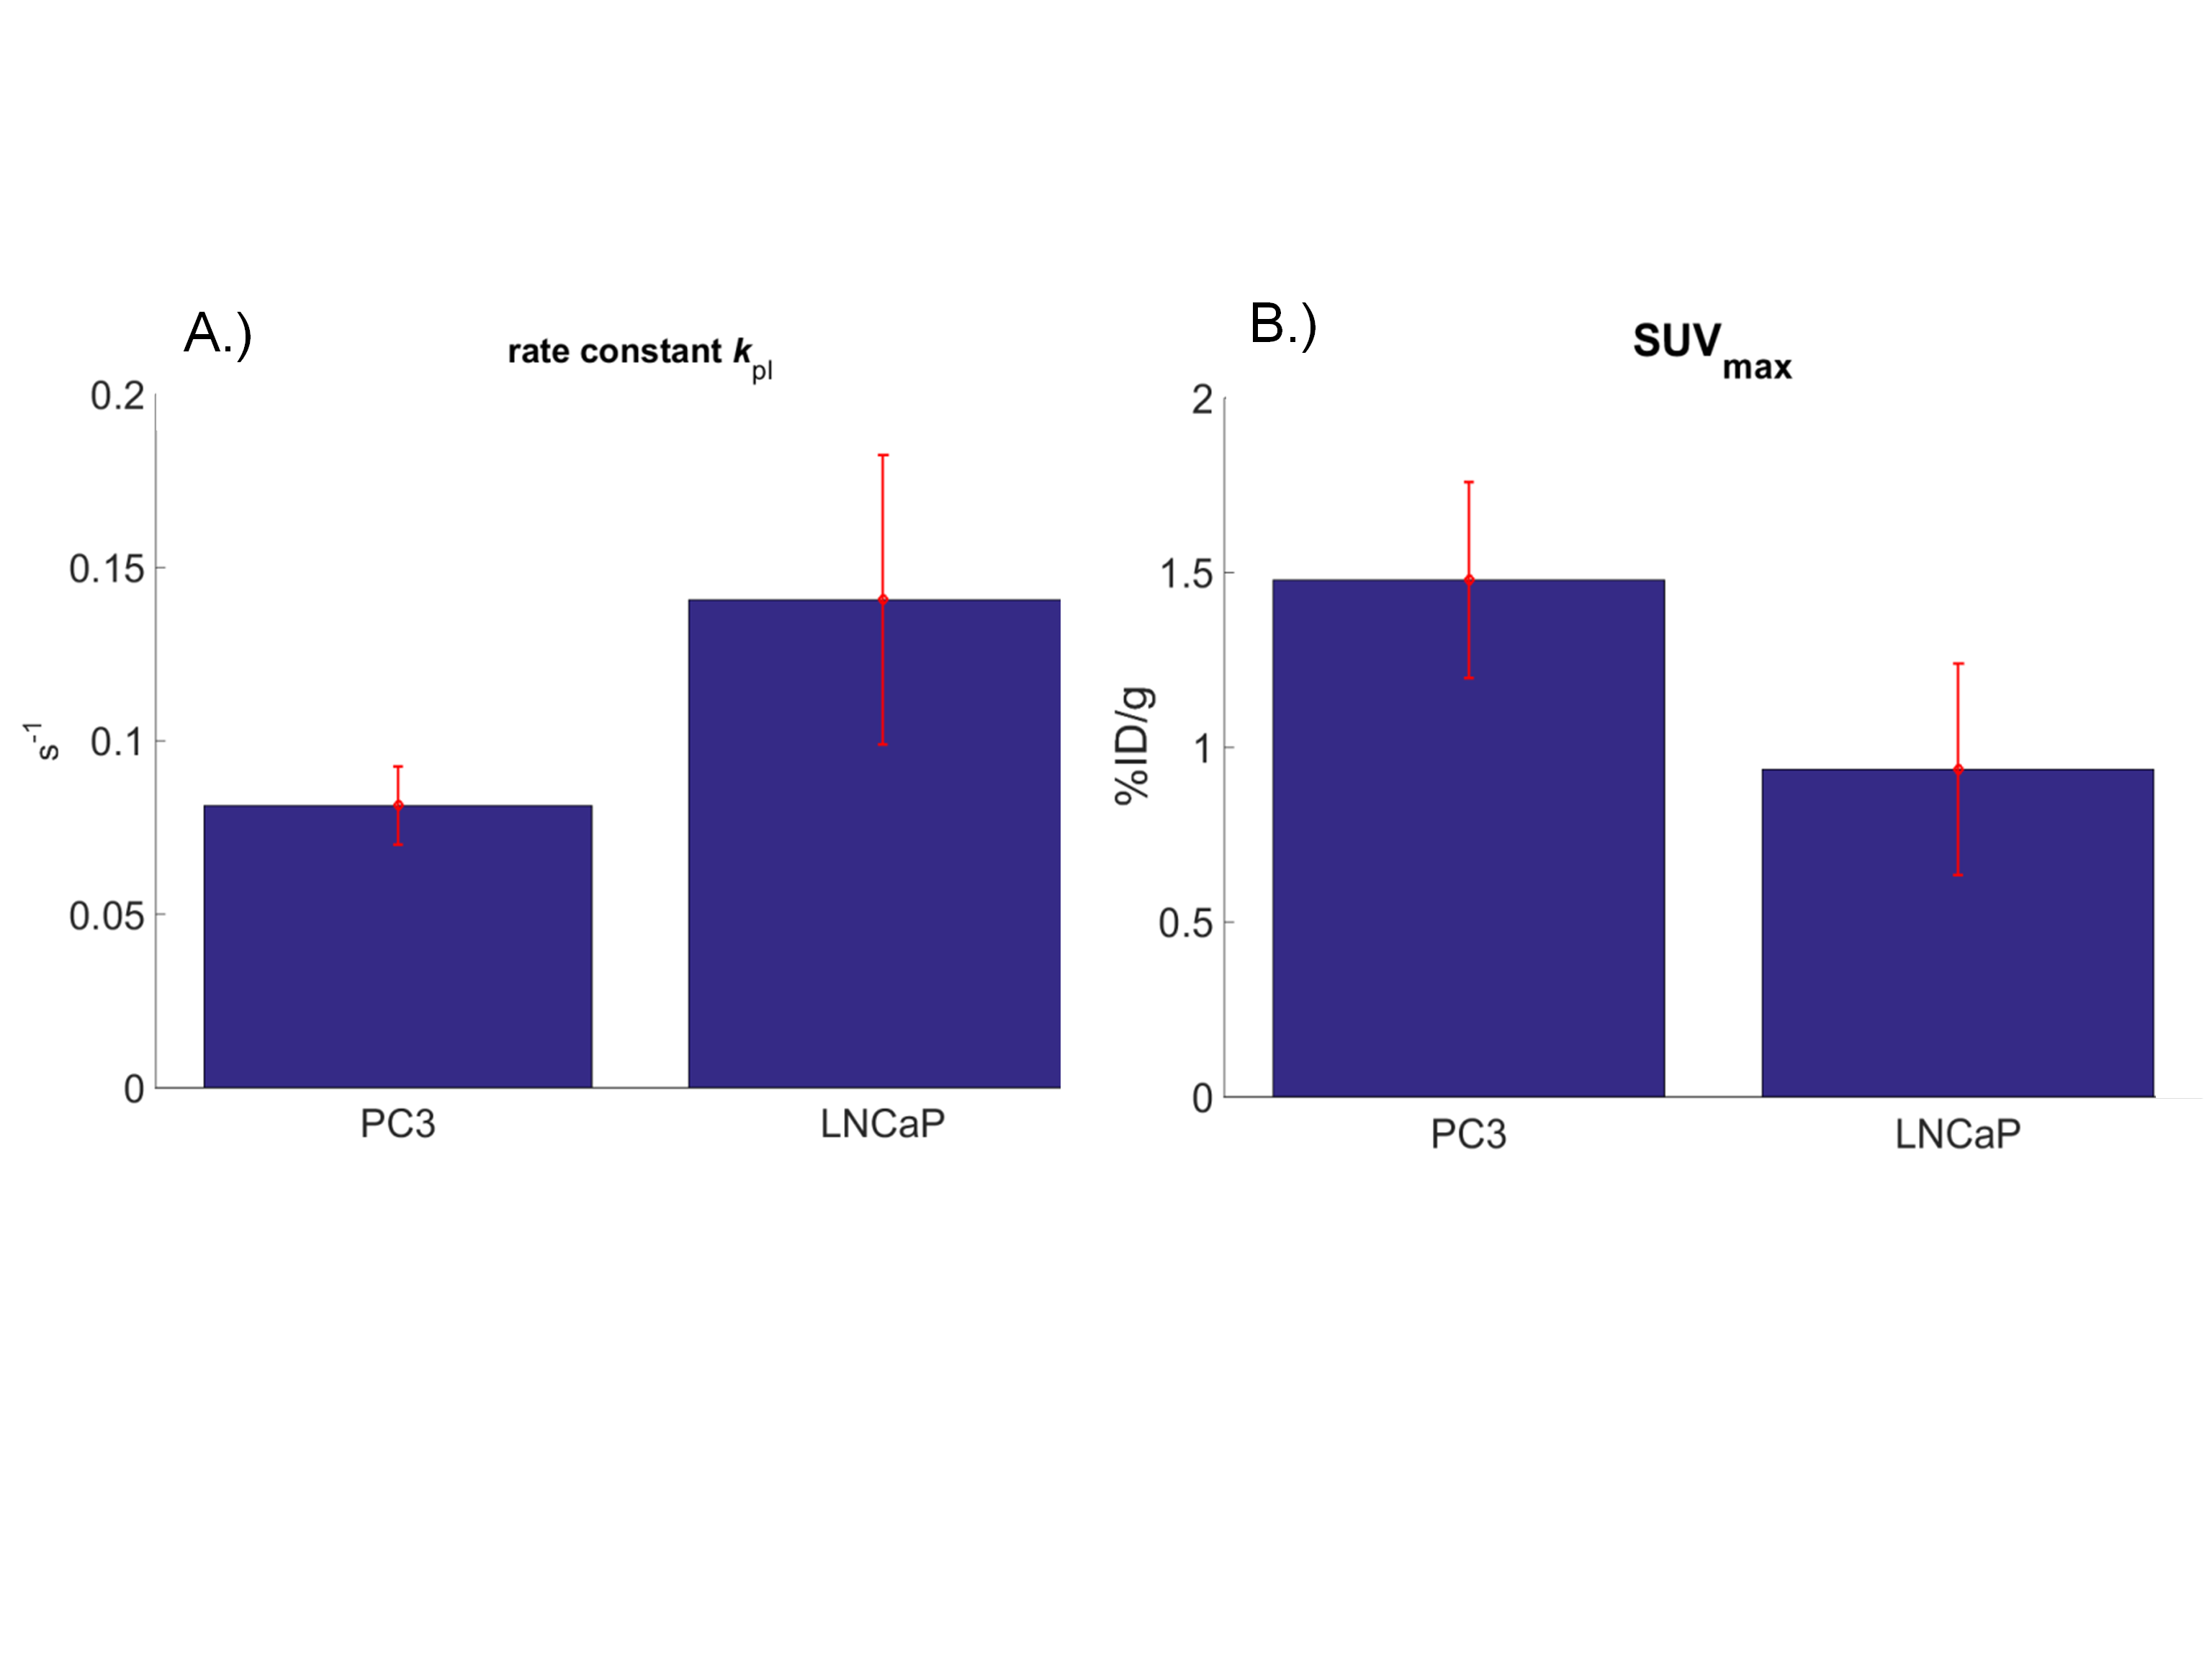
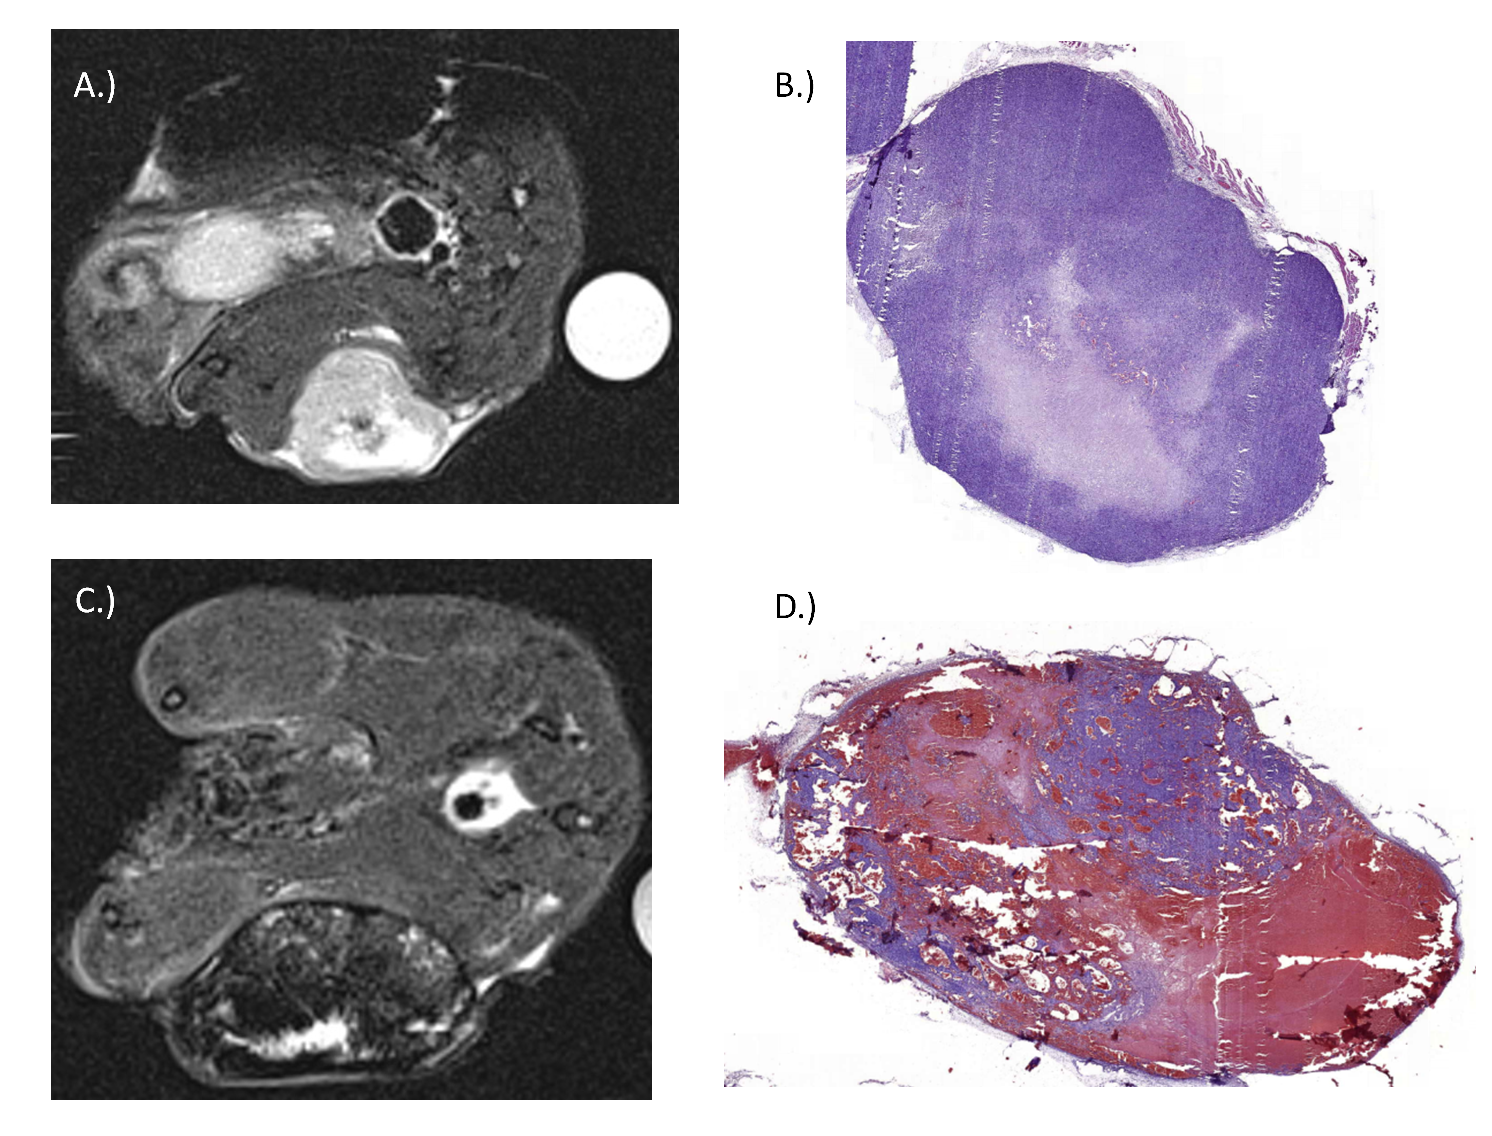
After injection of hyperpolarized [1-13C]pyruvate, both pyruvate and lactate signals were detected in the 13C-spectrum of the slice containing the tumor (Fig.1). The time courses of the integrals of these peaks reflect the delayed production of lactate from pyruvate (Fig. 2B). By fitting these curves with the one-pool unidirectional kinetic model (Fig.2A) the rate constant kpl as a measure of pyruvate conversion was determined. The mean kpl is lower for the LNCaP than for the PC3 tumor (8.14x10⁻²±1.1x10⁻² s-1 and 14.1x10⁻²±4.1x10⁻² s-1 respectively; Fig.4A). Glucose metabolism was measured by [18F]-FDG PET. The PET/CT image of a mouse with a PC3 tumor on the right hind leg shows high 18F-FDG uptake in the outer part of the tumor and less in the center, suggestive of a necrotic center (Fig.3A/B). A PET/CT of a mouse with an LNCaP tumor shows inhomogeneous uptake of 18F-FDG (Fig.3C/D). The mean SUVmax values are higher for the PC3 than for the LNCaP (1.48 ±0.28 %ID/g and 0.94 ±0.30 %ID/g respectively). The difference in SUVmax between the two tumor types is significant (p=0.04; see Fig 4B). T2-weighted MR images and H/E staining revealed that the LNCaP tumors contain (leaky) blood vessels/hemorrhages and PC3 tumors have a necrotic core (Fig. 5).Discussion
Our results indicate a higher rate of pyruvate to lactate conversion in LNCaP compared with PC3, and higher glucose uptake in PC3 compared with LNCaP. The doubling time of PC3 is shorter (32h) than for LNCaP (60h) in vitro.[1][2][7] This would result in a higher energy consumption in PC3 cells than in LNCaP. Our glucose uptake results are in agreement with this, but the higher rate of pyruvate to lactate conversion in LNCaP may seem surprising. The balance between glycolysis and citric acid cycle activity seems to be more towards glycolysis in LNCaP than in PC3. The PET and MR images and histology show that the PC3 tumor has a necrotic core, while the LNCap tumor is more inhomogeneous. It might be that LNCaP contains more lactate. Because of the large bolus of 13C-labeled pyruvate and the rapid uptake by the cells, the 13C-label exchange with the lactate pool inside the viable tumor cells provides a measure of LDH activity, independent of cell number and tumor size, but not independent of tumor physiology. Differences in physiology might give rise to differences in permeability of the tumors. This difference can have a larger effect on the DNP measurements than on the [18F]-FDG-PET measurements because of the much shorter timescale (3min vs. 1h) allowing more time for the labels to go deeper into the tumor. In conclusion: we detected differences in pyruvate conversion and glucose uptake in vivo in murine xenograft models of early and late stage prostate cancer using combined DNP and [18F]FDG PET.Acknowledgements
No acknowledgement found.References
[1] Kaighn, M. E., et al., Establishment and characterization of a human prostatic carcinoma cell line (PC-3), Invest. Urol., 17(1979)
[2] Horoszewicz, J. S., et al., LNCaP Model of Human Prostatic Carcinoma, Cancer Res., 43(1983)
[3] Ardenkjaer-Larsen, J. H. et al., Increase in signal-to-noise ratio of > 10,000 times in liquid-state NMR, Proc. Natl. Acad. Sci.,100(2003)
[4] Golman, K., et al., Metabolic Imaging by Hyperpolarized 13C Magnetic Resonance Imaging for In vivo Tumor Diagnosis, Cancer Res., 66(2006)
[5] Lucignani, G., et al., The use of standardized uptake values for assessing FDG uptake with PET in oncology: a clinical perspective, Nucl. Med. Commun., 25(2004)
[6] Spielman, D. M., et al., In vivo measurement of ethanol metabolism in the rat liver using magnetic resonance spectroscopy of hyperpolarized [1-13C]pyruvate, Magn. Reson. Med., 62(2009)
[7] Pertega-Gomes, N., et al., A glycolytic phenotype is associated with prostate cancer progression and aggressiveness: a role for monocarboxylate transporters as metabolic targets for therapy, J. Pathol., 236(2015)
Figures