4478
Diffusion Kurtosis Imaging Evaluating Epithelial–mesenchymal Transition in Colorectal Carcinoma Xenografts Model: Initial Experience1Department of Radiology, Xinhua hospital, Shanghai Jiaotong University School of Medicine, Shanghai, People's Republic of China, 2Department of Radiology, Xinhua hospital, Shanghai Jiaotong University School of Medicine, People's Republic of China, 3Philips Healthcare, People's Republic of China
Synopsis
Colorectal cancer (CRC) is one of the most common malignant tumors in gastrointestinal tract. Tumor recurrence and metastasis are still a major cause of death in rectal cancer patients. Epithelial-mesenchymal transition (EMT) is reported a critical process providing tumor cells with the ability to migrate and metastasize to distant sites, leading to a poor prognosis in CRC. The diffusion kurtosis imaging (DKI) could quantify non-Gaussian behavior of water diffusion and provide more precise information of tissue characteristics. Our study demonstrated that DKI could be used to identify EMT in CRC xenograft models.
Purpose: Colorectal cancer (CRC) is one of the most common malignant tumors in gastrointestinal tract. Tumor recurrence and metastasis are still a major cause of death in rectal cancer patients1. It is reported that epithelial-mesenchymal transition (EMT) is a critical process providing tumor cells with the ability to migrate and metastasize to distant sites2. Previous research suggests that EMT plays a seminal role in promoting disease progression and resistance to neoadjuvant therapy, leading to a poor prognosis in CRC3,4. Recently, an advanced diffusion-weighted imaging (DWI) model of diffusion kurtosis imaging (DKI) that quantifies non-Gaussian behavior of water diffusion has been increasingly adopted for providing more precise information of tissue characteristics5. Therefore, the aim of our study was to investigate the feasibility of DKI in identifying EMT in CRC xenograft models.
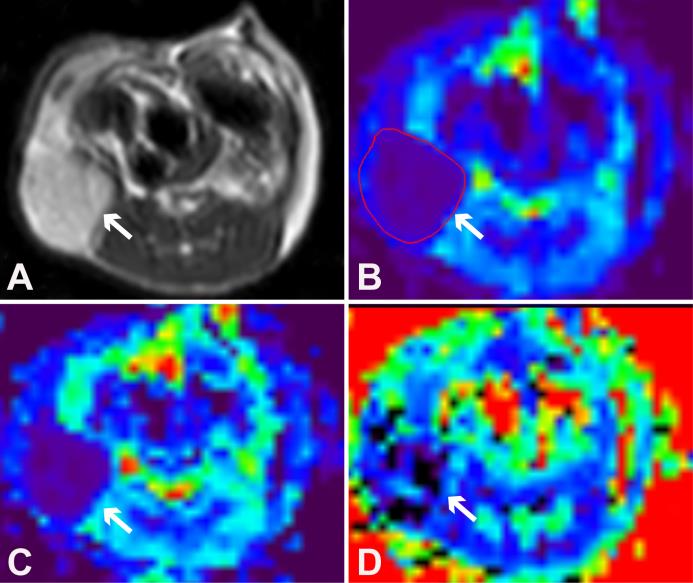
Methods: EMT was induced in HCT116 cells by overexpressing the transcription factor of Snail1 (HCT116/Snail1). EMT features were confirmed by morphologic analysis, real-time polymerase chain reaction (PCR), and Western blot analysis. Migration and invasion assays were performed in HCT116/Snail1 and parental cells (HCT116/Control). Mice bearing HCT116/Snail1 and HCT116/Control xenograft tumors (n=10 per group) underwent T2-weighted imaging and DKI at a 3.0T Ingenia MR imaging system (Philips, Best, the Netherland). The single-shot spin-echo echo-planar DKI sequence was performed by using tri-directional motion-probing gradients with b values of 0, 500, 1000, 1500 and 2000 s/mm2 (TR/TE 3000/59 ms, 4-6 slices, slice thickness 2 mm, no interslice gap, field of view 50×50 mm2, matrix 64×64, parallel imaging factor 3, receiver bandwidth 1047.9 Hz, 19 signal averages and acquisition time of approximately 6.5-13.5 min). The apparent diffusion coefficient (ADC), diffusivity (D), and kurtosis (K) maps were calculated by using in-house software developed in IDL 6.3 (Fig.1). The ADC calculated by using the standard monoexponential fit, DKI-derived parameters of D and K calculated by performing voxel-by-voxel analysis on the basis of DKI nonlinear equation, and tumor cellularity were compared by performing the Student t test in both groups. The receiver operating characteristic (ROC) curves were used to assess the performance of ADC, D, and K parameters for identifying EMT in tumors. The correlations between the ADC, D, and K and immunohistochemical analysis including Ki-67 and E-cadherin expression were performed.
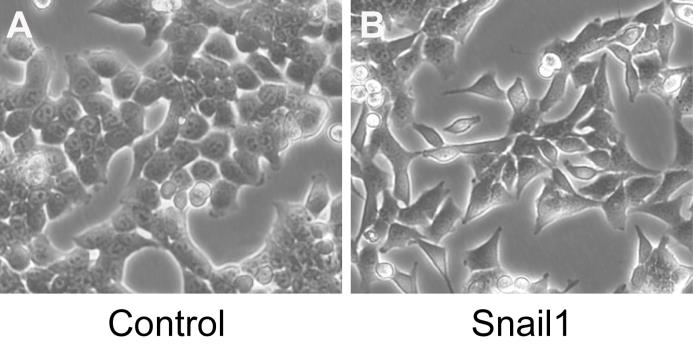
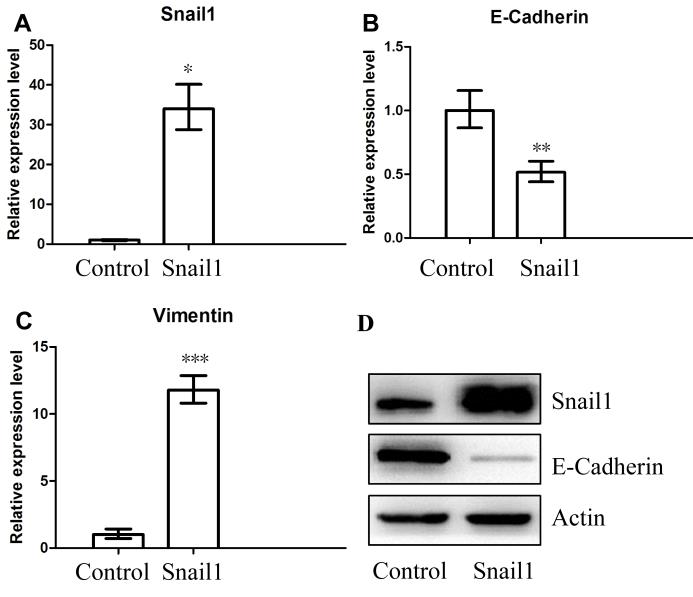
Results: The HCT116/Snail1 cells showed a marked altered cellular morphology with mesenchymal phenotype, including loss of cell polarity showing spindle shape, increased intercellular separation suggesting loss of cell-cell adhesions, and increased formation of pseudopodia (Fig.2). PCR analysis showed the up-regulation of Snail1 and vimentin mRNA, and down-regulation of E-cadherin mRNA in HCT116/Snail1 cells. The increased expression of the Snail1 protein and decreased expression of the epithelial adhesion molecules E-cadherin protein were also comfirmed with Western blot analysis in the HCT116/Snail1 cells compared with the HCT116/Control cells (Fig.3). The HCT116/Snail1 cells exhibited a 1.9-fold and 2.4-fold increase in migrating (P<0.001) and invading cells (P<0.001), respectively. As shown in Table 1, ADC and D were significantly lower, and K was significantly higher in the HCT116/Snail1 xenograft tumors than those in the HCT116/Control tumors (P=0.007, P=0.002, P<0.001, respectively). The areas under the ROC, the accuracies and sensitivities in distinguishing the HCT116/Snail1 tumors from the HCT116/Control tumors for DKI-derived parameters were higher than those for the ADC (Table 2). The tumor cellularity was significant higher in HCT116/Snail1 tumors than that in the control group (P<0.001) .The D was negatively correlated and K was positively correlated with the Ki-67 expression (P=0.007, P<0.001, respectively). D was positively correlated and K was negatively correlated with E-cadherin expression (P=0.023, P=0.006, respectively).
Discussion: DKI model could quantify the non-Gaussian behavior of water diffusion, which is more close to the diffusion behavior in biological tissues, compared with the Gaussian diffusion assumption of conventional diffusion imaging. Thereby, DKI model is more accurate and sensitivity in assessing the complexity of tissue microstructural environments, compared with the standard monoexponential model. In our preliminary study, the increased cellularity and cell dedifferentiation leading to higher restriction of water diffusion and more heterogeneity were observed in the CRC tumors with EMT. Furthermore, the D and K were significantly correlated with Ki-67 and E-cadherin expression. These significant differences could be reflected with the DKI-derived parameters of D and K.
Conclusion: Our preliminary study demonstrated that DKI performed a better fitting to the diffusion-weighted signal than the monoexponential ADC and DKI-derived parameters could be used to identify EMT in CRC xenograft models by characterizing the tissue microstructure.
Acknowledgements
No acknowledgement found.References
1. Fan CW, Chen T, Shang YN, et al. Cancer-initiating cells derived from human rectal adenocarcinoma tissues carry mesenchymal phenotypes and resist drug therapies. Cell Death Dis. 2013; 4:e828.
2. Fan F, Samuel S, Evans KW, et al. Overexpression of snail induces epithelial-mesenchymal transition and a cancer stem cell-like phenotype in human colorectal cancer cells. Cancer Med. 2012; 1:5-16.
3. Fan XJ, Wan XB, Huang Y, et al. Epithelial-mesenchymal transition biomarkers and support vector machine guided model in preoperatively predicting regional lymph node metastasis for rectal cancer. Br J Cancer. 2012; 106:1735-1741.
4. Bhangu A, Wood G, Mirnezami A, et al. Epithelial mesenchymal transition in colorectal cancer: Seminal role in promoting disease progression and resistance to neoadjuvant therapy. Surg Oncol. 2012; 21:316-323.
5.
Rosenkrantz AB, Sigmund EE, Winnick A, et al. Assessment of hepatocellular
carcinoma using apparent diffusion coefficient and diffusion kurtosis indices:
preliminary experience in fresh liver explants. Magn Reson Imaging. 2012;
30:1534-1540.
Figures
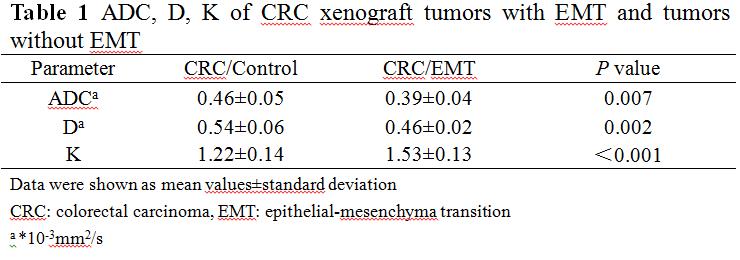
Data were shown as mean values±standard deviation
CRC: colorectal carcinoma, EMT: epithelial-mesenchyma transition
a *10-3mm2/s
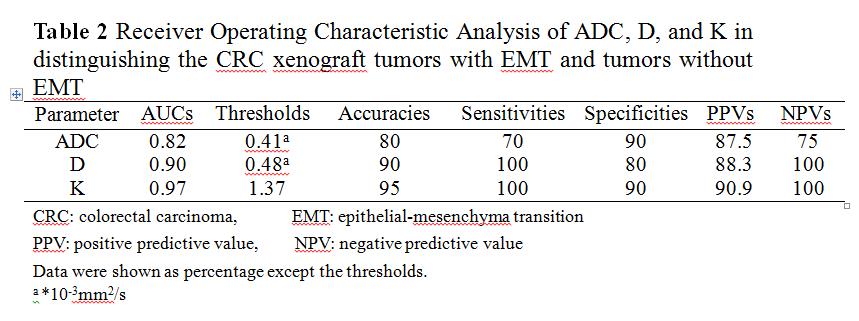
CRC: colorectal carcinoma, EMT: epithelial-mesenchyma transition
PPV: positive predictive value, NPV: negative predictive value
Data were shown as percentage except the thresholds.
a *10-3mm2/s