4477
Electric field and current density mapping during reversible Electroporation1School of Biological and Health Systems Engineering, Arizona State University, Tempe, AZ, United States
Synopsis
Electroporation is popular in cancer therapy and gene or drug delivery. Magnetic Resonance Electrical Impedance Tomography (MREIT) was used to monitor the applied electric field and current density during electroporation. Electroporation fields were applied by novel low-susceptibility carbon fiber electrodes in a bovine liver tissue sample. Projected current density (JP) and Electric field (E) were computed from MR data collected under electroporation fields. Susceptibility artifacts around the pair of carbon fiber electrodes were greatly reduced. In this study, we demonstrated the feasibility of MREIT technique to monitor the current density and electric field distribution during ex-vivo tissue electroporation.
Introduction
Electroporation is becoming increasingly popular in clinical procedures, particularly in cancer therapy and gene or drug delivery1. Reversible electroporation, a routine laboratory procedure, is used in the delivery of drugs, molecules or genes into target cells. The threshold to perform reversible electroporation or tissue ablation is specific to target tissues. Application of large electric fields can lead to the breakdown of cell membrane and apoptosis (irreversible electroporation)2. In this study, Magnetic Resonance Electrical Impedance Tomography (MREIT)3 was used to monitor the applied electric field and current density during electroporation. Susceptibility artifacts, inherent in MRI imaging of conventional electroporation electrodes, were overcome by introducing novel low-susceptibility carbon fiber electrodes to apply electroporation fields.Purpose
We monitored applied electric field and current density distributions using low-susceptibility novel carbon fiber electrodes in excised tissue samples during a reversible electroporation procedure.Methods
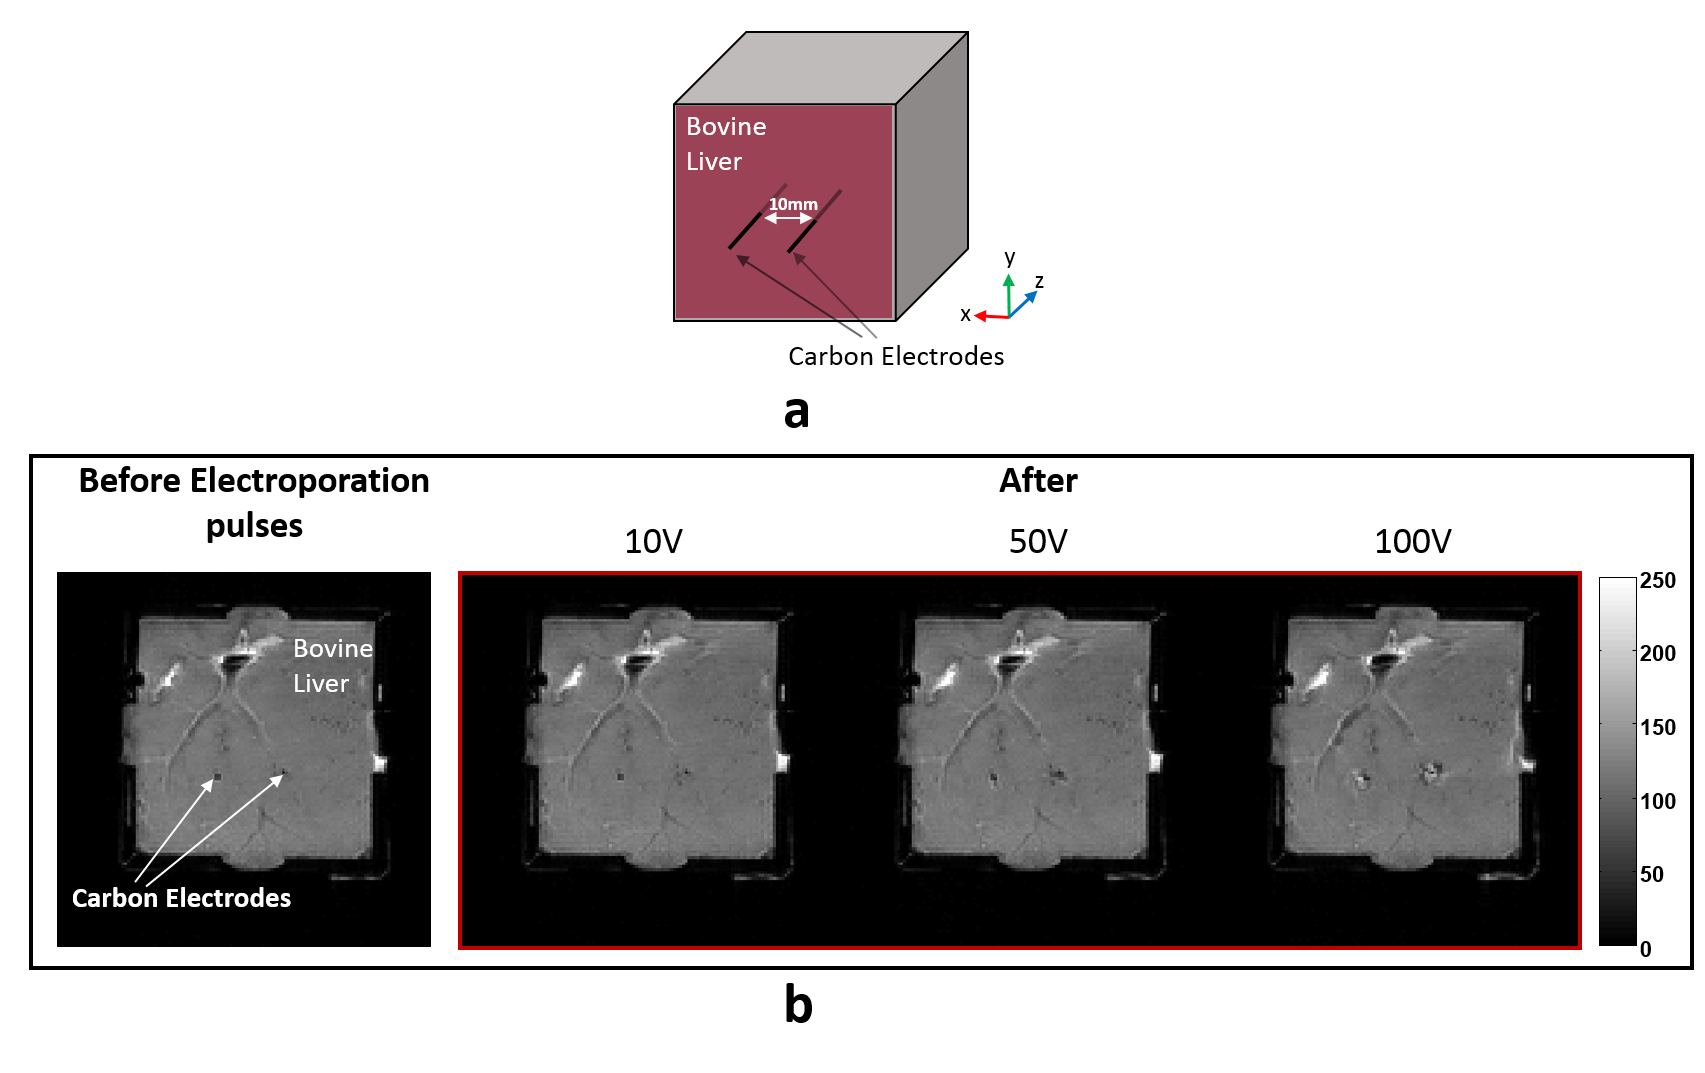
Carbon Fiber electrodes (CF) were prepared by coating carbon fiber bundles (TC-33 3K filaments, Formosa Plastics Group) with a mixture of Nafion in Isopropanol and Polyvinylidene Fluoride (PVDF) in Acetone to ensure adequate insulation. The impedance of each electrode was measured to be ~1kΩ at 1 kHz. Bovine liver tissue was placed in a cubic chamber (40 mm side) and imaged in MREIT experiments. The conductivity (σ) of liver tissue measured using a four-probe method with a Hewlett Packard impedance analyzer (4192A LF) and found to be ~0.04 Sm-1 at 100 kHz.
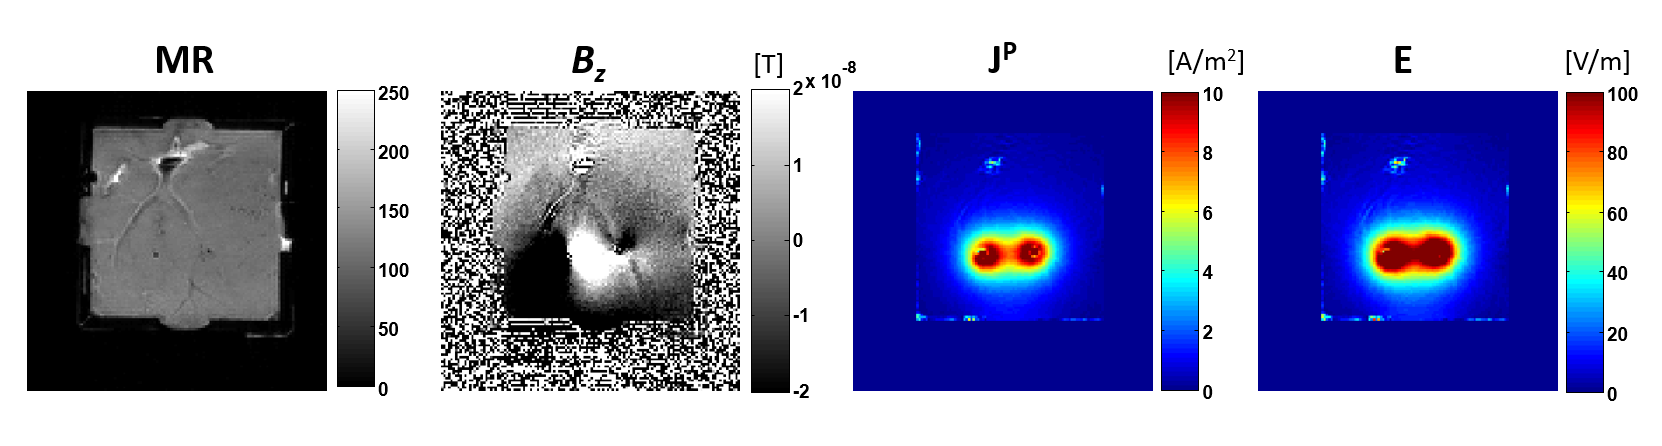
Two carbon fiber electrodes (diameter ~500μm, length 40 mm) were inserted parallel into the liver tissue and spaced 10 mm apart. Care was taken to ensure the current-injecting tips of the electrode pair were in the same imaging slice. Figure 1(a) shows the setup of the tissue phantom with an electrode pair. MR images were acquired using 7T Bruker Biospin MRI (Billerica, MA) with bore diameter 20 cm, located at BNI, Phoenix, AZ, USA. Rectangular electrical pulses (Amplitude: 10V, 50V, 100V) were delivered using an Electroporator ELP-01D (NPI Electronic GmbH, Germany). Electrical pulses were synchronized with a spin-echo sequence through spectrometer trigger pulses. The imaging parameters used were TR/TE = 1000/20 ms, FOV= 60 mm2, slice thickness = 3 mm (no gap), averages = 1, matrix size = 128x128, number of slices = 12, applied electric pulse duration (Tc) = 10 ms and total imaging time = 128 s. MR phase measured during separate positive and negative pulses (10 V, 50 V, and 100 V) were combined to compute the z-component of the magnetic flux density (Bz) and cancel the effect of systematic phase artifact. Bz data was used to reconstruct the projected current density ($$${J^{P}}$$$) distribution4. We assumed the liver sample conductivity was isotropic and computed the projected electric field ($$${E}$$$) within the z-plane from the projected current density ($$${J^{P}}$$$) using Ohm’s law:
$$$ E=\frac{J^{P}}{\sigma}$$$
Results
Figure 1 (b) shows MR magnitude images of the liver tissue before and after the application of electric fields. The progression of tissue damage with increase in applied voltage around the tip of the electrode pair is also apparent in figure 1(b). Figure 2 shows the MR magnitude, Bz, projected current density ($$${J^{P}}$$$) and projected electric field ($$${E}$$$) map for an applied electric field (amplitude = 100 V, pulse duration = 10 ms).Discussion
Susceptibility artifacts around the pair of carbon fiber electrodes were greatly reduced. This study therefore opens the possibility of using MR methods to gage electroporation efficiency near high field areas. If combined with echo planar imaging, dynamic processes can be monitored.
In this study, the measured isotropic conductivity (σ = 0.04 Sm-1) was used to compute the projected electric field distribution. The relative L2-error between the simulated noiseless current density ($$${J}$$$) and estimated projected current density ($$${J^{P}}$$$) was 0.37. An accurate measurement of the conductivity distribution in the tissue is possible using MREIT, however, two orthogonal current injections are needed.
Conclusion
In this study, we demonstrated the feasibility of MREIT technique to monitor the current density and electric field distribution during ex-vivo tissue electroporation. Future studies would involve fast MREIT imaging techniques to observe real-time changes in tissue property and electric fields during electroporation.Acknowledgements
No acknowledgement found.References
1. Weaver JC, Chizmadzhev YA. Theory of electroporation: A review. Bioelectrochem Bioenerg 1996;41(2):135-160.
2. Davalos RV, Mir LM, Rubinsky B. Tissue ablation with irreversible electroporation. Annals of Biomedical Engineering 2005;33(2):223-231.
3. Woo EJ, Seo JK. Magnetic resonance electrical impedance tomography (MREIT) for high-resolution conductivity imaging. Physiol. Meas. 2008;29(10):1–26.
4. Park C et al. Analysis of recoverable current from one component of magnetic flux density in MREIT. Phys. Med. Biol. 2007; 52(11)3001–3013.
Figures