4476
MR image analysis to identify habitats through comparison with histology and immunohistochemistry in breast cancer1Molecular Biology, Faculdade de Medicina de Sao Jose do Rio Preto, Sao Jose do Rio Preto, Brazil, 2Cancer Imaging and Metabolism, Moffitt Cancer Center, Tampa, FL, United States, 3Nalecz Institute of Biocybernetics and Biomedical Engineering, Poland, 4Oncologic Sciences, Moffitt Cancer Center, Tampa, FL, United States
Synopsis
Breast cancer shows significant heterogeneity at both inter- and intratumoral levels. In this study, a distribution clustering of multiple MRI pulse sequences was used in combination with a 3D printed approach, and showed a qualitatively comparable pattern of intratumoral heterogeneity (habitats) in MRI and histological images. This approach could potentially be used as a non-invasive imaging method for the monitoring of the intratumoral heterogeneity following the therapy in breast cancer.
Introduction
Methods
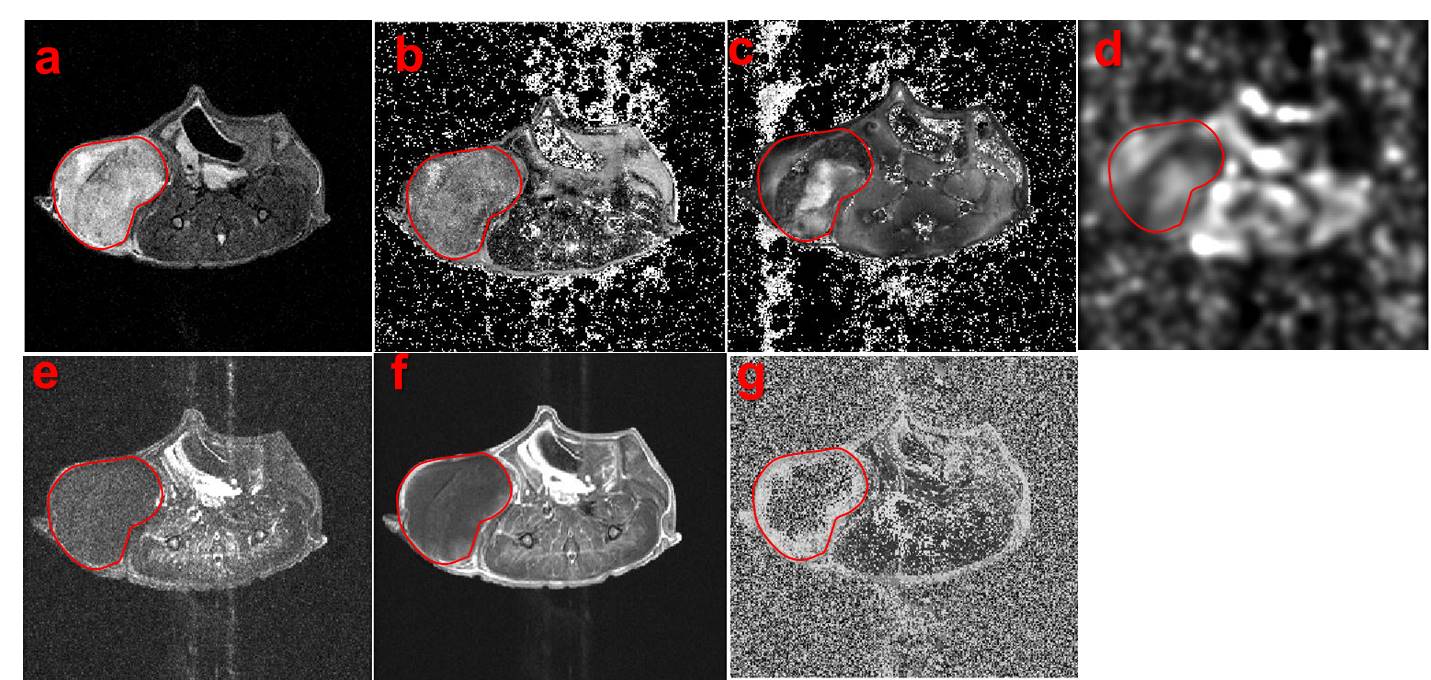
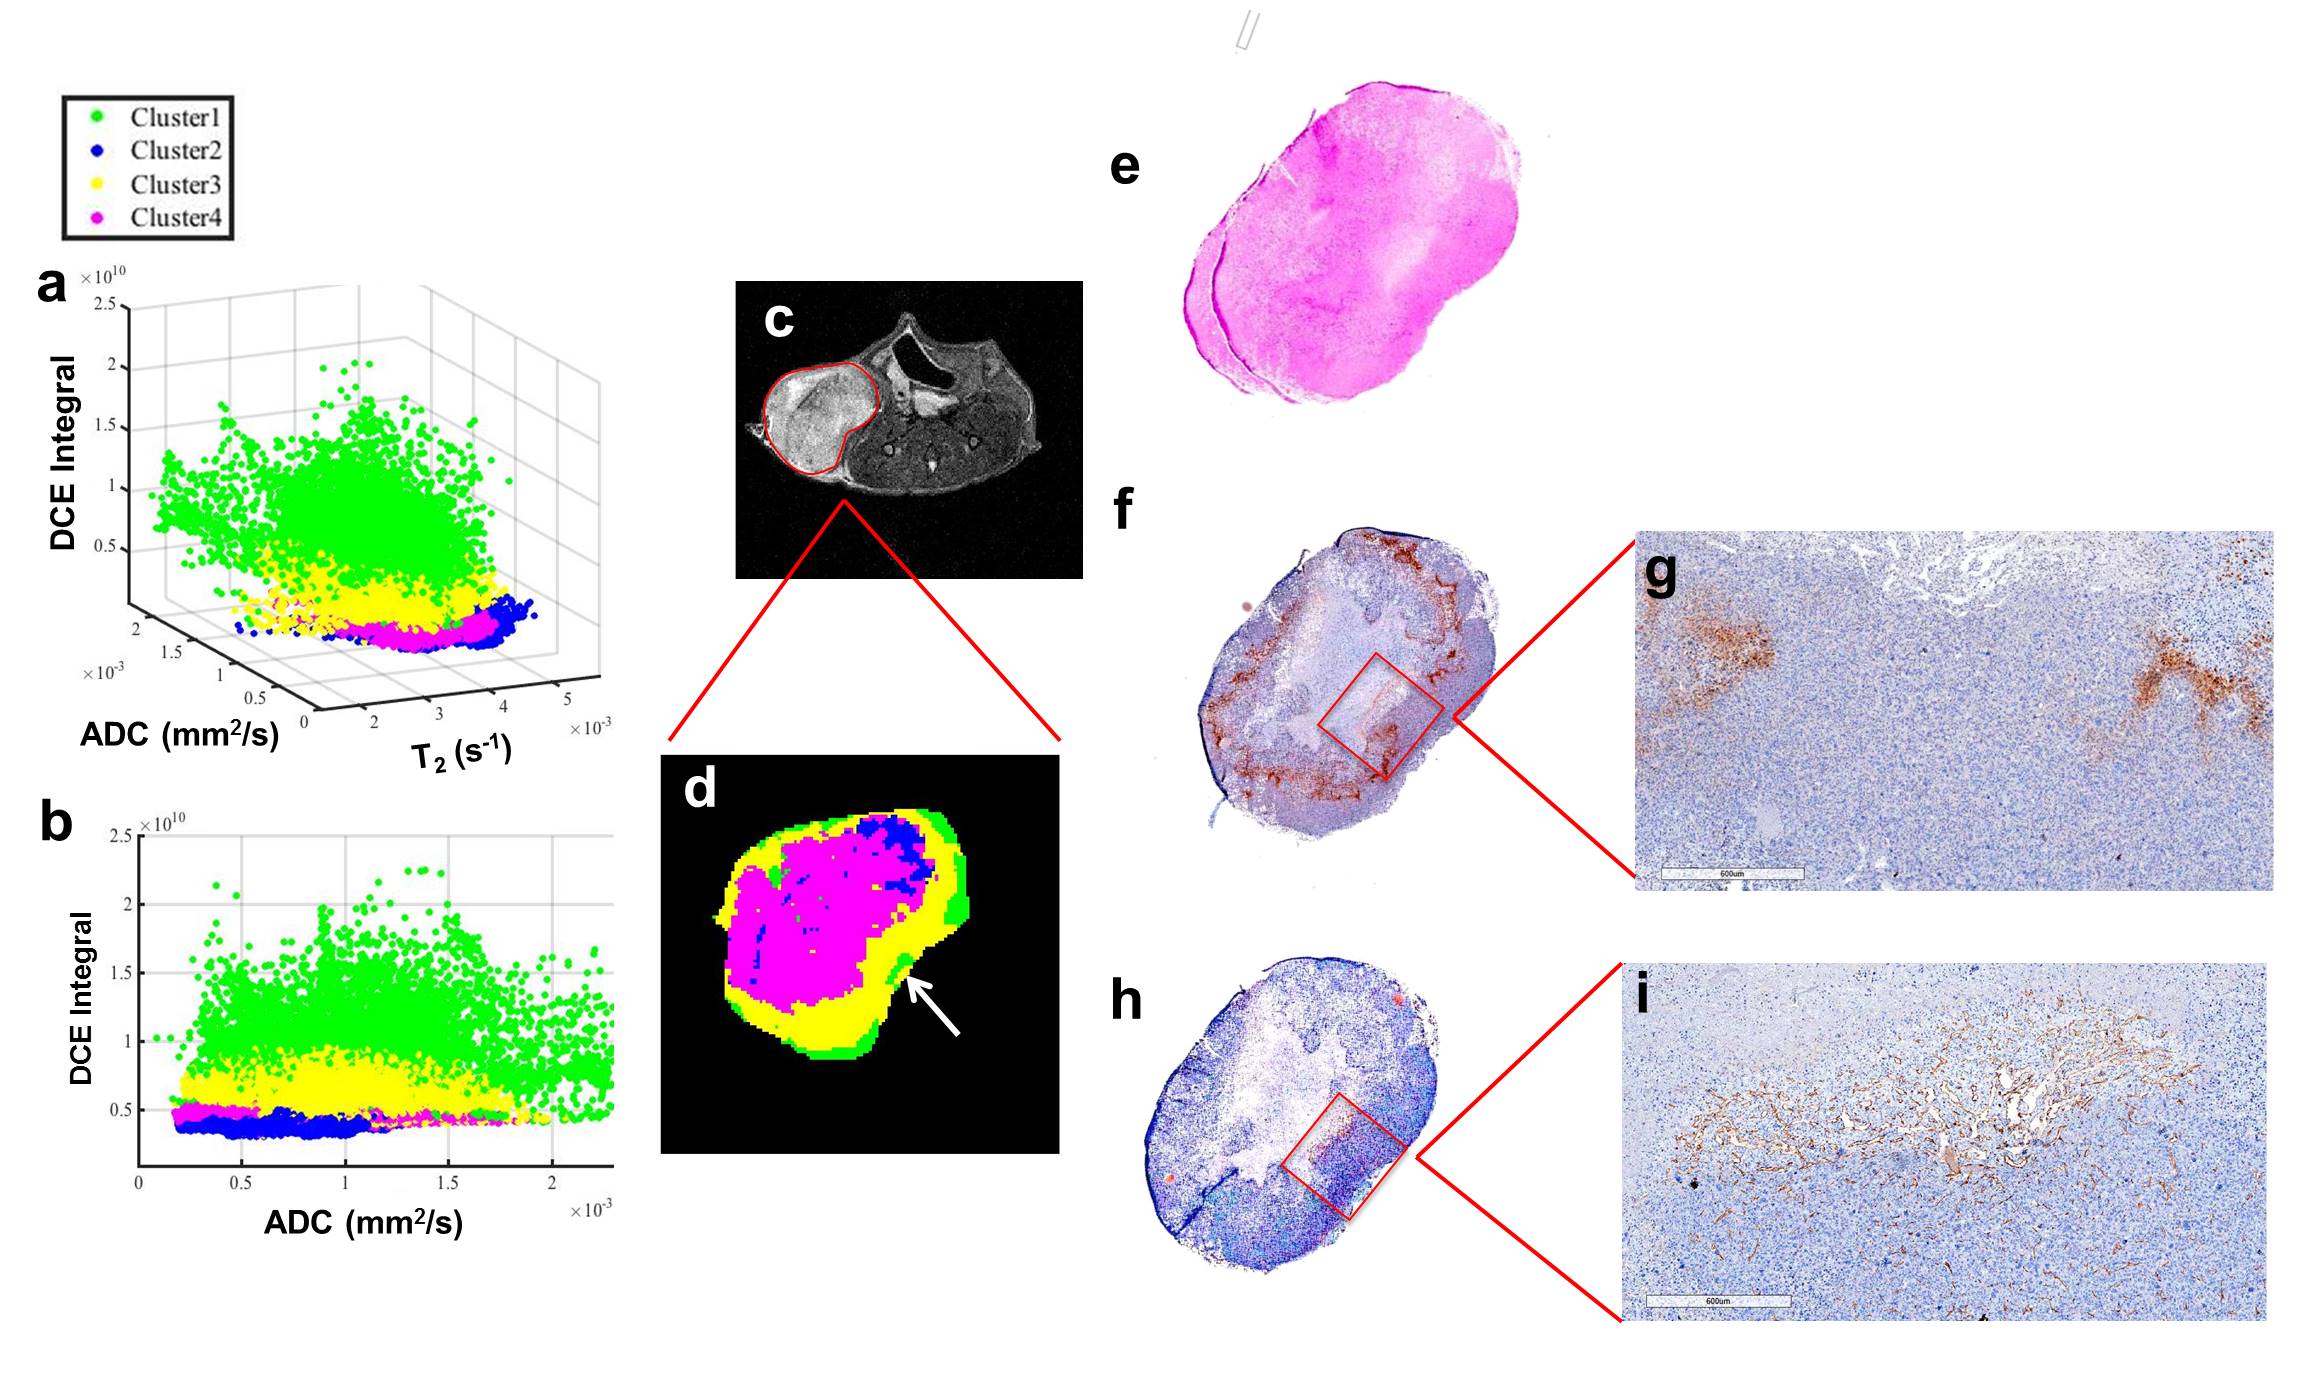
Human triple-negative breast cancer cells (MDA-MB-231) were injected into the right mammary gland of the athymic nude mice. The mice were imaged on 7T horizontal magnet (Agilent ASR 310) and Bruker electronics (BioSpec AV3HD), using a 35 mm birdcage coil (Doty Scientific). Anatomical T2 axial images of the mice were obtained with a TurboRARE sequence with TR/TE 2000/48ms, 11 slices, 1 mm slice thickness, FOV=32x32 mm. Also, diffusion-weighted MRI (DWI) (TR/TE=700/15.7 ms and b values of 100, 500 and 750 s/mm2) and T1 weighted dynamic contrast enhanced (DCE) upon injection of 0.2 mmol/kg Gd-DTPA-BMA (Omniscan®). All parameter maps were obtained using nonlinear least squares pixel-by-pixel fit (Levenburg-Marquardt) to the corresponding functions for T2, T2* and ADC. DCE maps were obtained through analysis of the pre- and post-contrast agent bolus time-series on a pixel-by-pixel basis. Parameter maps (Fig 1b-g) values within the tumor volume of interest were used to simultaneous classify 4 clusters. The algorithm was based on Gaussian mixture model fit with an expectation maximization algorithm. All values within the tumor were used for clustering, whereas a single slice is shown (Fig 2). After MRI scans, the mice received an intraperitoneal injection of pimonidazole (60 mg/kg) and were euthanized after 1 hour. The axial T2 images were used to manually segment the tumor contours and create a tumor mold printed in a 3D printer Object24 (Stratasys Ltd., USA), designed to cut the tumor into slices of 2 mm thickness, which are corresponding to two MRI slices (1 mm each). Tumor slices were stained with H&E and with pimonidazole and an endothelial cells marker (CD-31) by immunohistochemistry (IHC). MATLAB code was used to estimate the optimal 3D alignment of MRI images and histological slice.Results & Discussion
Fig. 1 shows the different MRI sequences used to create the habitats. Pixels in the ADC map that have low values likely have high cellularity, while pixels with high ADCs have low cellularity (Fig. 1d). Low enhancement identifies regions with low vascularization and/or low permeability, while regions with high enhancement can be identified with higher vascularization and permeability. Distinct hypoxic habitats in histology and IHC (Fig 2) were identified, and are corroborated by clusters 2 and 4. Cluster 2 shows low values in ADC (high cellularity) and low enhancement in DCE integral, while cluster 4 also shows low DCE integral and higher values in ADC than cluster 2 (Fig. 2a-b). The MRI and histological images show some differences in the shape, probably because the shrinkage during the tissue fixation process, but qualitatively, the positive staining of pimonidazole showed a similar pattern observed to the hypoxic areas in habitats (Fig. 2e). Areas with high enhancement (clusters green and yellow) (Fig. 2d) showed negative staining to pimonidazole in histology (Fig. 2f). Interestingly, a specific region with high enhancement (green) can be observed in agreement with negative staining for pimonidazole and positive staining for CD-31 (Fig 2g,i).Conclusion
Non-invasive methods to measure spatially dependent differences in vascular perfusion, permeability, cell density, necrotic state that define intratumoral spatial heterogeneity, which can provide relevant information for making decisions during a course of treatment. The identification of habitats using multiple imaging sequences permits the quantification of the intratumoral spatial heterogeneity, which can be qualitatively comparable to histological assessment of hypoxia. Thus, this approach could potentially be used as a non-invasive imaging method for the monitoring of the intratumoral heterogeneity following the therapy in breast cancer.Acknowledgements
This work has been supported in part by an NCI designated Comprehensive Cancer Center (P30-CA076292) and (R01CA077575) and by a scholarship from Fundação de Estado de Pesquisa do Estado de São Paulo, Brazil (2015/18541-3).
References
1. Marusyk A, Almendro V, Polyak K. Intra-tumour heterogeneity: a looking glass for cancer? Nat Rev Cancer. 2012; 12(5):323-34.
2. Kim JY, Gatenby RA. Quantitative Clinical Imaging Methods for Monitoring Intratumoral Evolution. Methods Mol Biol. 2017; 1513:61-81, 2017.
Figures