4475
Intratumoral vessel evaluation using magnetic resonance micro-angiography with a vascular pool Gd-DOTA-dendron liposomal contrast agent1Department of Molecular Imaging and Theranostics, National Institute of Radiological Sciences, National Institutes for Quantum and Radiological, Chiba, Japan, 2Radiology and Radiation Oncology, Graduate School of Medicine, Tokushima University, Tokushima, Japan, 3Graduate School of System informatics, Kobe University, Hyogo, Japan, 4Graduate School of Engineering, Osaka Prefecture University, Osaka, Japan, 5Graduate School of Medicine, Nagoya University, Aichi, Japan
Synopsis
Evaluation of the intratumor environment, such as cell distribution and vessel structure, are important for understanding the characteristics of tumors. In particular, the vessel structure and its permeability is critical for the malignant potential of the tumor and drug-targeting. The purpose of this work was to non-invasively visualize intratumoral vessels using MR micro-angiography (MRmA) and a liposomal contrast agent having long blood half-life. In addition, we tried to identify differences in the vascular structures for Colon26 and SU-DHL6 cells. The proposed method visualized the intratumoral vessels clearly and revealed differences in the structure depending on the cell type.
Purpose
The purpose of this work was to non-invasively visualize intratumoral vessels using MRmA and a liposomal contrast agent having long blood half-life. In addition, we tried to identify differences in the 3D vascular structures for Colon26 and SU-DHL6 cells using MRmA and histology.Methods
Six to ten week old female BALB/c nude mice (n = 3) and NOGTM mice (n = 3, Central Institute for Experimental Animals, Japan) were used. Colon26 cells were subcutaneously grafted into the BALB/c nude mice and malignant lymphoma cells (SU-DHL6) were subcutaneously grafted into the NOGTM mice. To enhance the vasculature in the tumor, Gd-DOTA-Dendron liposomes (GadolisomeTM, DS pharma biomedical, Japan) were employed as reported in previous work1. MRIs were obtained using a preclinical 7.0-Tesla scanner with a cryogenic radiofrequency coil. MRmA was acquired using a FLASH sequence with 50 µm3 isotropic resolution (TR/TE = 15/2.5 ms, FOV = 12.8 mm × 12.8 mm × 12.8 mm, Matrix = 256 × 256 × 256; Flip Angle = 20˚, NEX = 3, Scan Time: 36 min 51 sec). To check the tumor anatomy, multislice T2-weighted images were acquired with a RARE sequence (TR/TE = 3000/40 ms, FOV = 19.2 mm × 19.2 mm, Matrix = 256 × 256, Slice Thickness = 0.75 mm without slice gap; Flip Angle = 90˚, NEX = 4, Scan Time: 4 min 32sec ). Immediately after MRI scanning, the tumors were extracted and stained with HE and CD31 and compared to the MRmA. Student’s t-test with significance level of 0.05 was used for all statistical analysis.Results
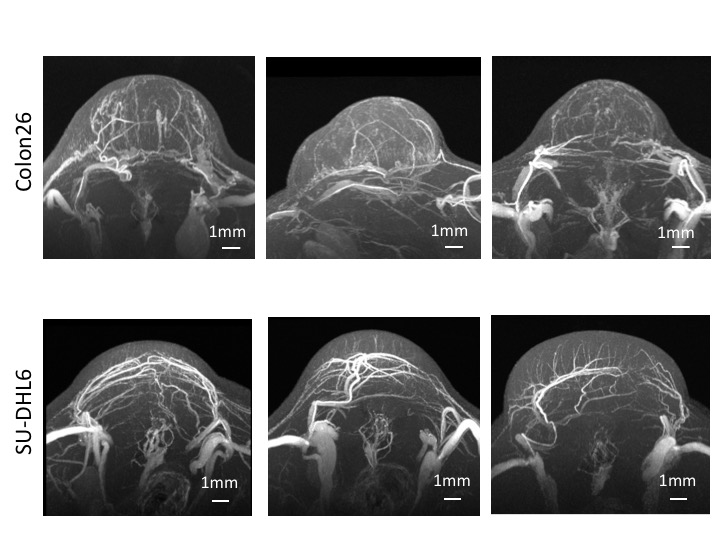
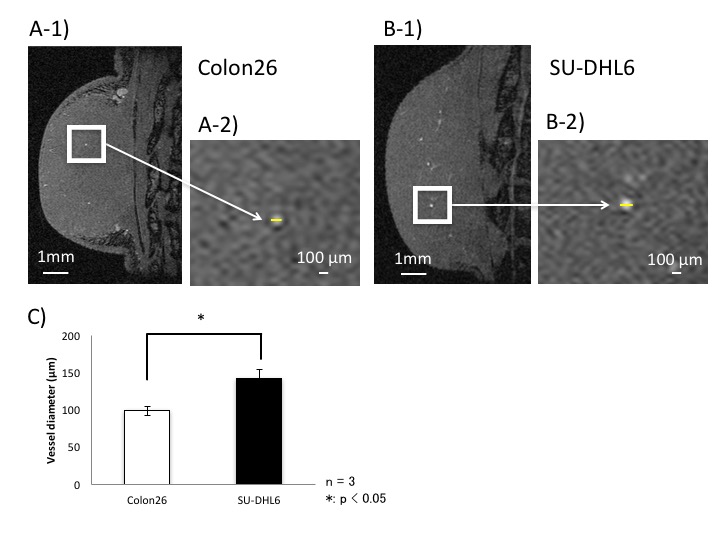
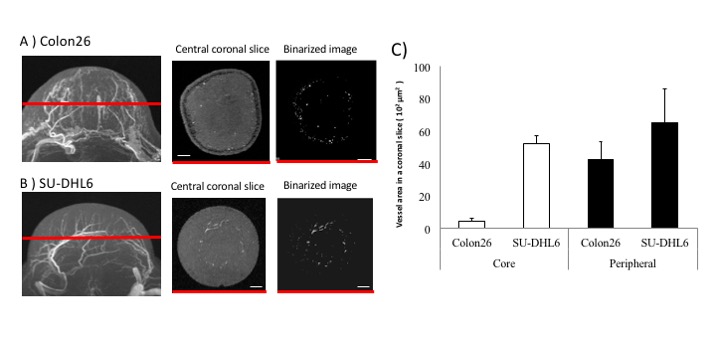
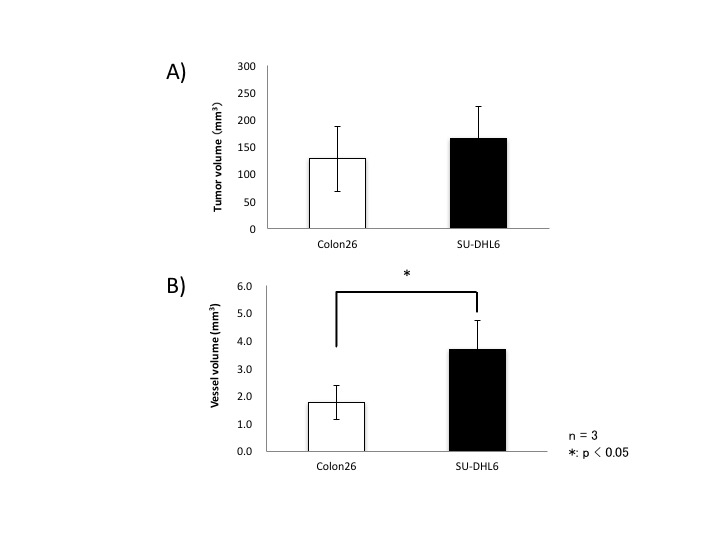
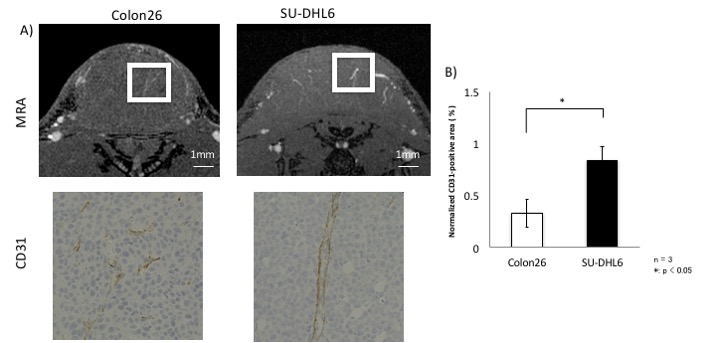
Three maximum-intensity-projection (MIP) images constructed from the MRmA of the Colon26 and SU-DHL6 tumors are shown in Figure 1. The vascular structures are different between the two tumor types. To characterize tumor vessels, we measured the diameter and density of the vessels. Figure 2 presents results for the vascular diameters. The mean Colon26 vessel diameter (99.2 ± 6.3 µm) was significantly smaller than that for SU-DHL6 vessels (142 ± 12.5 µm) (p < 0.05). The distribution of tumor vasculature was analyzed in Figure 3. Blood vessels are relatively sparse in the central core of Colon26 tumors (periphery: 42.4 ± 10.8 mm2 core: 4.42 ± 1.67 mm2). In contrast, the vasculature is more uniformly distributed in SU-DHL6 tumor (periphery: 65.4 ± 20.3 mm2, core: 52.2 ± 5.1 mm2). There was no statistical difference between the volumes of the Colon26 (128 ± 60 mm3) and SU-DHL6 (166 ± 60 mm3) tumors (Fig. 4A). The vessel volume for SU-DHL6 tumor (3.68 ± 1.06 mm3) was significantly bigger than that for Colon26 tumor (1.76 ± 0.6 mm3) (Fig. 4B[IA1] ). The vascular endothelium was also evaluated using CD31 immunostaining (Fig. 5B). The normalised CD31-positive area of SU-DHL6 tumor (0.835 ± 0.135 %) was significantly larger than that of Colon26 tumor (0.334 ± 0.09 %), which agrees with the MRmA evaluation (Fig. 5E).Discussion
Three-dimensional 50 µm isotropic MRmA with Gd-DOTA dendron liposomal contrast agent was obtained for Colon26 and SU-DHL6 tumor grafted mice models. Differences in blood vessel diameter and intratumor vascular density between each tumor type were evaluated. Our method was able to non-invasively visualize the intratumoral vessels. In addition, it was possible to identify differences in the 3D vascular structures between Colon26 and SU-DHL6 cells. The method will be useful for monitoring tumor proliferation, drug delivery and therapeutic efficacy in the future.Conclusion
Our proposed method was able to clearly visualize intratumoral vessels and reveal differences in the structure depending on the cell type. Understanding and observation of the intratumor vessel distribution in vivo is important for high precision evaluation of tumor characteristics, prediction of nanoparticle drug delivery, and prediction of treatment efficacy2.Acknowledgements
This research was partly supported by the COI (Center of Innovation) stream by the Council for Science, Technology and Innovation, Cabinet Office, Japan.References
1. Kono K, Nakashima S, Kokuryo D, Aoki I, Shimomoto H, Aoshima S, et al. Multi-functional liposomes having temperature-triggered release and magnetic resonance imaging for tumor-specific chemotherapy. Biomaterials 2011;32(5):1387-95.
2. Bennett KM, Jo J, Cabral H, Bakalova R, Aoki I. MR imaging techniques for nano-pathophysiology and theranostics. Adv Drug Deliv Rev 2014;74:75-94.
Figures