4474
Metabolic reprogramming in a relevant IDH1-mutated human glioma xenograft model1Radiology and Nuclear Medicine, Radboud university medical center, Nijmegen, Netherlands, 2Pathology, Radboud university medical center, Nijmegen, Netherlands
Synopsis
Understanding metabolic aberrations in IDH-mutated gliomas requires xenograft models growing in a relevant tissue microenvironment and resembling its human genetic counterparts. We performed in vivo 1H MRSI of human-derived oligodendroglioma xenograft models to map lactate and total choline concentrations. Lactate levels were significantly lower and total choline higher in mutated tumor tissue compared to non-tumor brain in the same animal, or to its wild-type counterpart model. This outcome was correlated with expression levels of enzymes and transporters in both lactate- and phospholipid-related metabolic pathways. The findings point to a metabolic reprogramming of aerobic glycolysis and lipid synthesis by the IDH1 mutation.
Introduction
Isocitrate dehydrogenase (IDH) mutation has become a key element in the diagnosis of gliomas and the associated metabolic network a potential treatment target. For non-invasive detection of IDH mutations and to understand metabolic reprogramming, MR spectroscopy is an important approach. The patient-derived oligodendroglioma mouse brain xenograft model E478 carries the IDH1R132H/WT mutation and closely resembles the genetic make-up and diffuse infiltrative phenotype of the tumor it was derived from1. Previously, we demonstrated increased phosphocholine compound levels in this model2. 1H MR spectroscopic imaging has been used in spatial metabolic profiling of IDH mutated gliomas in humans, but not in relevant brain xenografts.
In this study we applied 1H MRSI to obtain spatially resolved metabolite maps of the mouse brain with IDH1R132H/WT mutated E478 gliomas, focusing on the assessment of lactate and total choline (tCho) levels with wild type counterpart model E434 as control. Outcome of these studies was correlated to transcript levels of genes encoding the relevant metabolic enzymes and transporters.
Materials and Methods
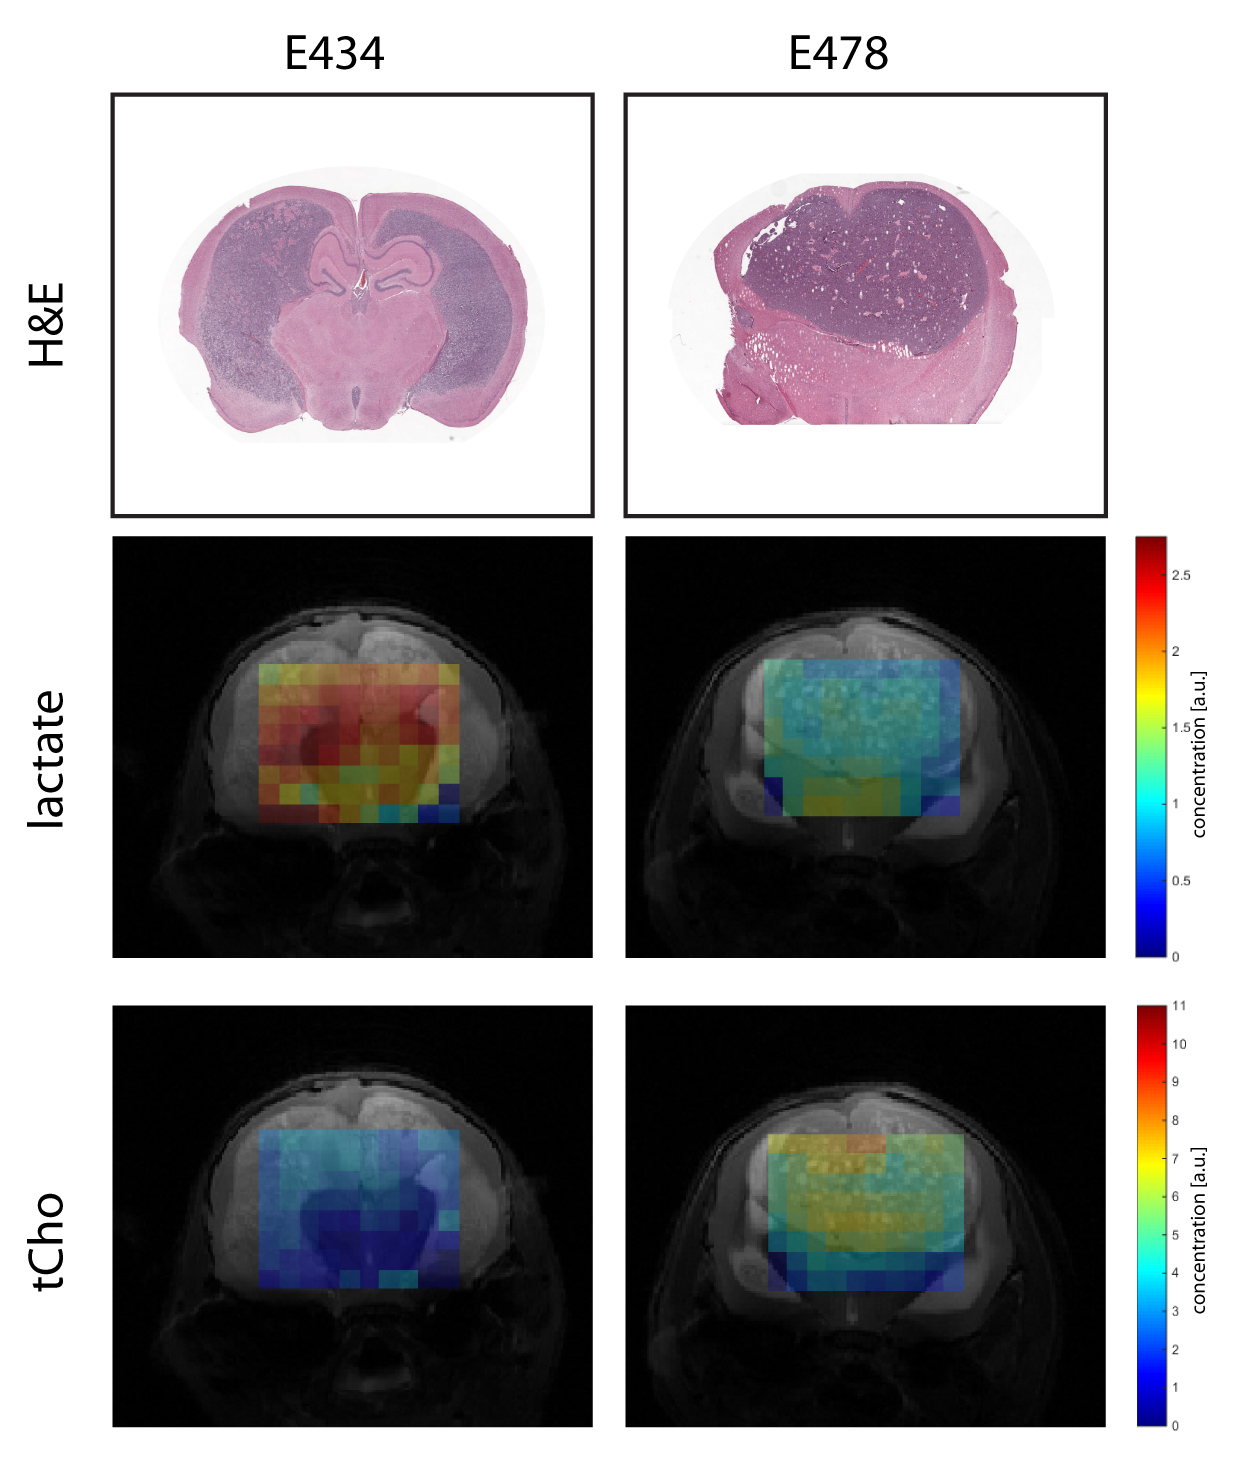
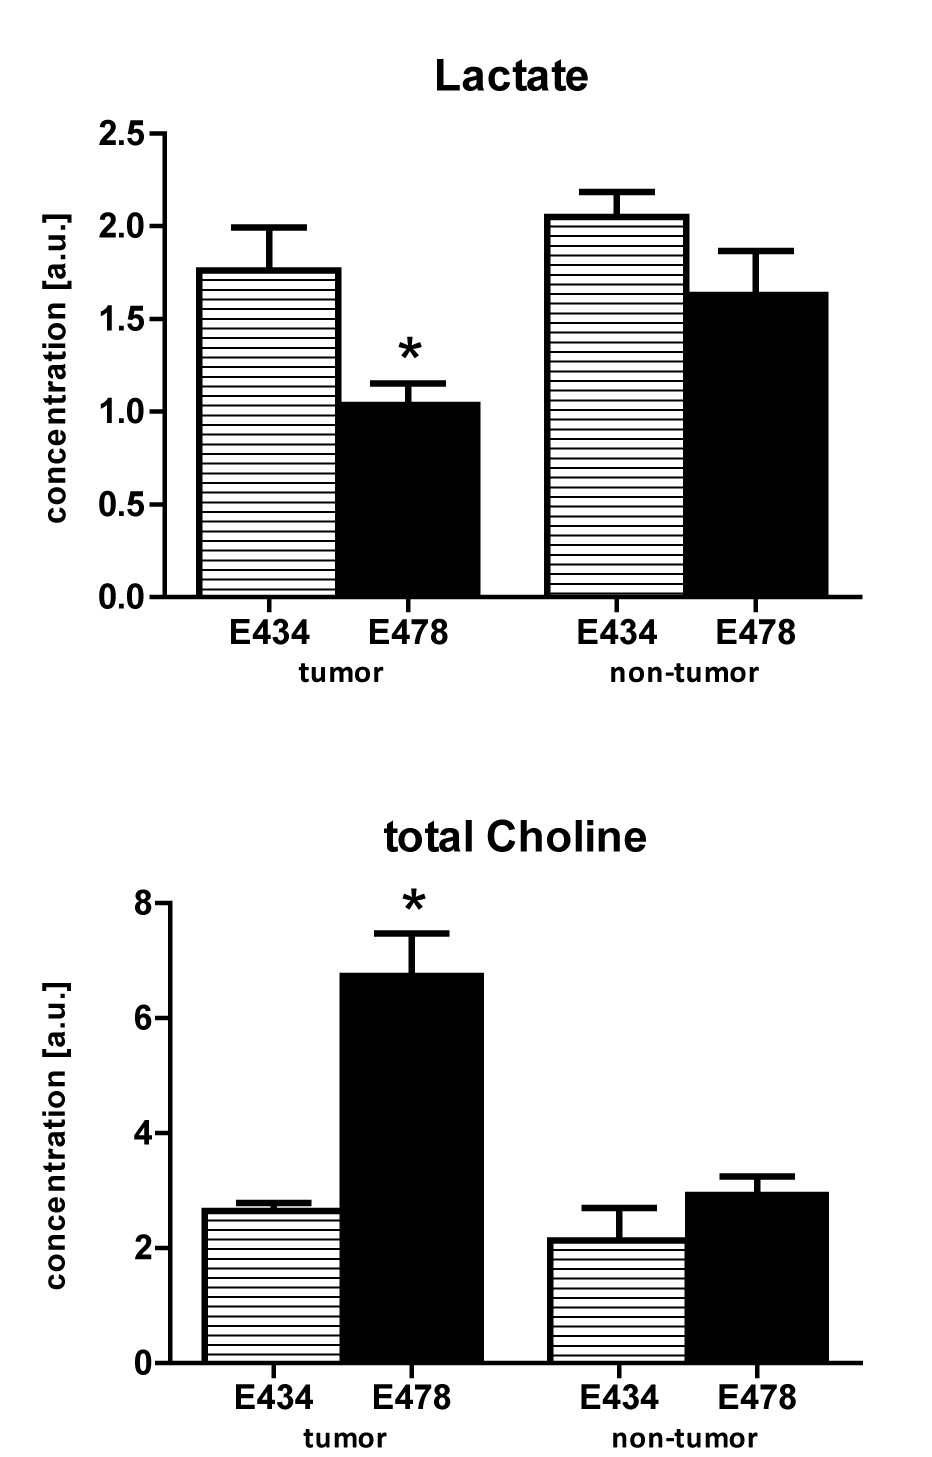
All experiments were approved by the National Animal Research Authority. Patient-derived high-grade oligodendroglioma xenografts (E434 IDH1WT/WT and E478 IDH1R132H/WT) were injected intracerebrally in female Balb/c-nu/nu mice1. Anesthetized animals (n=3 for each group) were investigated on a 7T MR system (ClinScan, Bruker) with a mouse brain receive-coil. Multi-slice T2-weighted images were made in three directions parallel to the MRSI grid. 3D MRSI was performed with semi-LASER using 12x12x16 elliptical weighted phase encoding interpolated to 16x16x16. The 11x11x16mm FOV contained 0.85mm3 nominal voxels, TE=144ms, TR=1500ms, TA=27m55s. After the measurement animals were sacrificed and brains were formalin-fixed and paraffin embedded for histology assessment with H&E staining. Spectra were fitted with LCmodel using a simulated basis set. Metabolite levels were calibrated to the water signal from a separate scan and mapped to the anatomical images. For statistical analysis multiple voxels containing either tumor or normal brain were selected guided by T2-weighted images, histology and a Cramér-Rao lower bound fit value <20. Significant differences in mean values were evaluated with unpaired t-tests (p<0.05).
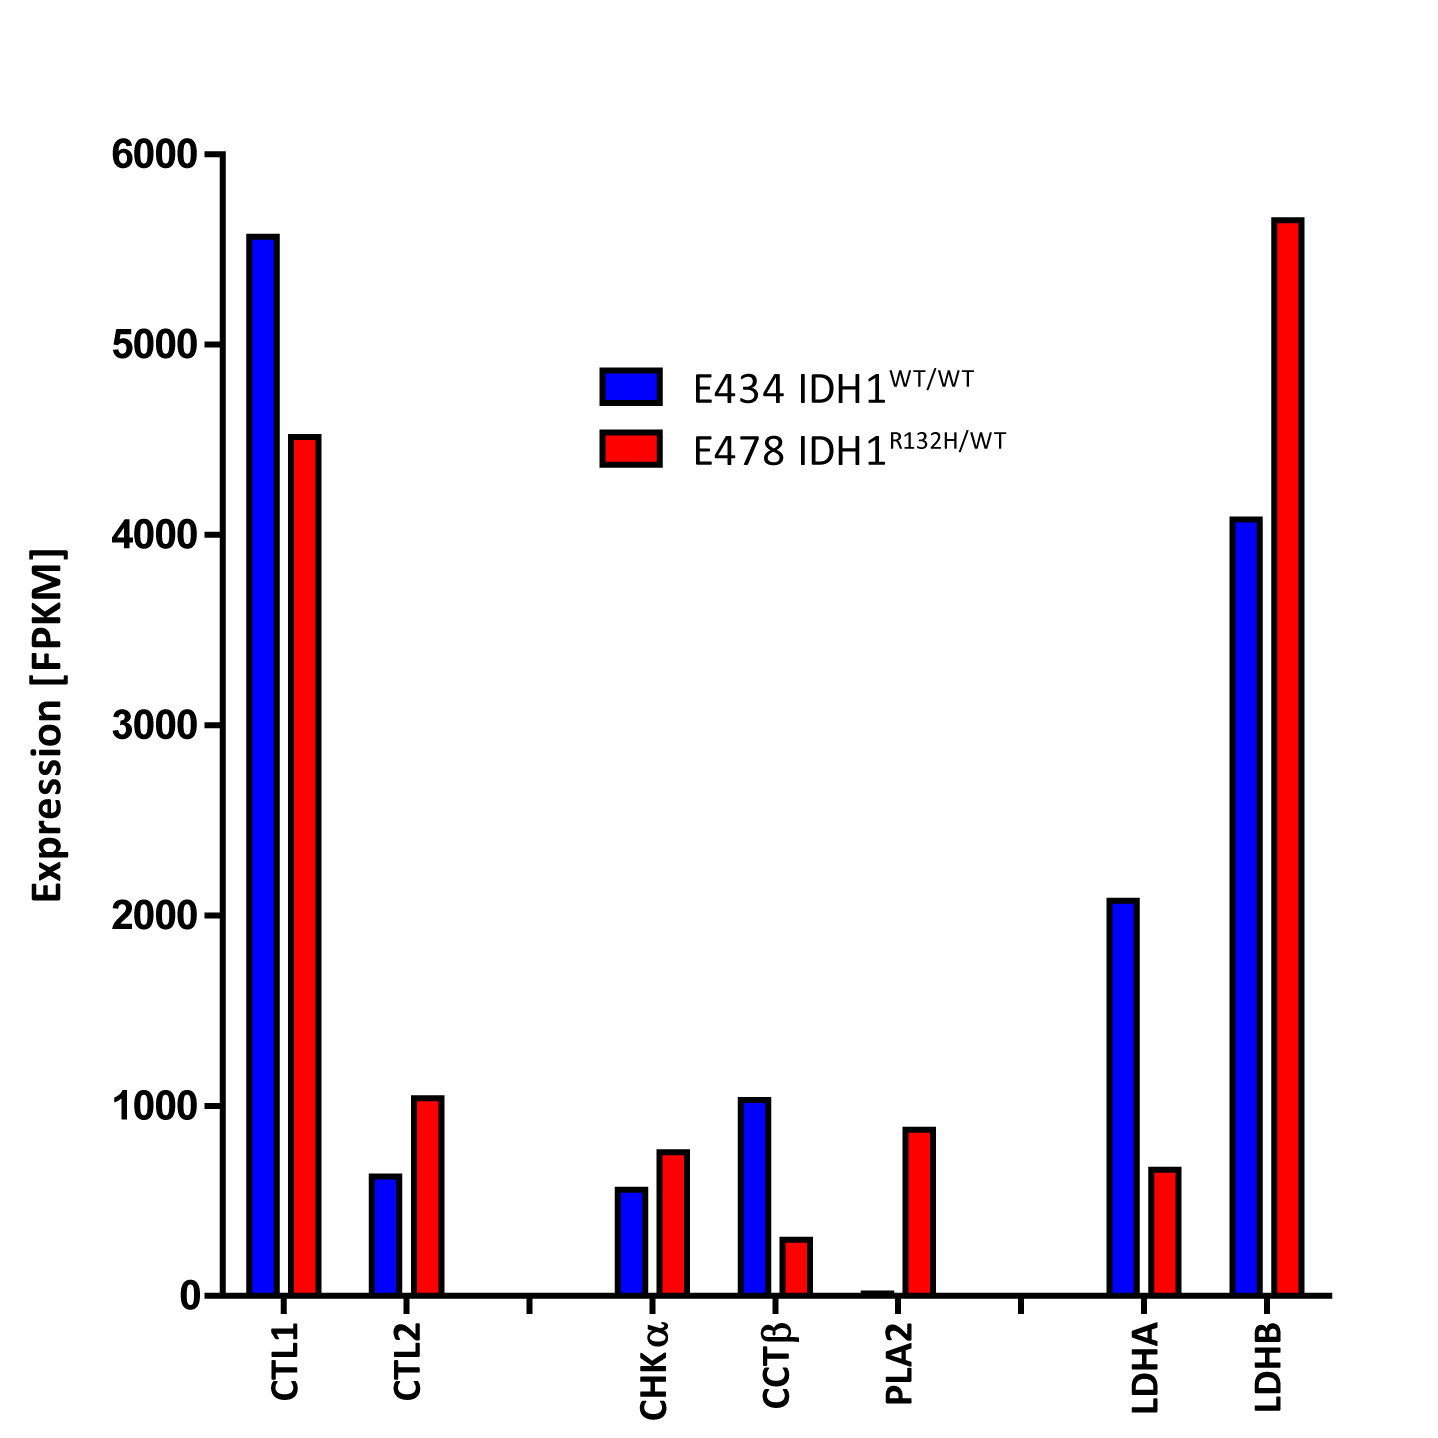
RNA isolated from frozen sections of E478 and E434 xenografts was subjected to next gen sequencing (ServiceXS, Leiden) and yielded 30-50 million reads per sample (single end sequencing protocol). The dataset was analyzed with the Tuxedo protocol3. Mouse reads were filtered from the data prior to data mapping against the RefSeq human genome (hg19).
Results
Metabolic maps of steady state lactate pools showed decreased lactate concentrations in IDH1WT/R132H tumor tissue compared to IDH1WT/WT mice (Fig1). Surrounding non-tumor tissue in IDH1WT/R132H did not have significantly different lactate levels compared to either tumor and normal brain tissue of IDH1WT/WT animals. Similarly, tCho concentrations were significantly increased in IDH1WT/R132H tumor tissue compared to all other selected regions (Fig2).
RNA-seq analysis revealed decreased LDHA expression and increased LDHB expression in IDH1WT/R132H compared to IDH1WT/WT (Fig3). Cytidylyltransferase beta (CCTβ) and choline transporter-like protein1 (CTL1) expression were decreased and phospholipaseA2 (PLA2) and CTL2 increased. No evident increase was observed in expression of choline kinase-alpha (CHKα). Expression of other choline transporters was low in both models.
Discussion and Conclusion
We assessed the spatially resolved choline and lactate levels in tumorous and healthy brain by in vivo 1H-MRSI. The increase of tCho in the E478 IDH1R132/WT glioma is in line with our previous 31P MRS observation of increased glycerolphosphocholine (GPC) and slightly increased phosphocholine (PC)2, with in vivo MRS studies of human IDH1 mutated tumors4,5 and by ex-vivo MRS showing GPC and PC increases6. This seems to contrast with IDH1 mutations in U87/NHA and HOG cells in which PC is decreased7,8, although HOG cells do show increased GPC. Our findings of altered choline pathway enzymes and transporters expression may explain the choline compound increases.
The observation of near normal lactate levels in E478 IDH1R132/WT and increased lactate in E434 IDH1WT/WT are in line with in vivo studies of 13C hyperpolarized pyruvate-to-lactate conversion in the BT142 patient-derived IDH1 mutant glioma model9. The decrease in the expression of LDHA in E478 IDH1R132/WT is also in agreement with findings in BT142 glioma10.
Altogether our findings point to a consistent metabolic reprogramming of aerobic glycolysis and lipid synthesis by the IDH1 mutation in gliomas. The agreement of our results with clinical observations in patients stresses the applicability of E478 as a relevant in vivo IDH1R132H/WT glioma model for further preclinical examinations.
Acknowledgements
No acknowledgement found.References
1. Navis, A. C. et al. Increased mitochondrial activity in a novel IDH1-R132H mutant human oligodendroglioma xenograft model: in situ detection of 2-HG and alpha-KG. Acta Neuropathol Commun 1, 18 (2013).
2. Esmaeili, M. et al. IDH1 R132H Mutation Generates a Distinct Phospholipid Metabolite Profile in Glioma. Cancer Res 74, 4898–4907 (2014).
3. Trapnell, C. et al. Differential gene and transcript expression analysis of RNA-seq experiments with TopHat and Cufflinks. Nat. Protoc. 7, 562–78 (2012).
4. Bisdas, S. et al. MR spectroscopy for in vivo assessment of the oncometabolite 2-hydroxyglutarate and its effects on cellular metabolism in human brain gliomas at 9.4T. J. Magn. Reson. Imaging (2016). doi:10.1002/jmri.25221
5. Pope, W. B. et al. Non-invasive detection of 2-hydroxyglutarate and other metabolites in IDH1 mutant glioma patients using magnetic resonance spectroscopy. J Neurooncol 107, 197–205 (2012).
6. Elkhaled, A. et al. Magnetic Resonance of 2-Hydroxyglutarate in IDH1-Mutated Low-Grade Gliomas. Sci. Transl. Med. 4, 116ra5-116ra5 (2012).
7. Viswanath, P. et al. Choline metabolism is reprogrammed differently in mutant IDH1 cells. in ISMRM (2016).
8. Reitman, Z. J. et al. Profiling the effects of isocitrate dehydrogenase 1 and 2 mutations on the cellular metabolome. Proc. Natl. Acad. Sci. U. S. A. 108, 3270–3275 (2011).
9. Chaumeil, M. M. et al. Hyperpolarized 13C MR imaging detects no lactate production in mutant IDH1 gliomas: Implications for diagnosis and response monitoring. NeuroImage Clin. 12, 180–189 (2016).
10. Chesnelong, C. et al. Lactate dehydrogenase A silencing in IDH mutant gliomas. Neuro. Oncol. 16, 686–95 (2014).
Figures