4473
The Metabolic Secretome of Cachexia Inducing Pancreatic Ductal Adenocarcinoma1JHU ICMIC Program, Division of Cancer Imaging Research, The Russell H. Morgan Department of Radiology and Radiological Science, The Johns Hopkins University School of Medicine, Baltimore, MD, United States, 2Experimental Therapeutics and Metabolism Program, McGill University Health Center, Montreal, QC, Canada, 3Sidney Kimmel Comprehensive Cancer Center, The Johns Hopkins University School of Medicine, Baltimore, MD, United States
Synopsis
Tumor interstitial fluid (TIF) contains the secretome of cancers that can impact most phenotypic aspects of cancer. One characteristic phenotype of pancreatic ductal carcinoma (PDAC) is its ability to induce profound weight loss or cachexia through a multifactorial syndrome that affects multiple organs. To understand the interaction between cancer cells and body organs, here, for the first time, we have characterized the metabolomic profile of TIF from cachexia and non-cachexia inducing pancreatic cancer xenografts and identified clear differences in the metabolic secretome between cachexia inducing and the non-cachexia inducing tumors.
Introduction:
Cachexia is an underexplored and yet devastating consequence of cancer that is the cause of 20% of all cancer related deaths [1]. Cachexia inducing tumors cause a ‘wasting away’ of the body. The condition is associated with poor treatment outcome [2], fatigue, and extremely poor quality of life [2-3]. Because of the multi-factorial characteristics of this condition, it has been difficult to understand the mechanisms driving the impact of the tumor on body organs and the sequence of events that leads to this lethal condition. Here we have used 1H MRS to characterize the metabolic profile of TIF obtained from noncachexia (Panc1) and cachexia inducing (Pa04C) tumors to further understand the impact of the deranged metabolism of cachexia-inducing tumors on the metabolic secretome.Methods:
The human pancreatic cancer cell line, Panc1, was obtained from ATCC. The human pancreatic cancer cell line, Pa04C, was provided by Dr. Maitra [4]. Six to 8 week old male SCID mice were inoculated in both the right and left flank with cancer cells (5×10⁶, Panc1 N=2, Pa04C N=2). We created a collection chamber to collect TIF. The chamber was implanted together with small tumor pieces harvested from the subcutaneous flank tumors, into the subcutaneous flank space of SCID mice (Panc1 N=8 and Pa04C N=6) until the tumor encompassed the chamber (4-5 weeks). The tumor was then removed and the tumor tissue and TIF were collected. To obtain control TIF, an empty chamber was implanted in the subcutaneous flank space of healthy mice. Dual phase solvent extraction was performed on tumor tissue. The water phase was separated, freeze dried, reconstituted in D2O PBS for spectral acquisition. All 1H MR spectra were acquired on an Avance III 750 MHz (17.6T) Bruker NMR spectrometer equipped with a 5 mm broad band inverse (BBI) probe. 1H MR spectra with water suppression were acquired using a single pulse sequence with the following experimental parameters: spectral width of 15495.86 Hz, data points of 64 K, 90° flip angle, relaxation delay 10 sec, acquisition time 2.11 sec, 64 scans with 8 dummy scans, receiver gain 80.6. Spectral acquisition, processing and quantification were performed using TOPSPIN 2.1 software.Results and Discussion:
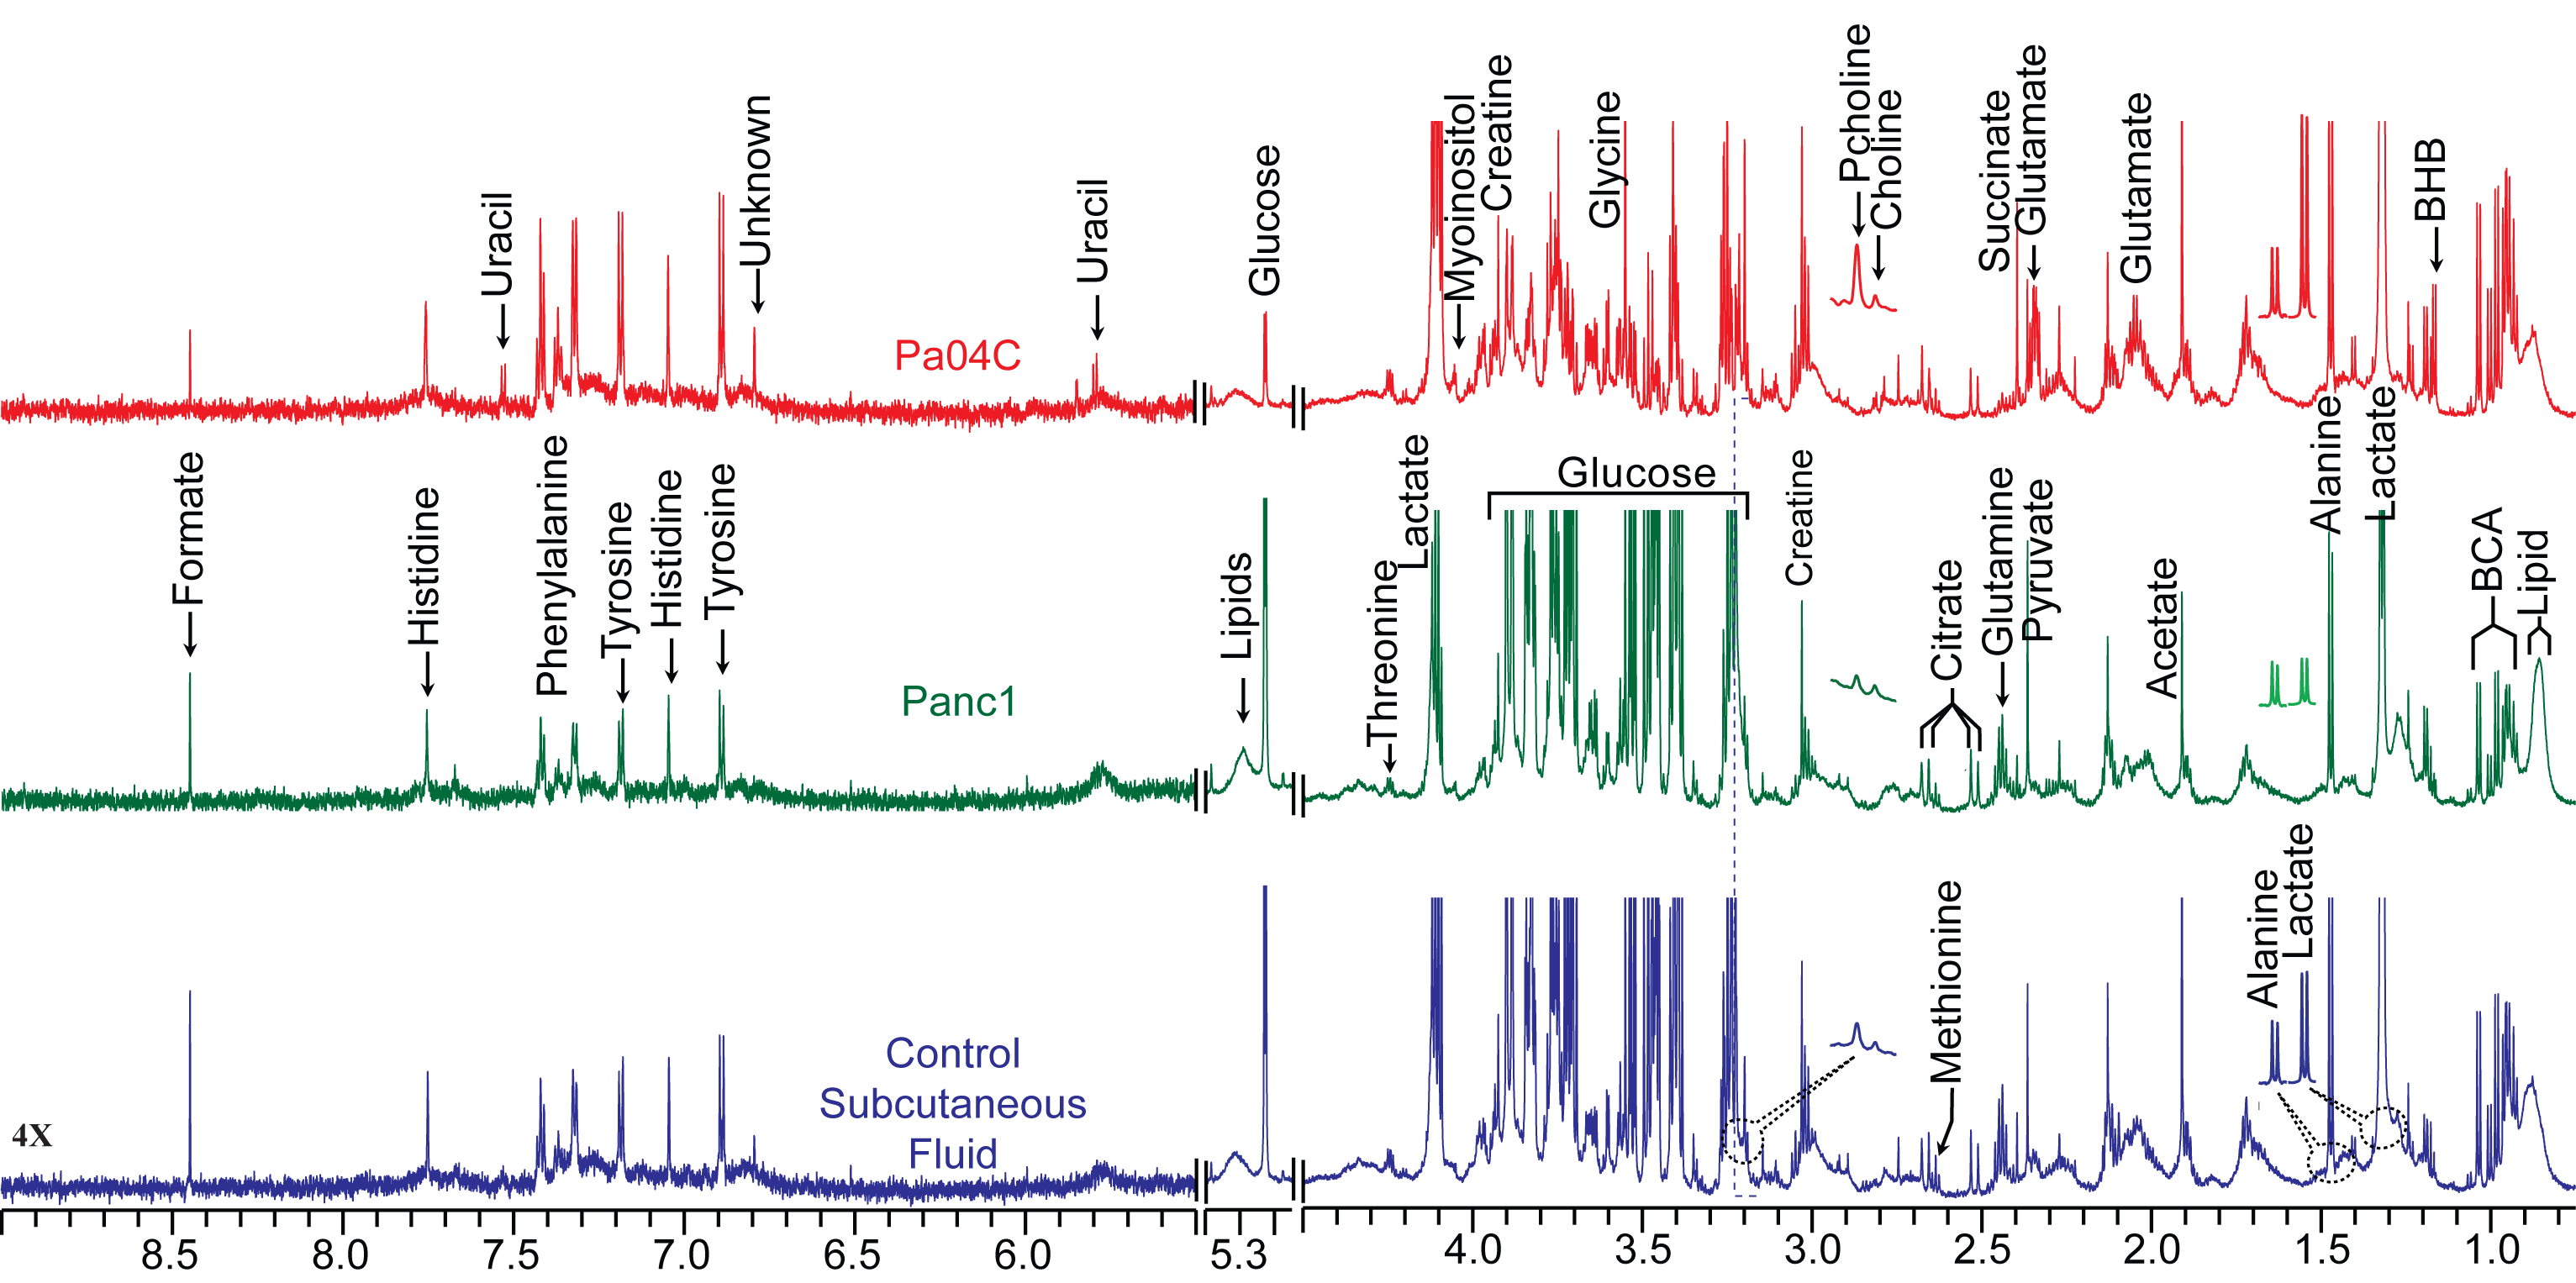
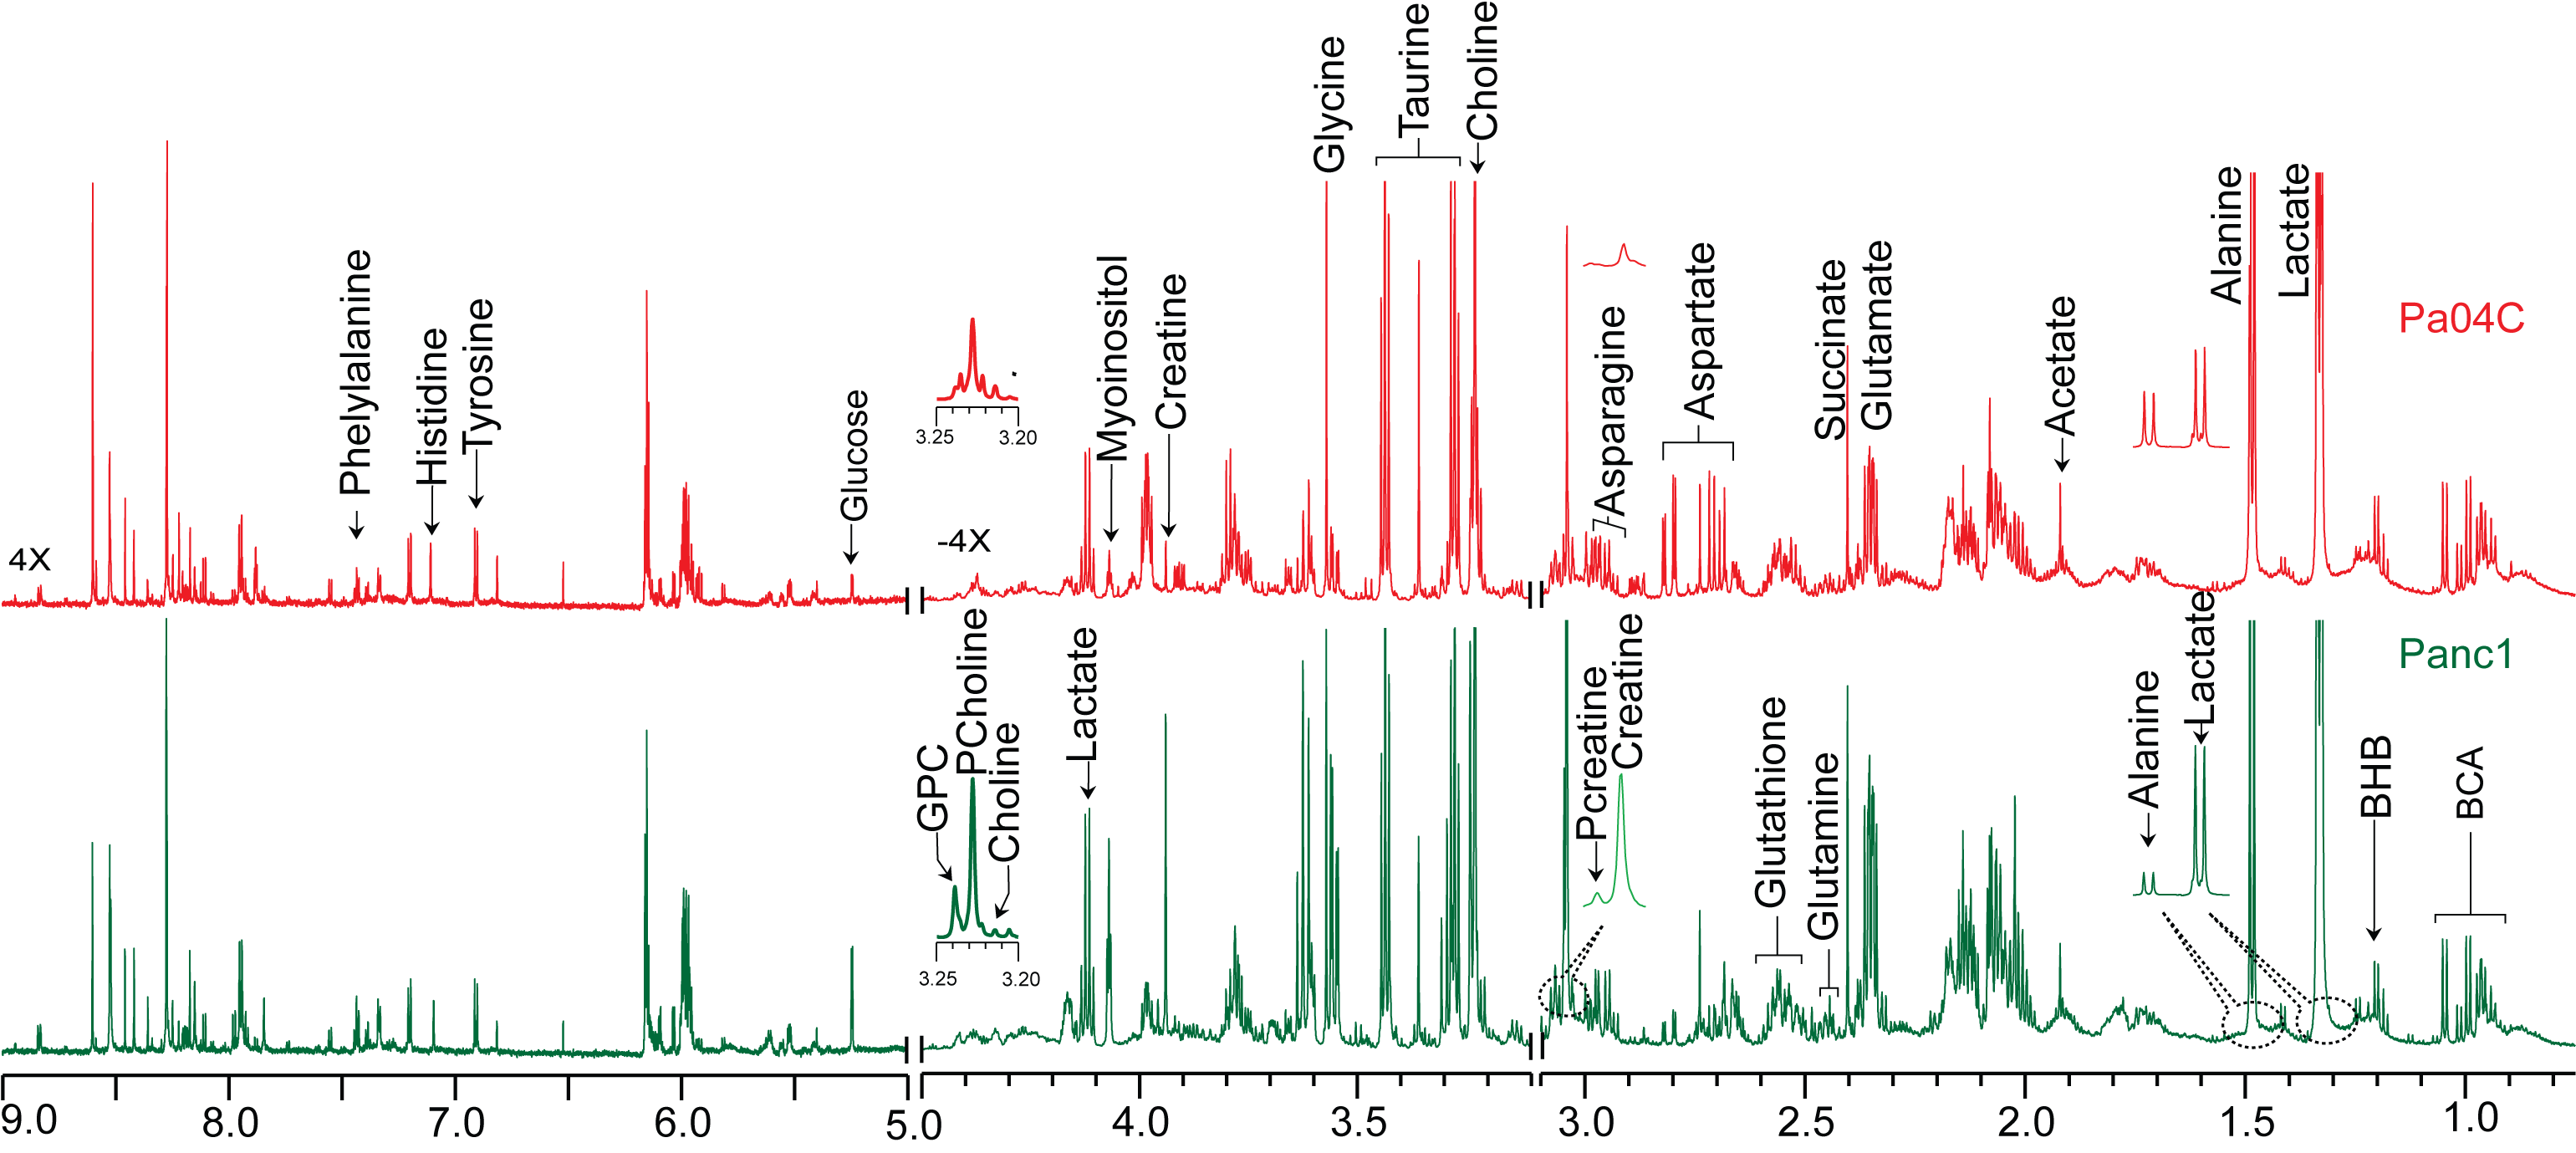
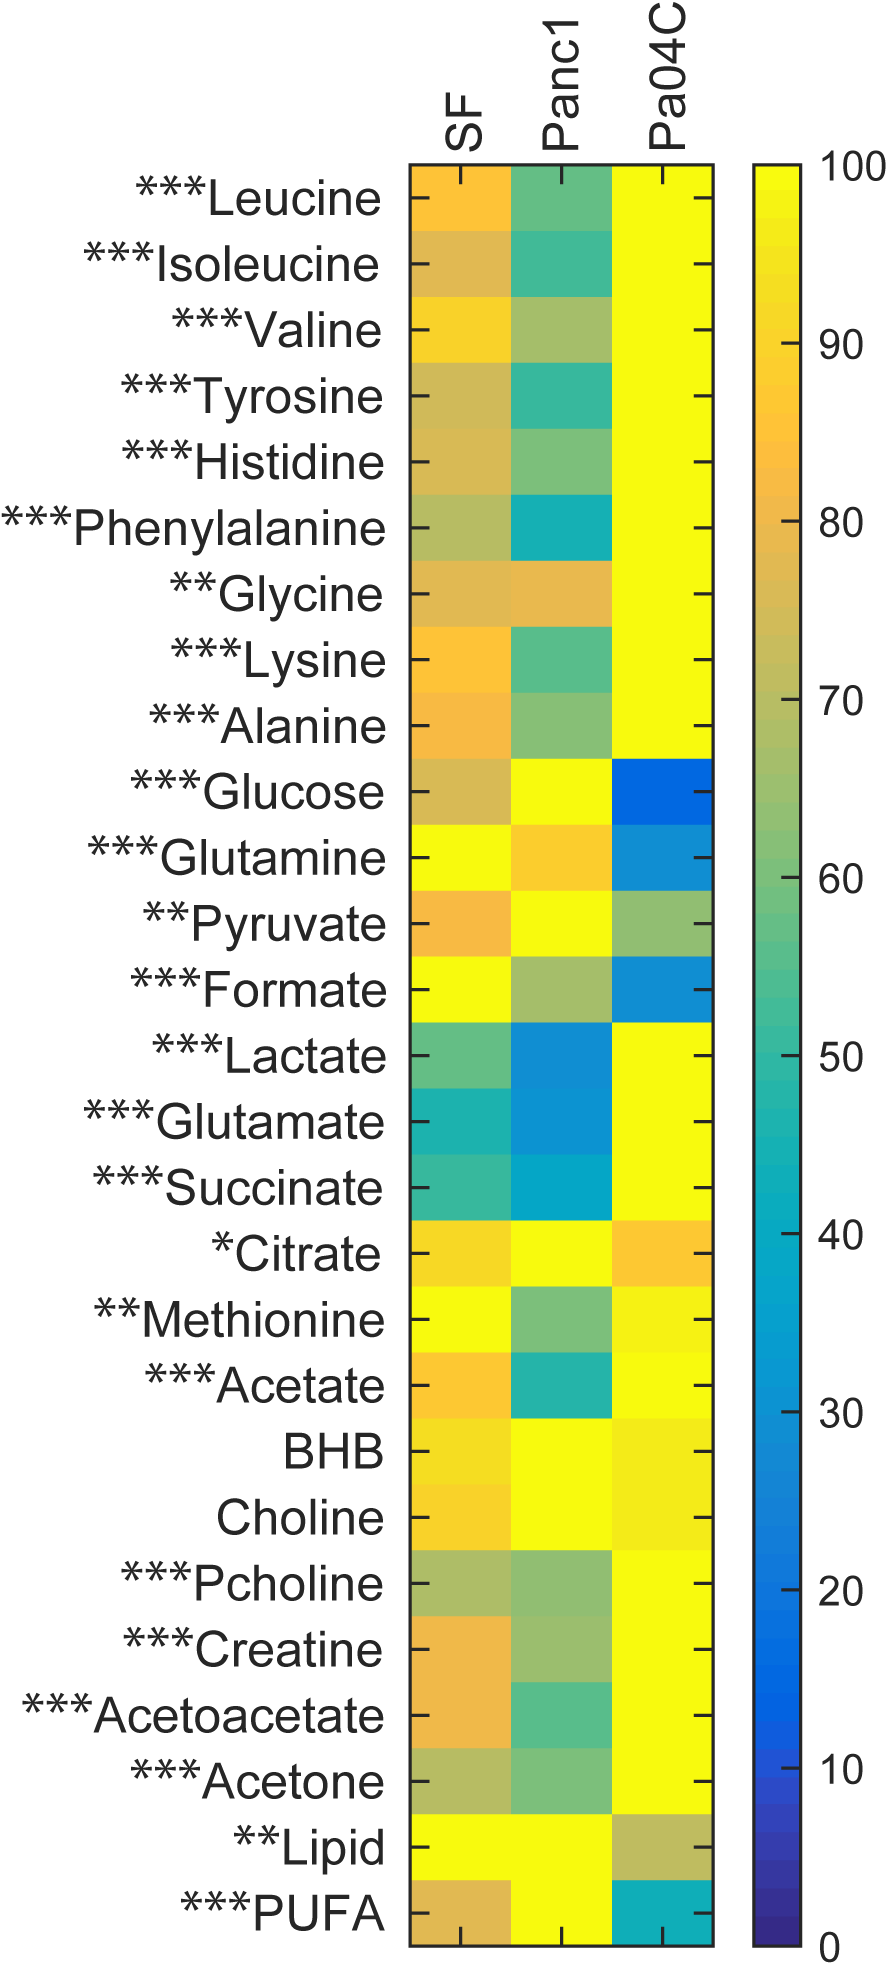
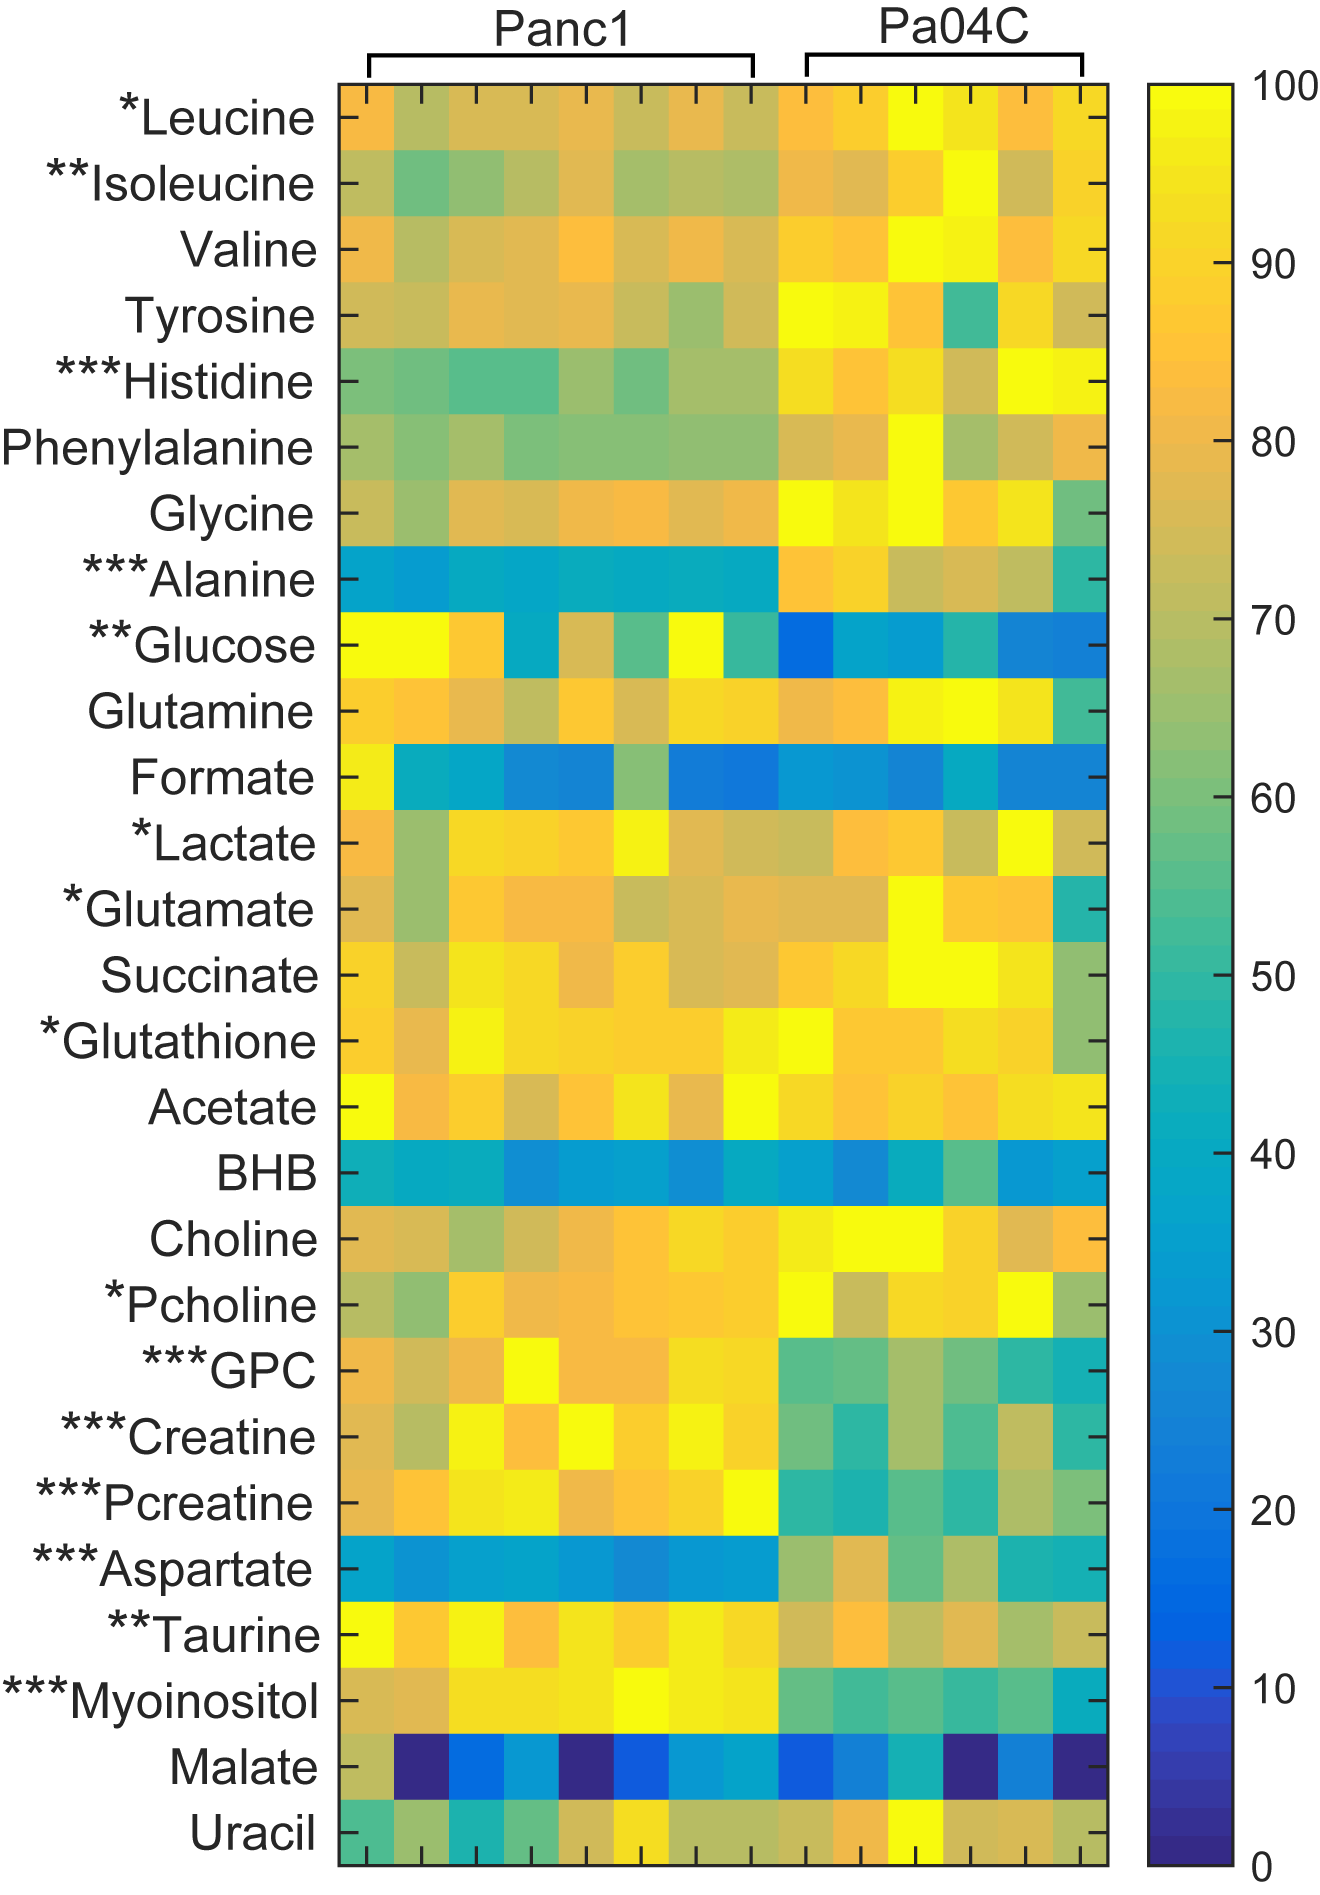
Representative spectra obtained from interstitial fluid collected from normal mice, and from noncachexia inducing Panc1 tumors, and cachexia inducing Pa04C tumors are shown in Figure 1. Representative spectra from Panc1 and Pa04C tumor extracts are displayed in Figure 2. A heat map display of 1H MRS metabolites from normal fluid and Panc1 and Pa04C TIF is presented in Figure 3. A heat map display of 1H MRS metabolites in extracts obtained from eight Panc1 tumors and six Pa04C tumors is presented in Figure 4. Notable differences between Pa04C compared to Panc1 TIF or normal interstitial fluid were a significant decrease of polyunsaturated fatty acids (PUFA) and lipids, and formate, pyruvate, glutamine, and glucose. Lactate, glutamate, succinate, glycine and acetone significantly increased in Pa04C TIF compared to Panc1 TIF or normal interstitial fluid. These differences in TIF cannot be explained solely by the differences in the tumor metabolic profile as shown in Figure 3. Our data provide new insights into changes in the metabolic secretome with induction of cachexia that may shed new light on the cachexia cascade, and identify metabolic strategies to reverse the syndrome.Acknowledgements
This work was supported by NIH R01 CA193365, NIH P50CA013175 and NIH P30CA06973.References
1. Argiles, JM.et. al., Nature reviews. Cancer 2014, 14 (11), 754-62.
2. Ozola ZI et. al., Pancreatology 2015, 15 (1), 19-24.
3. Fearon, KC et. al., HPB (Oxford) 2010, 12 (5), 323-4.
4. Penet, MF et. al., Clinical Cancer Res 2015, 21 (2), 386-95.
Figures