4471
Probing tumor metabolism using dynamic lactate chemical exchange saturation transfer MRIPuneet Bagga1, Mohammad Haris2, Pranav Jain1, Alekya Bheemreddy1, Francesco Marincola2, Hari Hariharan1, and Ravinder Reddy1
1Department of Rediology, University of Pennsylvania, Philadelphia, PA, United States, 2Research Branch, Sidra Medical and Research Center, Doha, Qatar
Synopsis
Lactate CEST (LATEST) MRI method has been shown to be applicable in detecting and imaging changes in the lactate level in human subjects post heavy exercise and to measure the lactate in a mouse model of lymphoma. In this study, LATEST was implemented to probe the lactate dehydrogenase (LDH) activity in vivo in a rat glioma model. Following the administration of pyruvate, the LATEST contrast is elevated in the tumor region while it is unaltered in the unaffected region.
Introduction
Cancer cells usually reprogram the cellular metabolism to meet the energy demand. Most cancers heavily rely on glycolysis for the energy production and proliferation1,2. As a result, the level of lactate present in the tumor is often affected and may be implicated in disease progression and clinical outcome. To monitor and image the lactate production in cancer through the Warburg effect, an imaging technique with high sensitivity and spatial resolution is required. Recently, Lactate CEST imaging (LATEST) method has been used to probe changes in the lactate level in human subjects post heavy exercise and to measure the lactate in a mouse model of lymphoma3. In this study, LATEST was implemented to probe the lactate dehydrogenase (LDH) activity in vivo in a rat glioma model.Materials and Methods
Syngeneic female Fisher F344/NCR rats were used to generate a glioma model as described previously4. MRI experiments were performed on 9.4T MRI scanner (Agilent, USA) on rats injected with F98 glioma cells intracranially 3 weeks prior. Tumor-bearing rats were maintained under 1-1.5% isoflurane in O2, supplied at 1 L/min. During the course of the experiment, the body temperature was maintained at 37º C. T2 weighted imaging was performed for the coronal sections of the brain to locate the tumor region. The LATEST sequence parameters were: slice thickness=3 mm, GRE flip angle=5º, GRE readout TR=5.6 ms, TE=2.7 ms, FOV=30×30 mm2, matrix size=128×128, number of averages=4. LATEST images from 0 to ±1.5 ppm (step size 0.25 ppm) were collected at 1.17 µT saturation pulse power (B1) and saturation duration of 4s. B0 correction on the LATEST images was performed by acquiring WASSR images at 0.24 μT from -1 to +1 ppm in steps of 0.1 ppm. LATEST maps were computed using the equation CESTasym (%) = 100 × [(S-ve – S+ve)/S0], where S-ve and S+ve are the B0 corrected MR signals acquired while saturating at –0.5 ppm and +0.5 ppm from water resonance, while S0 is the image obtained with the application of saturation pulse at 100 ppm. The LATEST contrast map was further corrected for any B1 inhomogeneity. Following the acquisition of the baseline LATEST, sodium pyruvate (200 mM) was delivered through a tail vein at a variable rate using a syringe pump. During the infusion of pyruvate, the CEST acquisitions were performed over a period of 100 minutes.Results and Discussion
Anatomical image of glioma in a rat brain is shown in Fig 1a. Baseline LATEST map from the tumor region is clearly depicting higher LATEST contrast (~2.5%) than the normal appearing brain region (~2%). This difference is presumably due to the higher LDH expression in the tumor tissue. Additionally, the baseline LATEST contrast of 2-2.5% may arise from the m-inositol5 and other metabolites containing hydroxyl protons6,7. Following the infusion of pyruvate, the LATEST signal increased in the tumor region (Fig. 1c) while no appreciable change in the LATEST signal was observed in the normal appearing brain region. Average asymmetry plots from the tumor region (Fig. 2a) pre- and post- pyruvate infusion showed an increase in the LATEST contrast post infusion which centered ~0.5ppm downfield from water. The asymmetry plots from the normal appearing brain region showed no change in the LATESTasym following the infusion of pyruvate suggesting that normal brain region may not convert the pyruvate into lactate due to the lower LDH activity (Fig 2b). The finding suggests that the dynamic changes in lactate levels in the tumor can be mapped using the LATEST method. Since the LDH activity is associated with the tumor malignancy the LATEST method may be used as in vivo biomarker of tumor malignancy. The technique can be further explored to monitor the efficacy of various drugs that inhibit LDH enzyme activity.Acknowledgements
This project was supported by the National Institute of Biomedical Imaging and Bioengineering of the National Institutes of Health through Grant Number P41-EB015893 and the National Institute of Neurological Disorders and Stroke through Award Number R01NS087516 and a grant from Sidra Medical and Research Center.References
1. Warburg O Biochem Z (1920) 103:188-217; 2. Heiden MGV et al. Science (2009) 324:1029-33; 3. DeBrosse C et al. Sci Rep (2016) 6:19517; 4. Kim S et al. NMR Biomed (2008) 21:208-16; 5. Haris M et al. Neuroimage (2011) 54:2079-85; 6. Walker-Samuel S et al. Nature Med (2013) 19:1067-72; 7. Chan KW et al. Magn Res Med (2012) 68:1764-73Figures
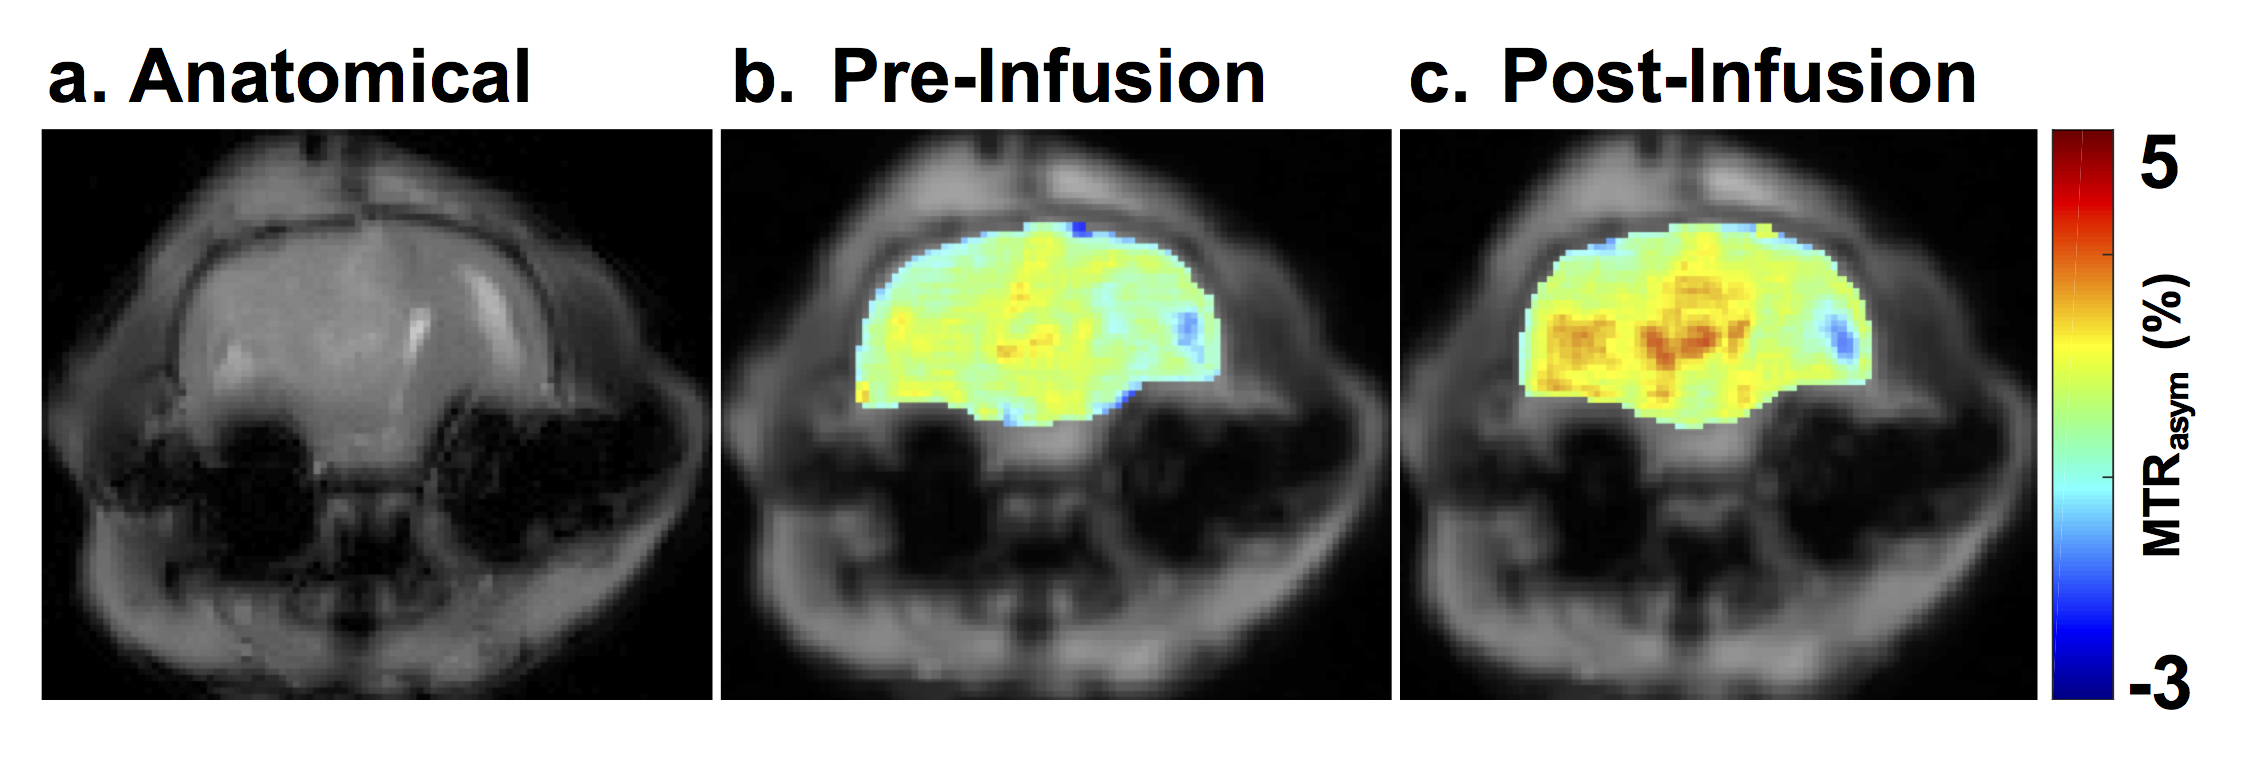
Anatomical and LATEST image of glioma in a rat brain. a) T2 weighted anatomical scan of the slice containing glioma b) B0 corrected LATEST map of the anatomical slice evaluated at 0.5 ppm using B1 1.17 μT and 4s prior to pyruvate infusion c) LATEST map measured following pyruvate infusion showing higher contrast in the tumor region.
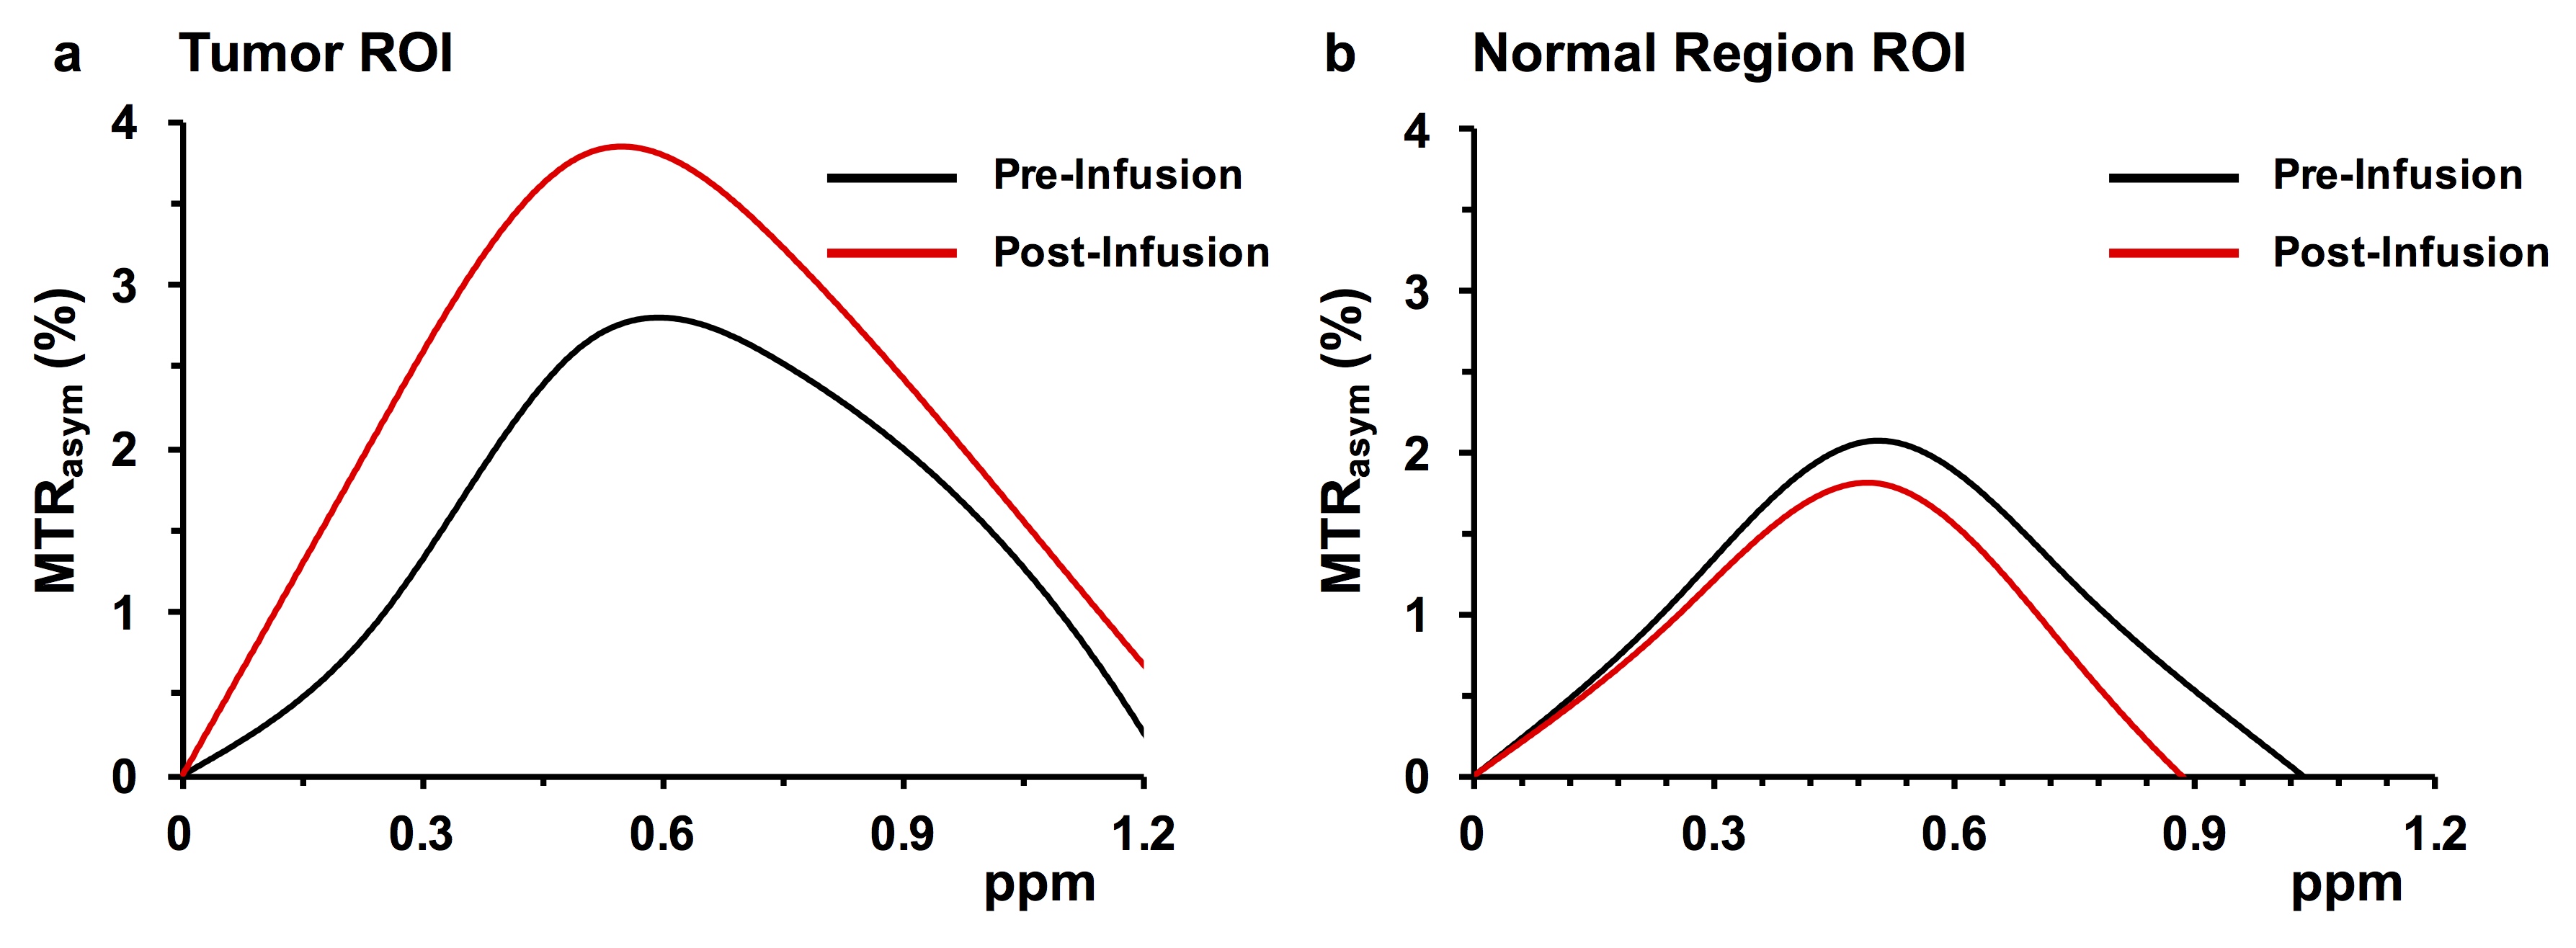
LATEST asymmetry plots in rat brain a) asymmetry plot from the tumor region in rat brain pre and post infusion of pyruvate showing the elevation of CEST at 0.5 ppm due to lactate formation b) asymmetry plot from the unaffected region showing no significant changes.