4469
Cell Nuclear Size and Shape are Associated with ADC, Cellularity, and Histological Class in a Transgenic Mouse Model of Prostate Cancer1Institute of Circulation and Medical Imaging, NTNU - Norwegian University of Science and Technology, Trondheim, Norway, 2Institute of Cancer Research, London, United Kingdom, 3MRI Unit, Royal Marsden Hospital, London, United Kingdom
Synopsis
The relationship between tissue microstructure and ADC is poorly understood in cancer. We identified quantitative nuclear characteristics from haematoxylin, eosin, and saffron stained prostatic histology samples. ADC maps were calculated for transgenic prostate cancer mice and healthy controls. Matched histology images of excised prostates were used to determine cellularity and histological class. ADC and cellularity correlated with a set of nuclear features (describing texture, lightness, radius, and shape), which exhibited mirrored trends, implying an inverse relationship between ADC and cellularity. The same nuclear features correlated with histological class. This will be useful for underpinning relationships between ADC and tissue microstructure.
BACKGROUND:
ADC is a useful tool for cancer diagnosis, but the underlying relationship between ADC and tissue microstructure is poorly understood in cancer. Haematoxylin, Eosin, and Saffron (HES) staining of tissues is commonly performed and clearly depicts cell nuclei. In this study we identified nuclear characteristics from HES histology slides for quantitative cancer diagnosis and staging. The most influential features were determined by independently comparing correlations between nuclear characteristics and histological class, cellularity (derived from histology), and ADC (derived from diffusion-weighted MRI (DWI)); this may provide further understanding of ADC in terms of tissue microstructure.METHODS:
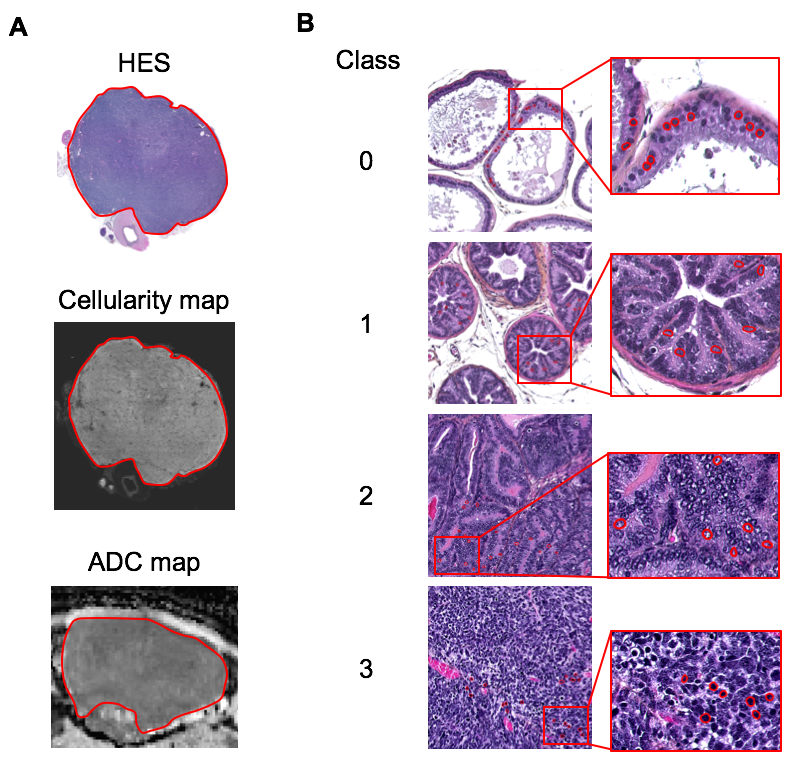
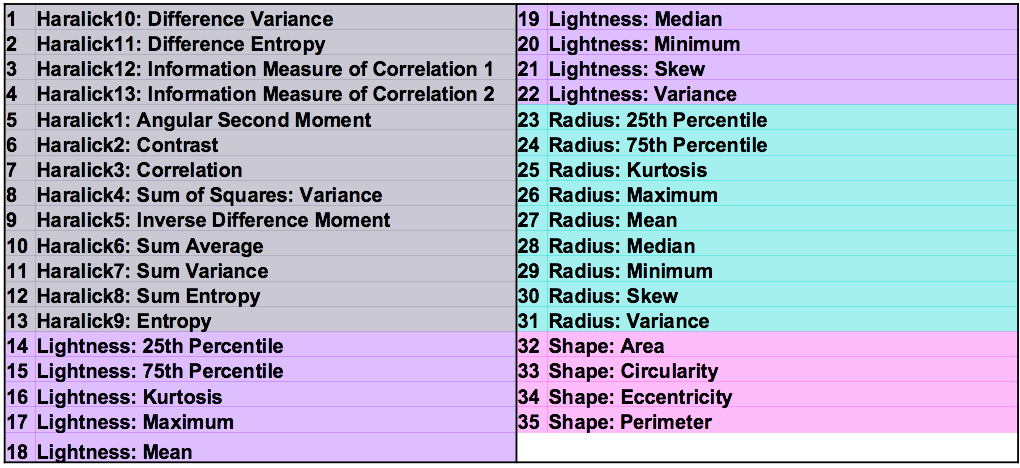
A preliminary analysis was conducted on transgenic prostate cancer mice (TRAMP, n=6) and healthy controls (C57BL/6, n=2) from a larger cohort of 15 mice. Mice were imaged on a Bruker Biospec 7T scanner as previously reported [1]; briefly, multi-shot EPI DWI was performed: TE=28.5ms, TR=3s, averages=4, in-plane resolution=0.2x0.2mm2, slice-thickness=0.99mm, matrix=128x128, b-values=0,100,200,400,800 s/mm2, acquired along three orthogonal directions. ADC maps were calculated using mono-exponential fitting. Following MRI, mice were terminated, prostates were excised and formalin fixed for histology (HES staining). HES slides (digitised at 40x magnification using a NanoZoomer XR scanner (Hamamatsu, Japan)) were visually matched to ADC maps to allow comparisons between the two methodologies (Fig. 1A). Matching ROIs were drawn on ADC maps and histology images; ROIs were classified as the following: class 0 (normal tissue), 1 (prostatic intraepithelial neoplasia (PIN)), 2 (well differentiated cancer), 3 (poorly-differentiated cancer) (Fig. 1B). Cellularity maps were generated from digitised histology images as previously reported [2]. For each ROI, nuclei (n=100) were manually outlined using OsiriX (Pixmeo SARL, Switzerland), HES images were converted into grey-scale lightness images using an RGB-to-LAB image conversion. For each outlined nucleus, 35 features were computed using in-house software [3]: 13 Haralick (texture) features [4], 9 measures of nuclear lightness, 9 statistics of nuclear radius, and 4 shape features (Fig. 2). Texture features were computed using the Mahotas Python library [5] by converting the L-channel into 10 equidistant bins to provide a 10x10 grey-level co-occurrence matrix.
Partial least squares regression (PLSR) was performed to identify whether ADC or cellularity were associated with nuclear characteristics. Partial least squares-discriminant analysis (PLS-DA) was used to build a classification model of all nuclei using histological class as a class label. PLS models were validated by leave-one-animal-out cross validation (CV) and permutation testing.
RESULTS & DISCUSSION:
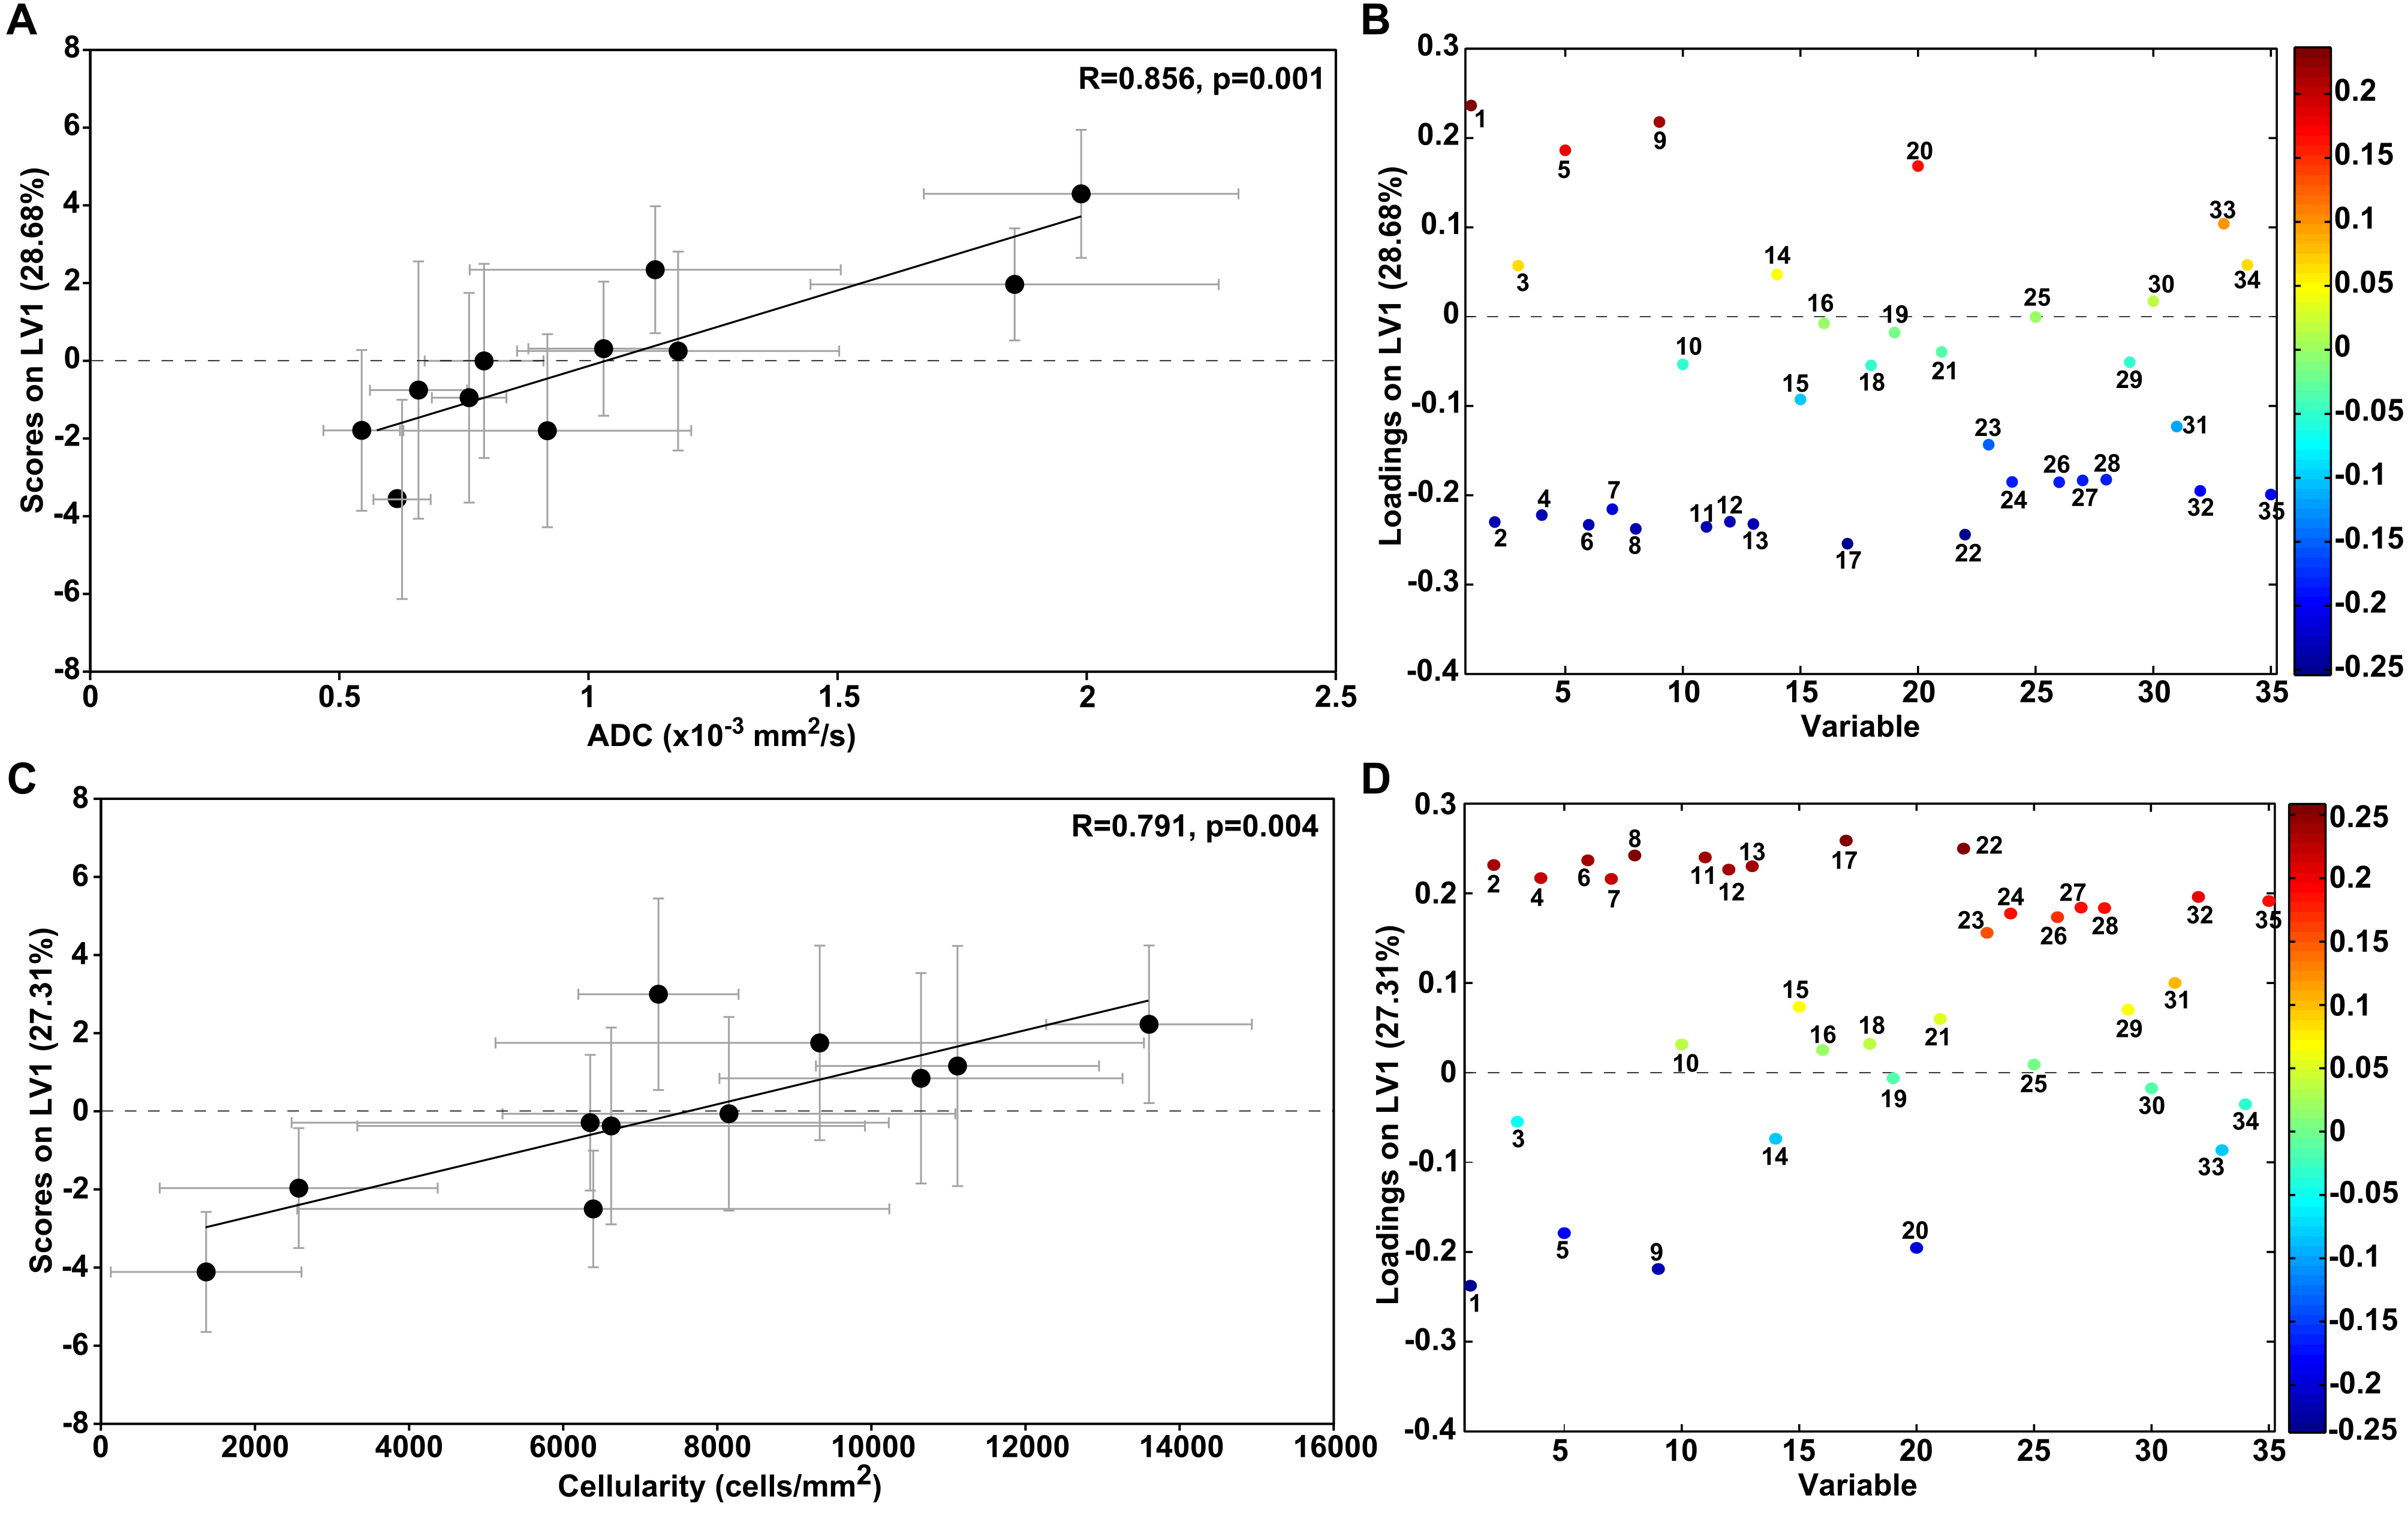
PLSR models for ADC and cellularity achieved a normalised root-mean-square CV error of 0.307 (p=0.001) and 0.291 (p<0.001), respectively. The PLS latent variables (LVs) are linear combinations of nuclear characteristics. Fig. 3A and C show that correlations were found between the means of ADC and LV1 scores of each ROI (R=0.856, p= 0.001) and between means of cellularity and LV1 scores of each ROI (R=0.791, p= 0.004). This implies a clear relationship exists between nuclear features and both ADC and cellularity. The loadings plots identified which nuclear characteristics contributed most significantly to LV1 and whether they were associated with low or high ADC or cellularity. A striking characteristic of Fig. 3B and D is their mirror appearance, which implies that the same nuclear features that are correlated with low ADC (Fig. 3B, negative LV1 loadings) are associated with high cellularity (Fig. 3D positive LV1 loadings) and vice-versa.
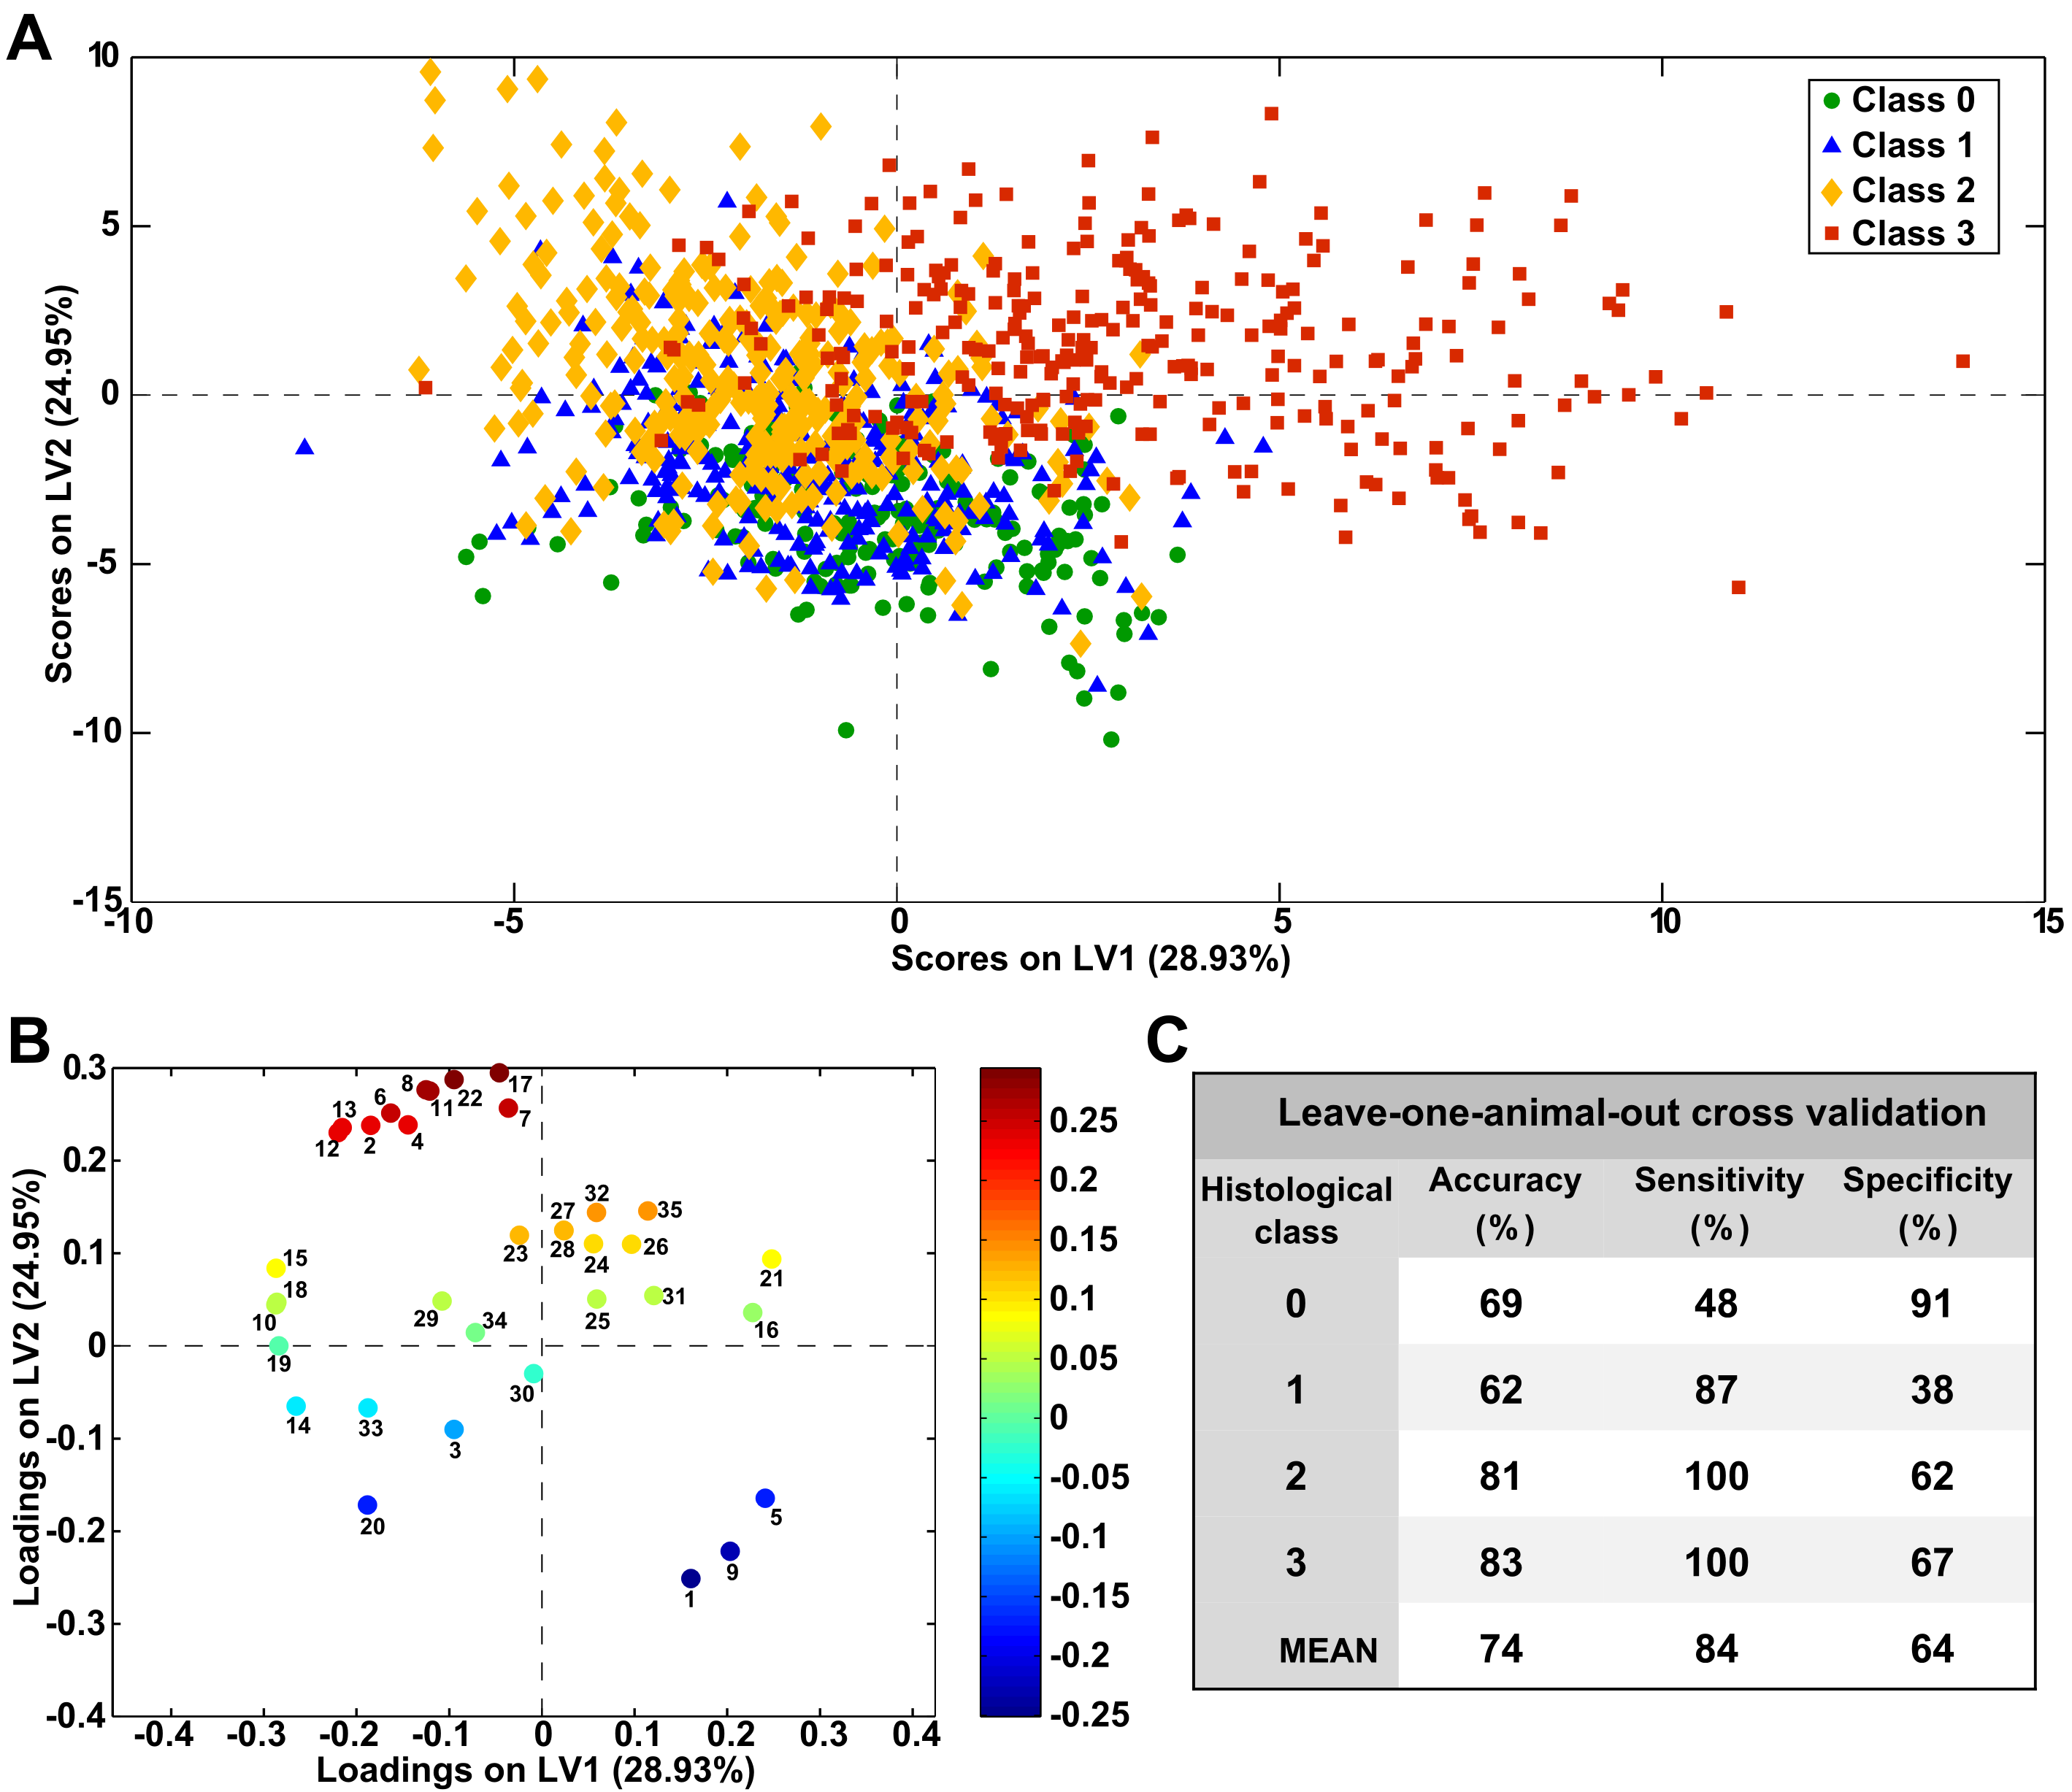
PLS-DA based on nuclear characteristics was used to discriminate each histological class from the rest and had a mean accuracy of 74% (p<0.001) (Fig. 4C). The scores plots showed a separation between histological classes, with class numbers exhibiting an increasing trend with increasing LV2 scores (Fig. 4A); intermediate classes (1 and 2) were separated from extreme classes (0 and 3) along LV1.
The most influential nuclear characteristics were independently identified for the three different approaches (ADC, cellularity, and class), and common features were identified. Features associated with cancer (low ADC, high cellularity, class 2-3) were: larger nuclear area (32), perimeter (35), maximum radius (26), maximum lightness and lightness variance (17,22), and Haralick features (2,4,6,7,8,11,12,13). Healthy tissue and PIN regions (high ADC, low cellularity, class 0-1) were associated with circular nuclei (33 (circularity)), minimum lightness (20), and Haralick features (1,5,9).
CONCLUSION:
A selection of nuclear characteristics was associated with ADC, cellularity, and histological class, where malignancy was associated with larger nuclear size and less circular shape. Nuclear features that independently correlated with both ADC and cellularity were the same and indicated an inverse relationship between ADC and cellularity, in line with previous studies in this model [2]. The nuclear features can be quantified from histology, and will be useful for future studies aimed at underpinning relationships between ADC and tissue microstructure.Acknowledgements
We acknowledge support from the liaison Committee between the Central Norway Regional Health Authority and the Norwegian University of Science and Technology, the Research Council of Norway, CRUK in association with MRC and Department of Health, NHS funding to the NIHR Biomedicine Research Centre. MRI was performed at the MR Core Facility, NTNU, animals were housed at the Comparative Medicine Core Facility, NTNU, and histology performed at the Cellular and Molecular Imaging Core Facility, NTNU.References
[1] Hill, D. K., Kim, E. et al., J. MAGN. RESON. IMAGING 2016;43:1207–1217
[2] Hill, D. K., Heindl, A., et al., Proc. 23rd Ann Mtg ISMRM (2016), 0444
[3] Blackledge, M. D., et. al., Computers in biology and medicine 69 (2016): 203-212
[4] Haralick, R. M., et. al., EEE Transactions on systems, man, and cybernetics 6 (1973): 610-621
[5] Coelho, L., B., arXiv preprint arXiv:1211.4907 (2012)
Figures