4466
Tumor vasculature differs between cell and fragment derived murine orthotopic models of hepatocellular carcinoma1Materials Science and Engineering, University of Michigan at Ann Arbor, Ann Arbor, MI, United States, 2Biomedical Engineering, University of Michigan at Ann Arbor, Ann Arbor, MI, United States
Synopsis
We report the use of semi-quantitative dynamic contrast enhanced (DCE)-MRI to identify differences in the growth and vascular environment seen within two murine hepatocellular carcinoma (HCC) models - cellular orthotopic injection (COI) (representing a traditional tumor model) or surgical orthotopic implantation (SOI) of tumor fragments (representing a patient-derived orthotopic xenograft model, or PDOX). Uptake curves of gadolinium contrast agent indicate differences in vasculature between the two models, highlighting important considerations to be made when trying to use PDOX methods to model HCC in the clinic.
Introduction
Hepatocellular carcinoma (HCC) is the 5th most commonly-occurring cancer worldwide1 and the 2nd highest cause for cancer-related deaths globally.2 While the use of MR for the diagnosis and treatment of HCC in the clinic is undeniably significant,3,4 its application to murine HCC models has been limited due to animal size, equipment costs, and expertise required.5 Recently, the use of patient-derived orthotopic xenograft (PDOX) tumor models in mice has elucidated growth characteristics, vascularization, and metastatic capacity of HCC tissue.6 Here we report the use of semi-quantitative dynamic contrast-enhanced (DCE)-MRI to identify differences in the growth and vascular environment within two murine HCC models, cellular orthotopic injection (COI) (representing a traditional model) or surgical orthotopic implantation (SOI) of tumor fragments (representing a PDOX model). Uptake curves of gadolinium contrast agent indicate differences in vasculature between the two models, highlighting important considerations to be made when trying to use PDOX methods to model clinical HCC.Methods
All animal work was approved by the Institutional Animal Care and Use Committee (IACUC) at the University of Michigan.
Orthotopic tumors: Male, nod scid gamma (NSG) mice (6-10 weeks of age; n=10) were used in this study. Mice were given an immunosuppressive dose of cyclophosphamide 24 hours before tumor inoculation. On the day of surgery, mice were anesthetized and aseptically prepared for a laparotomy. The left lateral lobe of the liver was exposed and either 2.5 x 10⁶ HepG2 cells (prepared 1:1 medium:Matrigel) were injected (n=5), or a 5x5 mm2 tumor fragment (subcutaneously grown in the flank of another mouse) was inserted and immobilized in the liver with surgical glue (n=5). After 2-3 weeks, the animals underwent weekly imaging via MR to assess tumor volume and vascular environment.
Tumor volume: Animals were anesthetized using 2% isoflurane, 1 L/min O2 carrier gas and imaged on a 7T small animal MRI system (Agilent Technologies, CA). Rectal temperature was controlled to within ± 0.2 °C. Tumors were visualized using a coronal 2D fast spin echo (FSE) acquisition: TR/TEeff 2000/20 ms, echo spacing 10 ms, echo train length 8, field of view (30 mm)2, matrix 256x128 zero-filled to 5122, slice thickness 1 mm, NEX 16 (due to respiratory motion). Tumor volume was quantified using semi-automatic thresholding and user verification in Analyze (Analyze Direct).
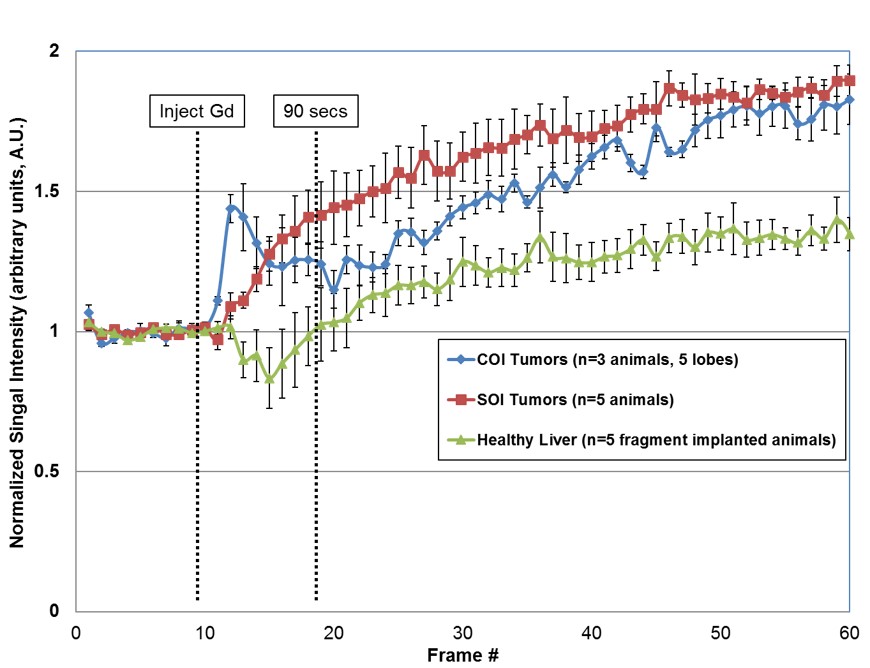
Gd-enhancement: Three to four weeks after implantation, gadolinium (Gd) was used to study vascularization of the tumors. The FSEMS coronal images were used to plan a gradient echo acquisition: 60 frames at one location (1 frame/10 secs), TR/TE 20/3.03 ms, field of view (30 mm)2, flip angle 30o, matrix 1282 zero-filled to 2562, slice thickness 1 mm, NEX 4. Approximately 100 µL of Gd (Magnevist) was administered via a tail vein catheter at ~frame 10. The signal intensity of a region of interest (ROI) in the tumors was quantified for all 60 frames using MRVision (MRVision Co.), normalizing to the average baseline signal intensity in frames 1-9.
Results and Discussion
Tumor-take was 60% and 100% for the COI and SOI models, respectively. Figure 1 illustrates typical COI and SOI tumors at 3-4 weeks. Tumor volume for COI tumors increased from 9.4, 29.9, and 45.3 mm3 at week 3 to 44.6, 113.8 mm3, and 59.2 mm3 at week 4, respectively. The SOI tumors had a varied response with tumor volumes of 228, 285, 151, 150, and 49.9 mm3 at week 2 and volumes of 152, 234, 221, 157, and 157 mm3 at week 3. This data suggests that for some of the SOI animals, the tumor may be necrosing due to inadequate integration with native blood supply.
Gadolinium uptake curves are shown in Figure 2. For the COI group, one animal developed three tumor nodules; thus, n=5 total nodules were used for the curve. Evaluating semi-quantitative DCE-MRI metrics in the first 90 seconds after injection: wash-in slope was 0.070 and 0.016 AU/sec for COI and SOI tumors, respectively. This was more strongly driven by a reduced time to peak for COI tumors (COI ~ 20 secs v. SOI ~ 90 secs), whereas maximum enhancement was nearly the same for both models (~1.4). Based on these measurements, the COI tumors have increased vascular density and/or permeability, with their uptake curve shape associated with malignancy.7
Conclusion
It is well established that the blood supply to a tumor is a major factor in growth and metastasis, as well as drug delivery. With the increasing use of PDOX models, it is critical to understand if, how, and when the implant is well integrated into the local vascular network and how that represents, or not, the human condition.Acknowledgements
The authors would like to thank the National Science Foundation Graduate Research Fellowship (S.P. Kuruvilla) and the Rackham Merit Fellowship at the University of Michigan (S.P. Kuruvilla, C.A. Crouch).References
1. Singal, A. G. & Marrero, J. A. Recent advances in the treatment of hepatocellular carcinoma. Curr. Opin. Gastroenterol. 26, 189–195 (2010).
2. Ferlay, J. et al. GLOBOCAN 2012 v1.0, Cancer Incidence and Mortality Worldwide: IARC CancerBase. No. 11 [Internet]. Lyon, France: International Agency for Research on Cancer. 11, http://globocan.iarc.f (2013).
3. Ryder, S. Guidelines for the diagnosis and treatment of hepatocellular carcinoma (HCC) in adults. Gut 52, iii1–iii8 (2003).
4. Willatt, J. M., Hussain, H. K., Adusumilli, S. & Marrero, J. a. MR Imaging of hepatocellular carcinoma in the cirrhotic liver: challenges and controversies. Radiology 247, 311–330 (2008).
5. Lee, T. K., Na, K. S., Kim, J. & Jeong, H. J. Establishment of Animal Models with Orthotopic Hepatocellular Carcinoma. Nucl. Med. Mol. Imaging (2010). 48, 173–179 (2014).
6. Hoffman, R. M. Patient-derived orthotopic xenografts: better mimic of metastasis than subcutaneous xenografts. Nat. Rev. Cancer 15, 451–452 (2015).
7. Barnes, S. L., Whisenant, J. G., Loveless, M. E. & Yankeelov, T. E. Practical dynamic contrast enhanced MRI in small animal models of cancer: data acquisition, data analysis, and interpretation. Pharmaceutics 4, 442–78 (2012).
Figures