4465
Histology-Derived pseudo-ADC correlates with measured ADC and extranuclear space in a transgenic model of prostate cancer, identifying contribution of luminal space to measured ADC.1Division of Radiotherapy and Imaging, The Institute of Cancer Research, London, United Kingdom, 2MRI Unit, The Royal Marsden NHS Foundation Trust, Sutton, United Kingdom, 3Division of Molecular Pathology & Centre for Evolution and Cancer, The Institute of Cancer Research, London, United Kingdom, 4Institute of Circulation and Medical Imaging, NTNU - Norwegian University of Science and Technology, Trondheim, Norway
Synopsis
In this preclinical study we investigate the utility of in-silico simulations of the pseudo-apparent diffusion coefficient (pADC) of water within extra-nuclear regions segmented on large field-of-view haematoxylin, eosin, and saffron (HES) slides from a transgenic mouse model of prostate cancer. We demonstrate that pADC is correlated within in-vivo measurements of the apparent diffusion coefficient (ADC) measured by diffusion-weighted magnetic resonance imaging and may thus be used as a surrogate for exploring the effect of tissue structure on measured ADC values. Furthermore, we demonstrate that ADC is correlated with fractional space occupied by lumen, derived from semi-automatic segmentation of HES slides.
Background
The biological basis of the apparent diffusion coefficient (ADC) as measured by diffusion-weighted imaging is poorly understood in cancer. Previous studies have demonstrated a correlation between ADC and cellular density (number of cells per unit area) measured from whole-slide histological specimens in a preclinical model of prostate cancer1. The prostate is a glandular structure containing luminal fluid-filled spaces; water diffusion occurs more freely in these spaces compared to surrounding cellular regions and the presence of luminal spaces may contribute to higher tissue ADC values2. In this study we demonstrate that in silico simulations of the diffusing trajectories of molecules within haematoxylin, eosin, and saffron (HES) stained slides from whole-prostate can be used to investigate the relationship between the structural properties of the underlying tissue (such as cellularity, luminal space, and extranuclear fraction) and the ADC value measured by MRI. From simulation we derive a histological pseudo-Apparent Diffusion Coefficient (pADC) and quantify the relationship with luminal space, estimated from segmentation of HES samples, and MR-derived ADC.Materials and Methods
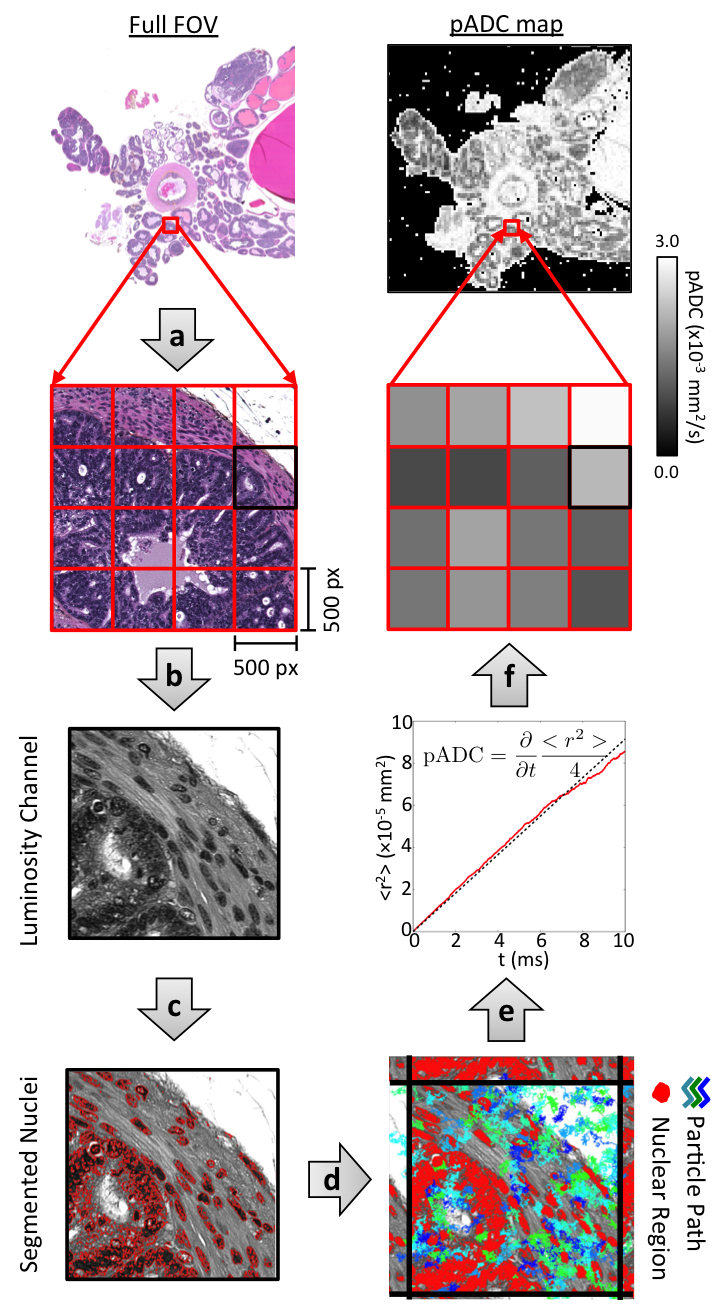
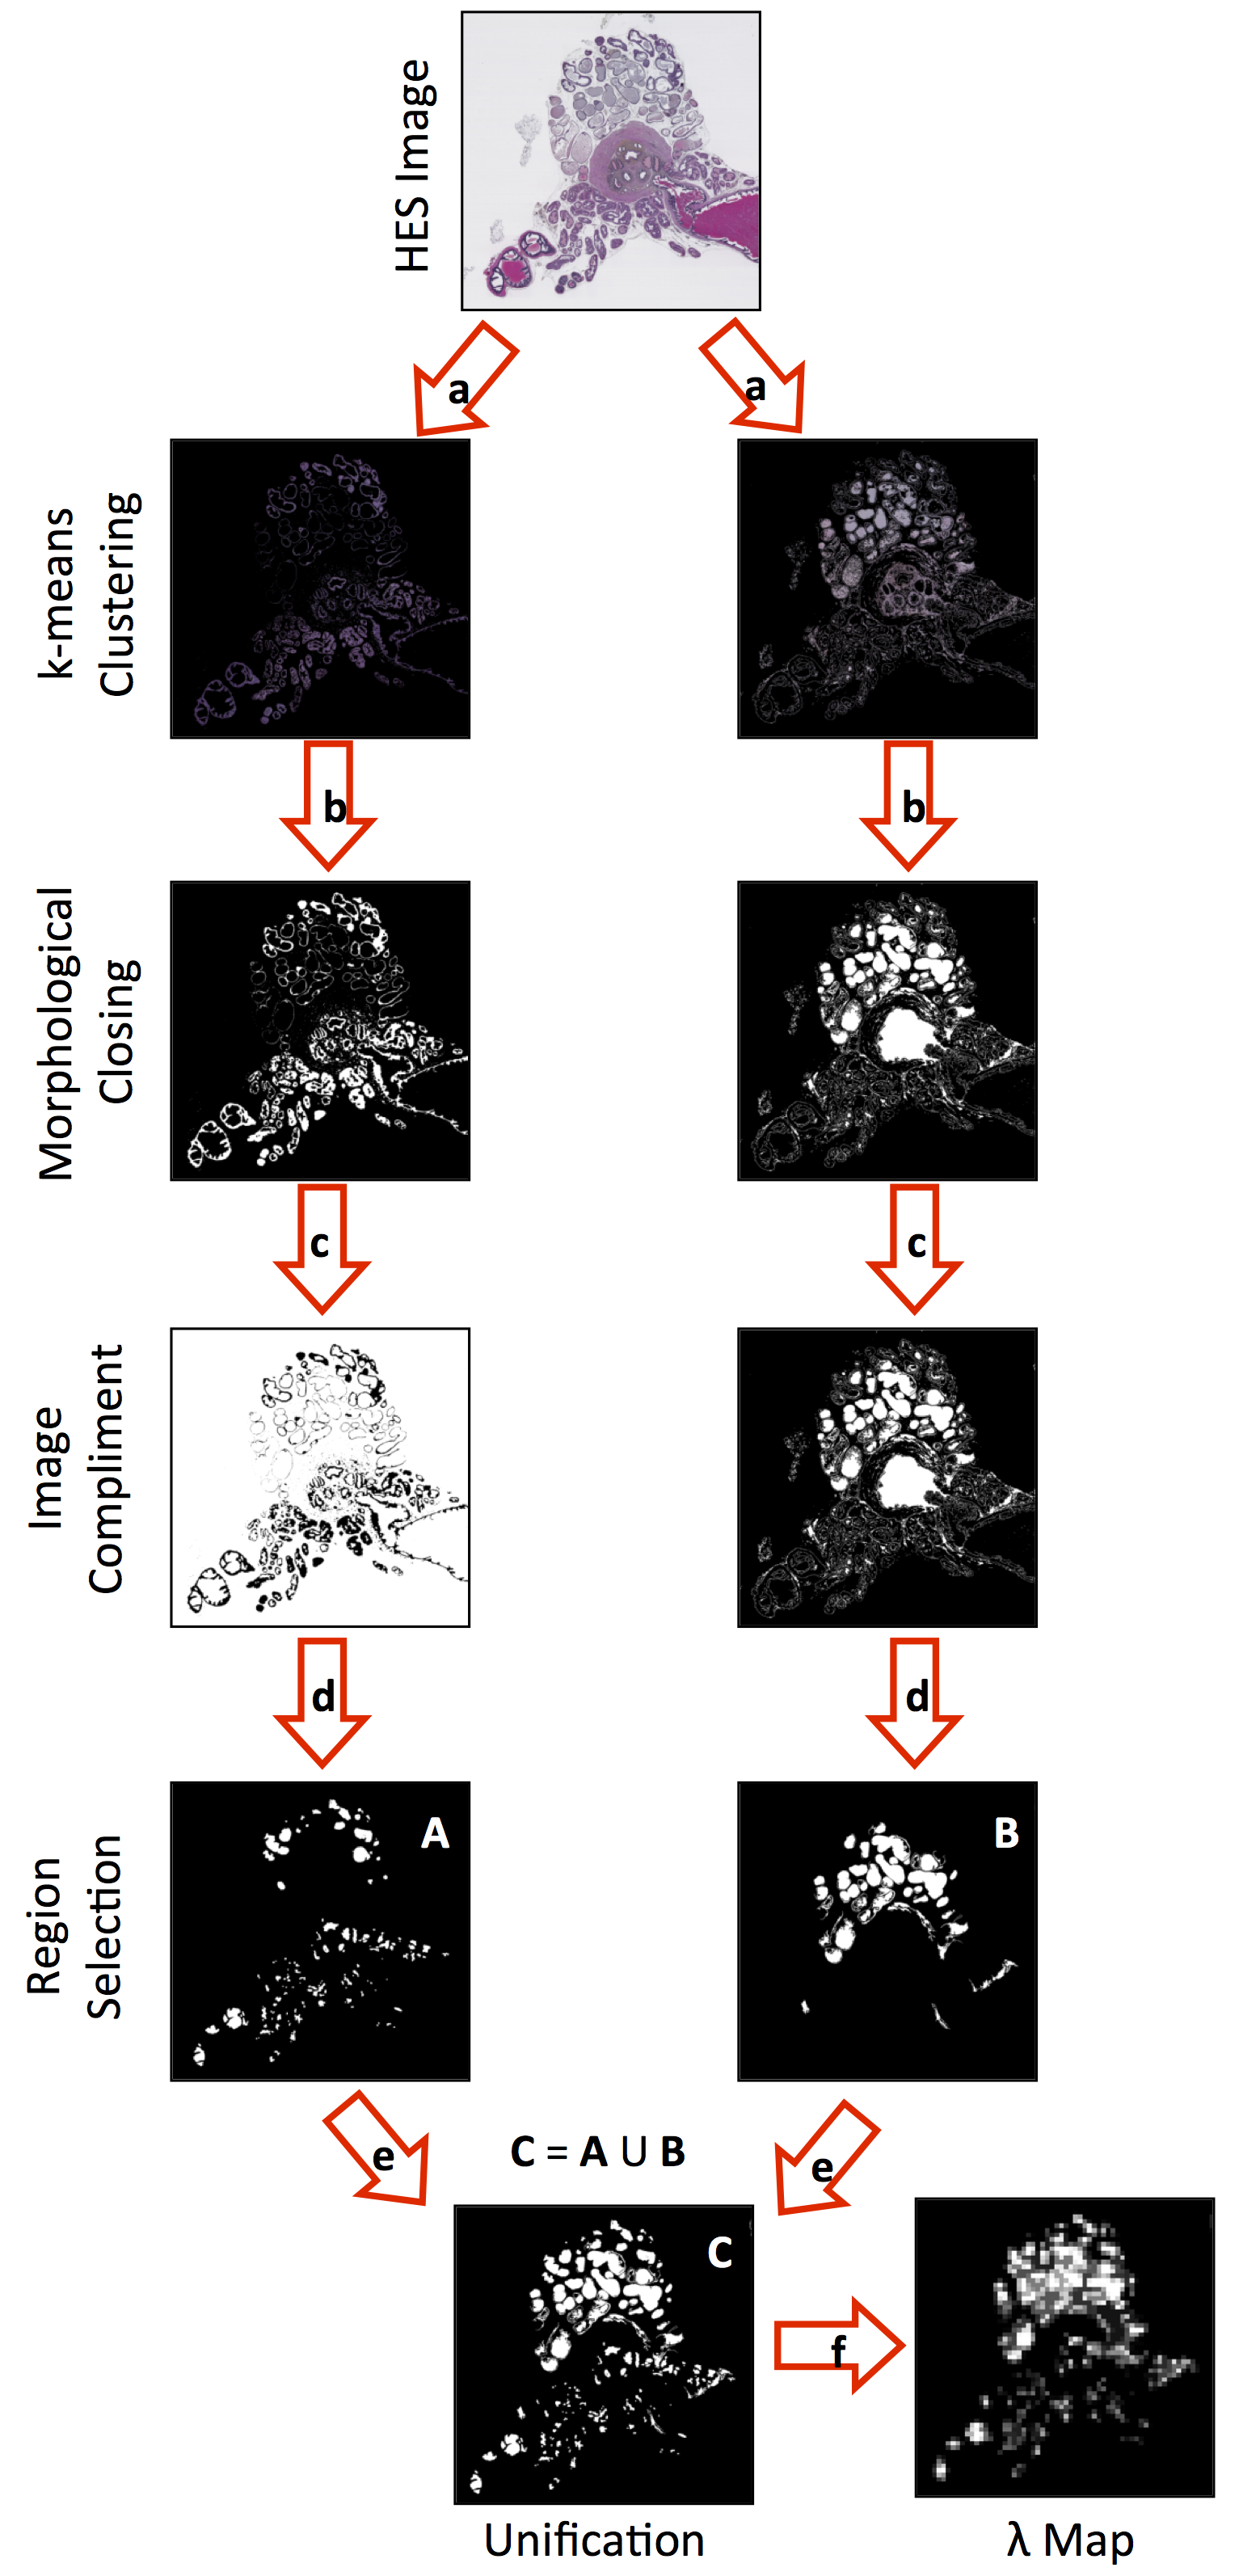
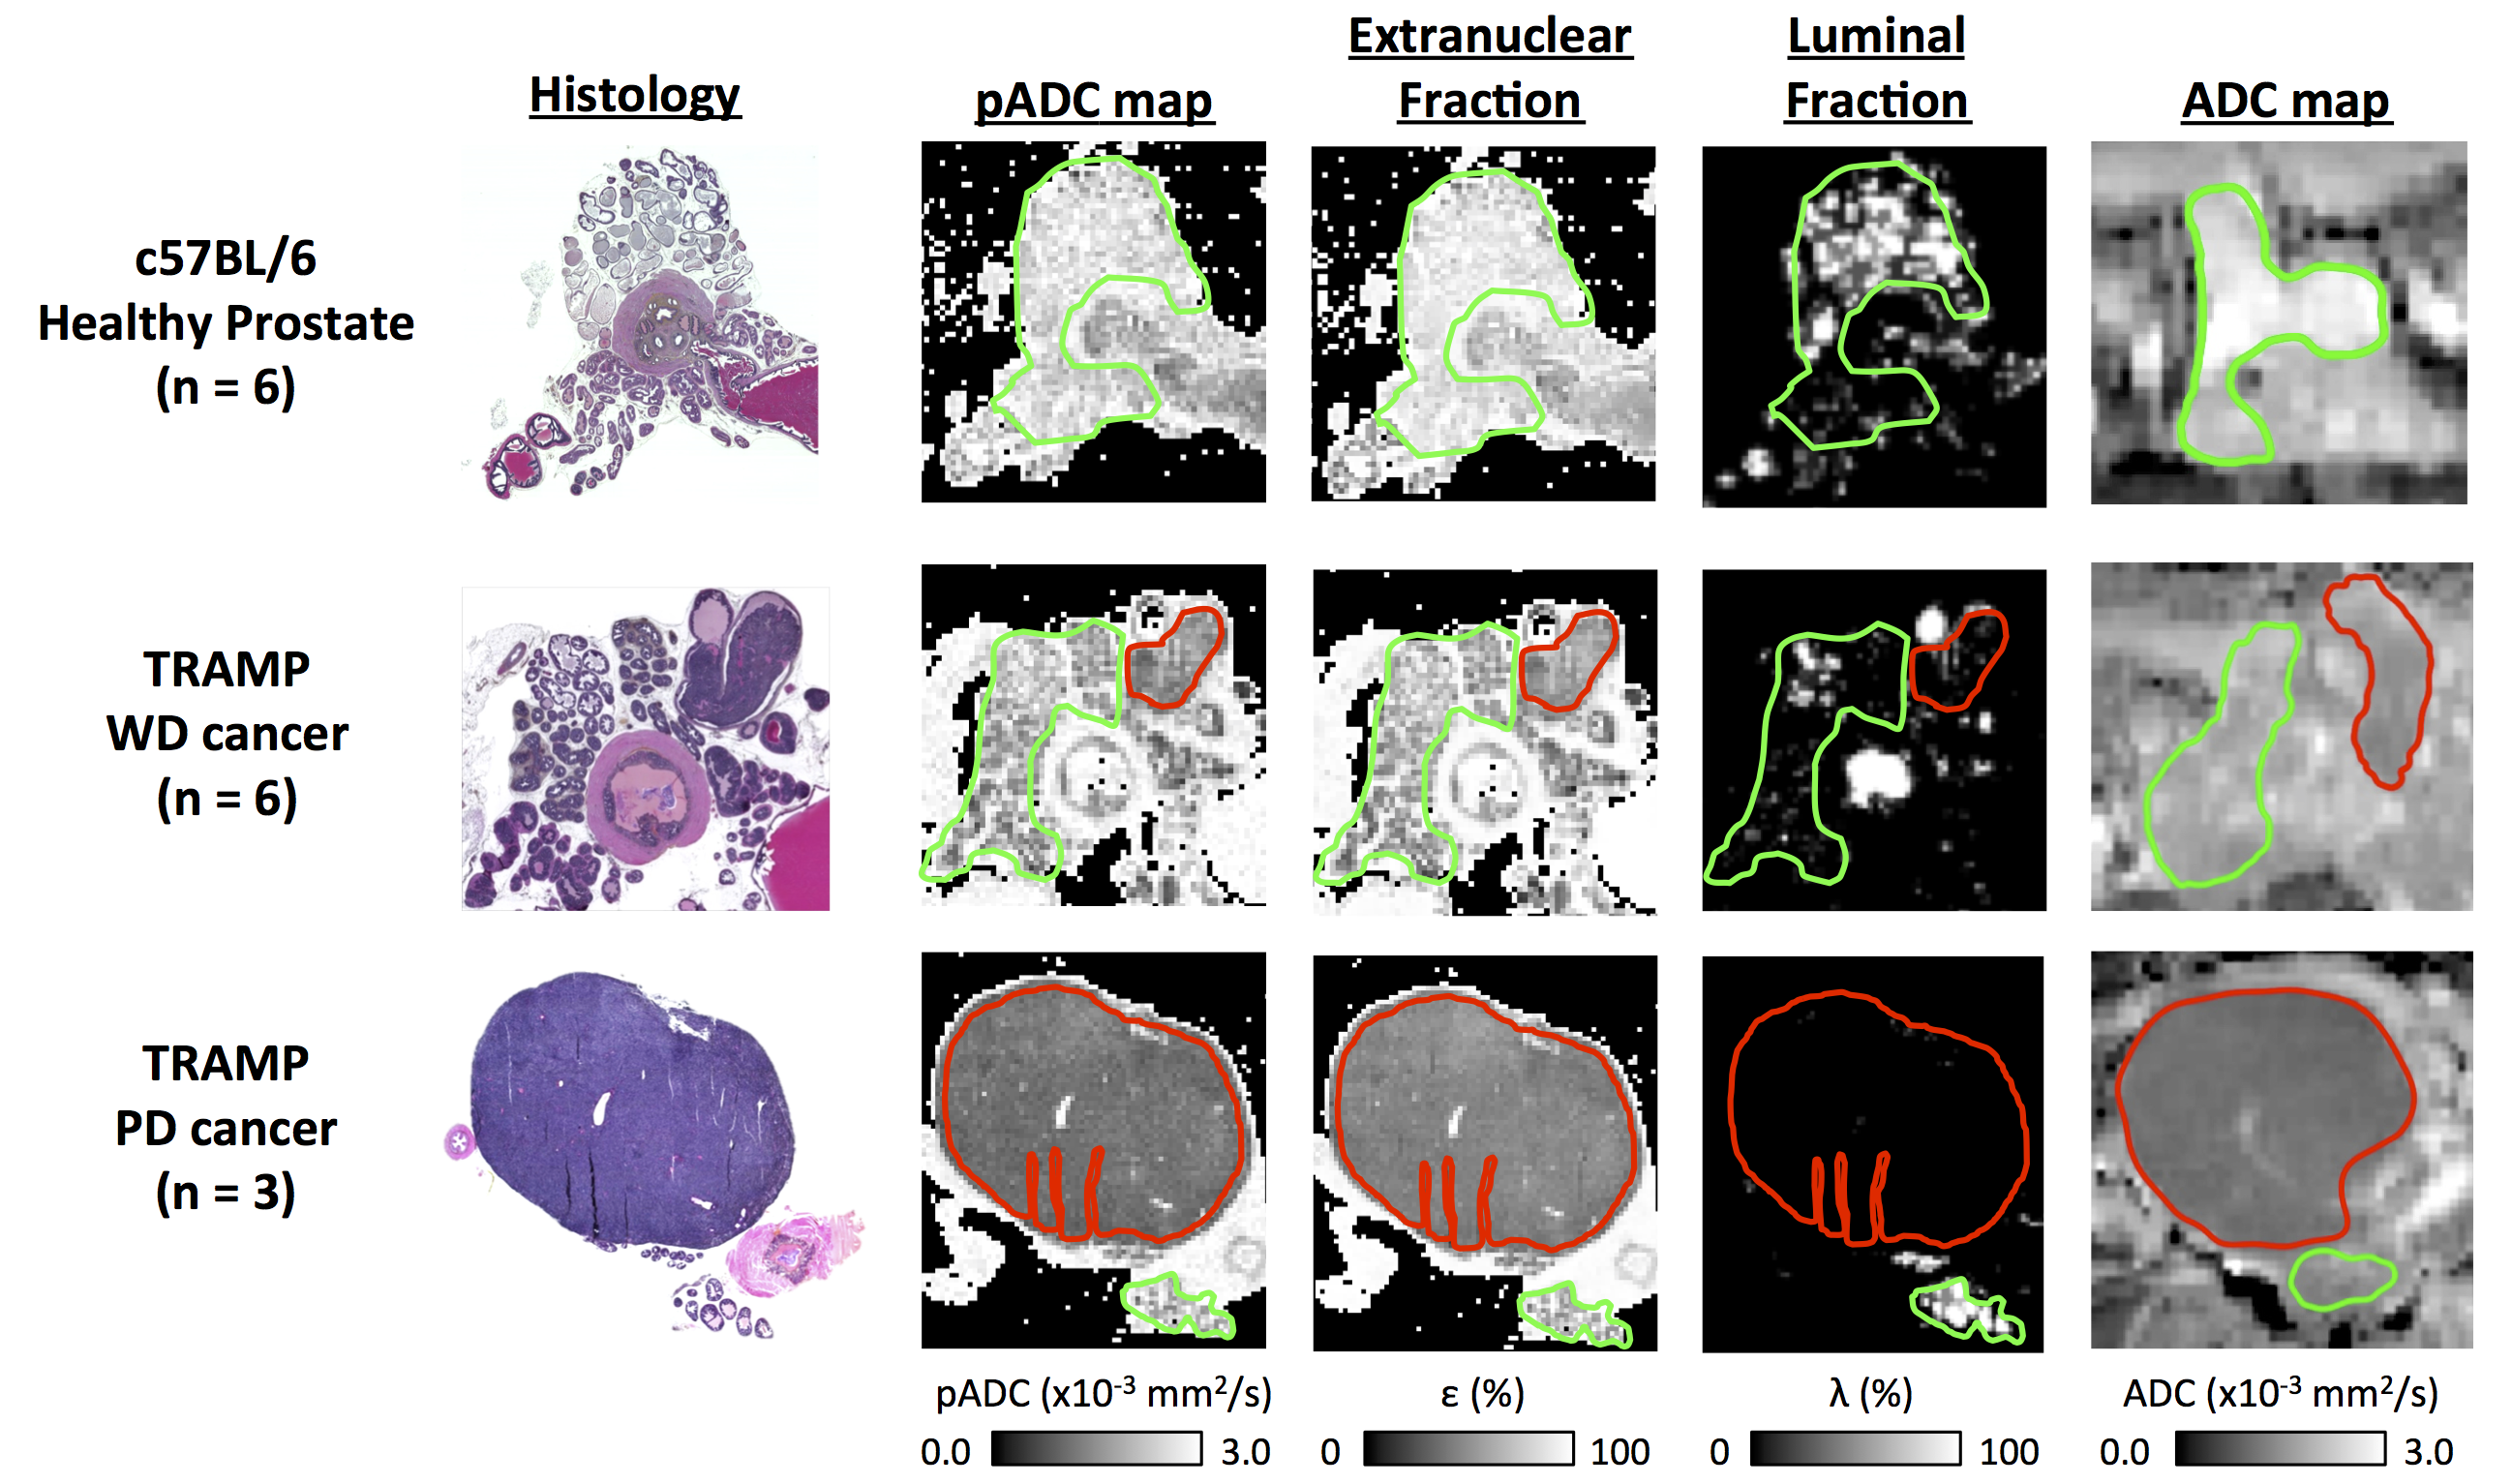
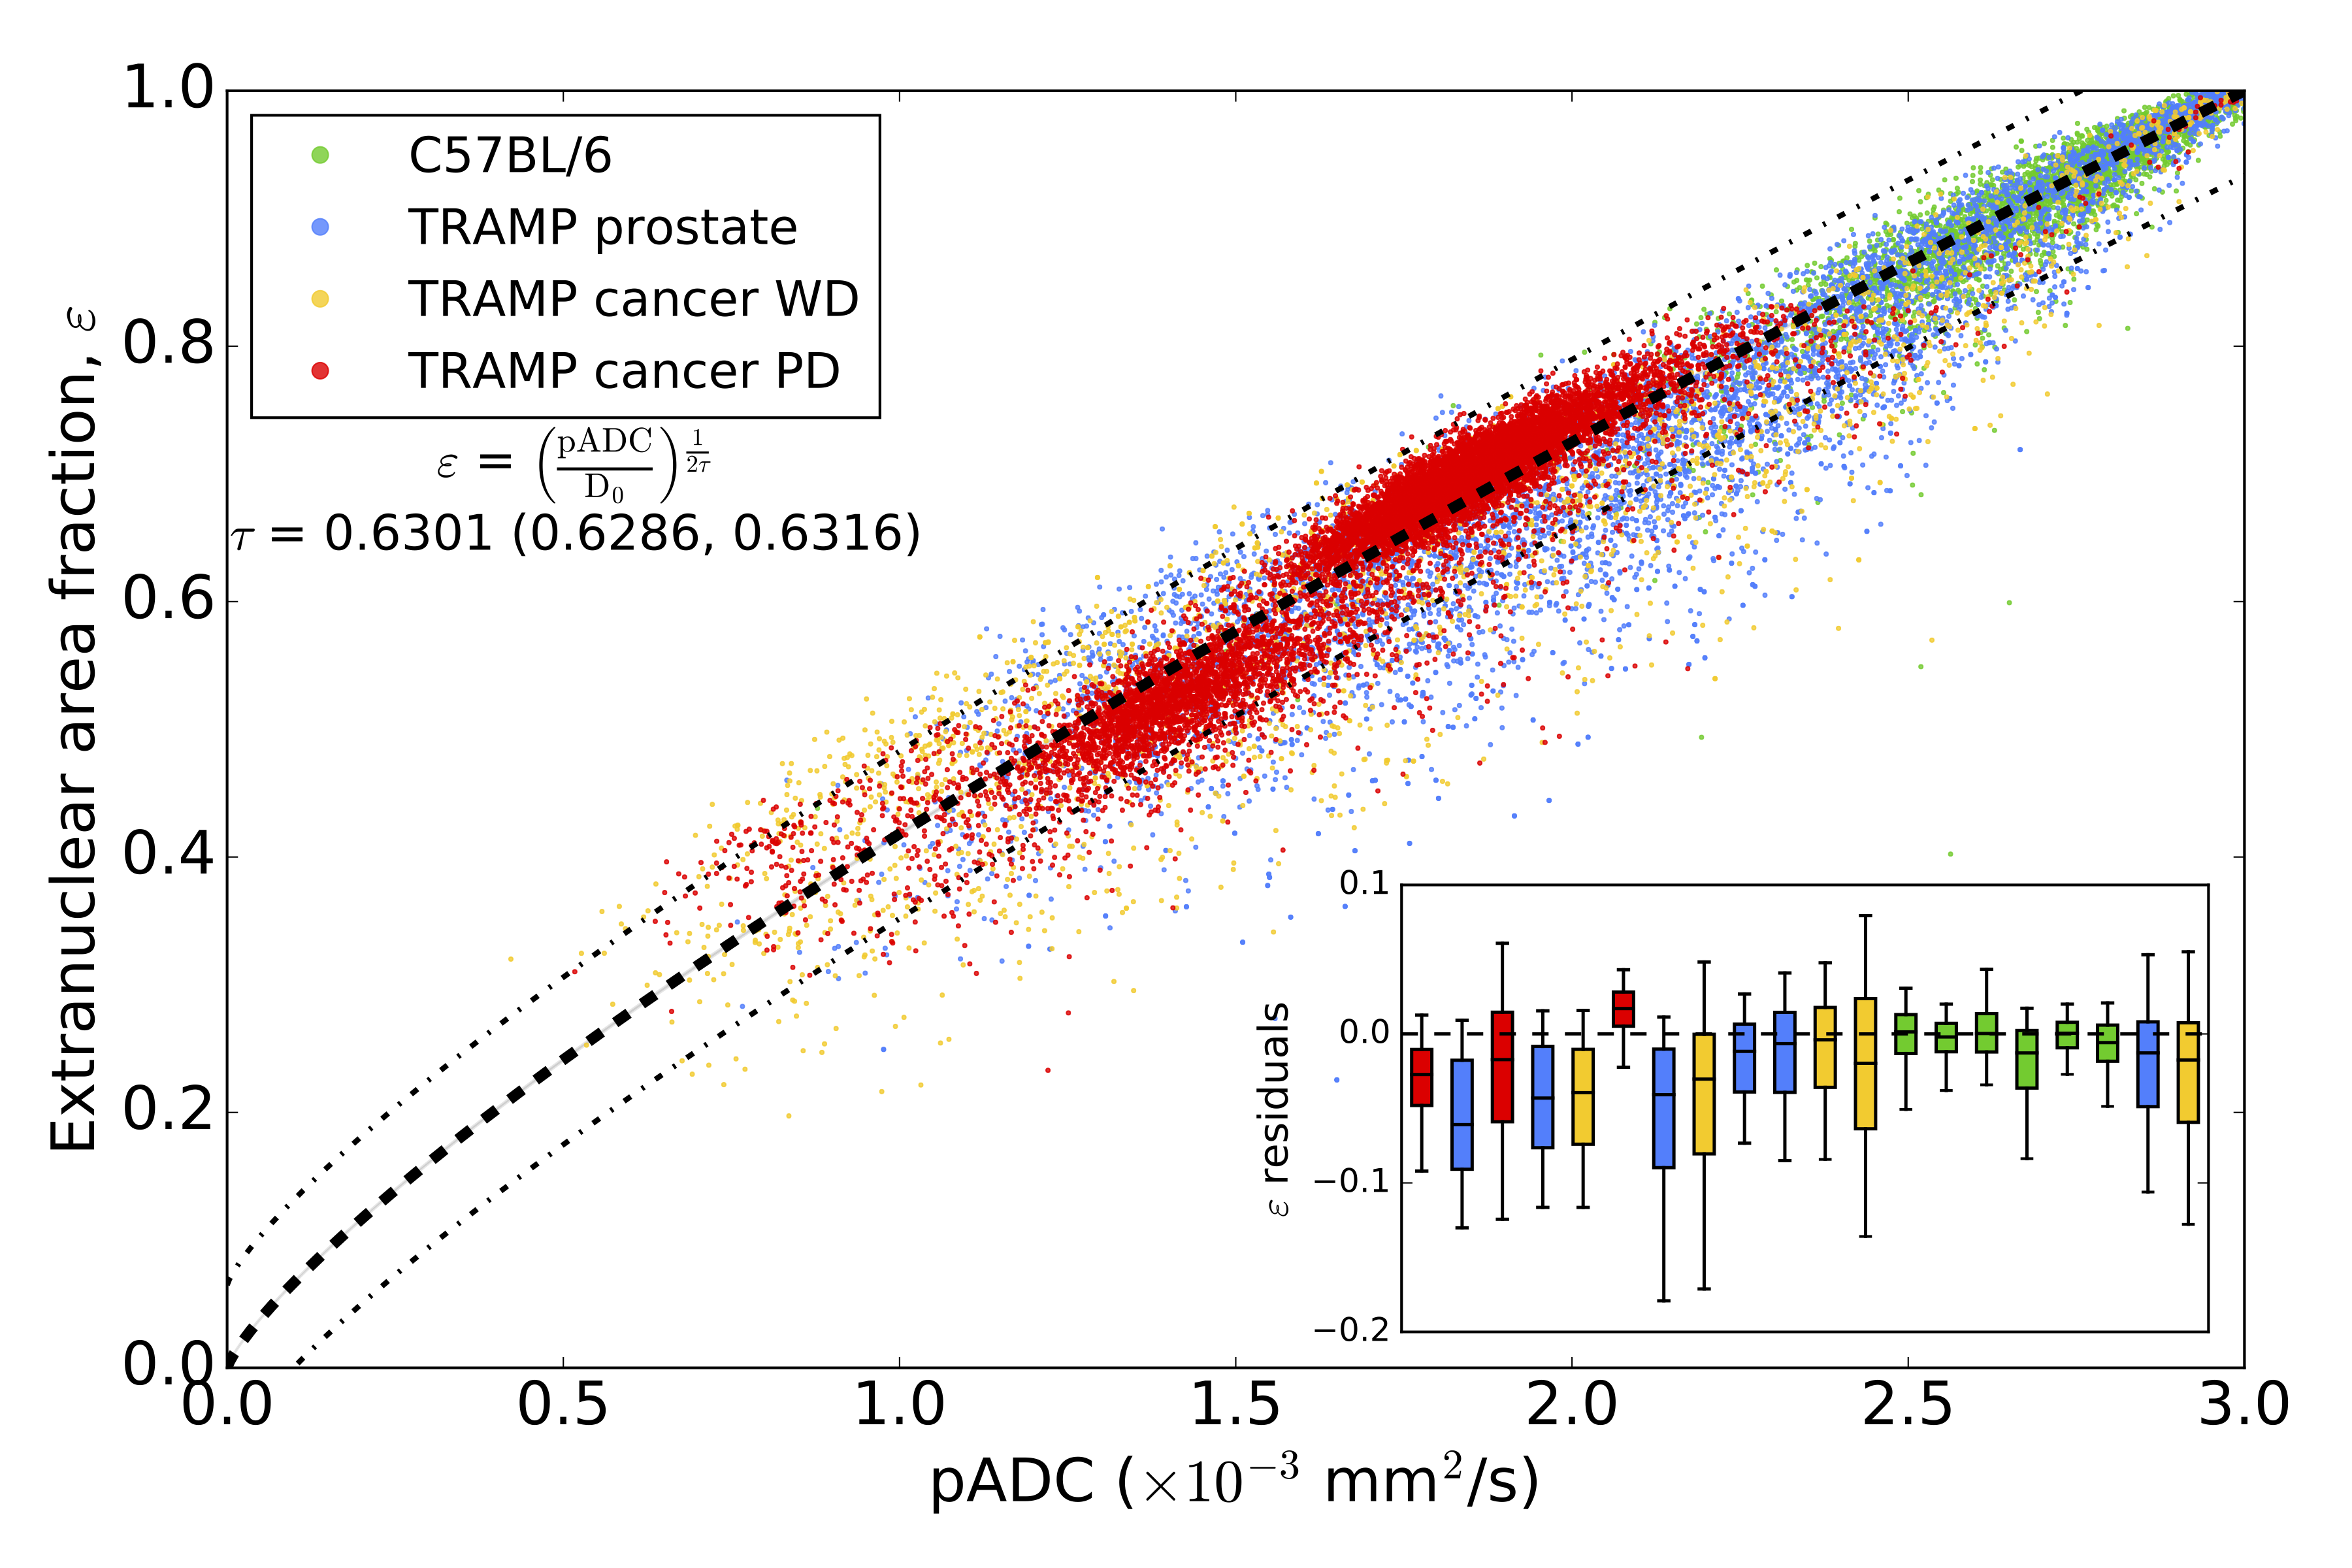
A cohort of nine mice from a transgenic model of prostate cancer (TRAMP) and six healthy control mice (C57BL/6) were imaged on a 7T, preclinical imaging system (Bruker Biospec, Germany). Mice were terminated immediately after image acquisition; upon sacrifice the genito-urinary (GU) tract was excised, formalin-fixed and paraffin embedded for HES staining (slice thickness: 4μm). Histology slides were digitized using a NanoZoomer XR (Hamamatsu, Japan) scanner (40x). Multi-shot EPI, diffusion-weighted imaging was acquired using parameters described in a previous report3 with b-values=0,100,200,400,800 s/mm2, gradient separation Δ=10 ms and gradient duration δ=4 ms (ADC calculated using monoexponential fitting). Digitised histology slides were converted to the LAB colour space and segmented for nuclei using a previously described technique1. For each 500x500 pixel region (0.135x0.135 mm2) in HES slides, the random trajectories of 104 particles were simulated within the extranuclear space of segmented images over a diffusion time that matched MR-experiments (T=Δ-δ/3) to extract a map of pseudo-Apparent Diffusion Coefficient, pADC (Figure 1). From the segmented nuclei, we extracted the fractional area occupied by extranuclear space, ε; similarly, we derived the fractional area occupied by lumen, λ, using a novel HES segmentation approach (Figure 2). An ADC map from a single slice was chosen in each animal that visually best represented the HES cross-section. Corresponding regions of interest (ROIs) were drawn on all maps (Figure 3) and graded into one of four groups according to histological evaluation: Healthy Prostate (C57BL/6), prostatic intraepithelial neoplasia (PIN), well-differentiated (WD) or poorly-differentiated (PD) adenocarcinoma. Using all pixels within ROIs drawn on pADC and ε maps we validated a previously proposed model linking both parameters1,4,5:
$$\varepsilon = \left(\frac{\text{pADC}}{\text{D}_{0}}\right)^{\frac{1}{2\tau}}$$ Eq. 1
where 𝜏 is the ‘tortuosity exponent’ and D0 the diffusion coefficient in the absence of boundaries (data fit using a Markov-Chain Monte Carlo approach to provide parameter confidence). Furthermore, we investigated the correlation between MR-derived ADC and HES-derived pADC and luminal fraction using a least-squares linear fit of mean values within ROIs.
Results
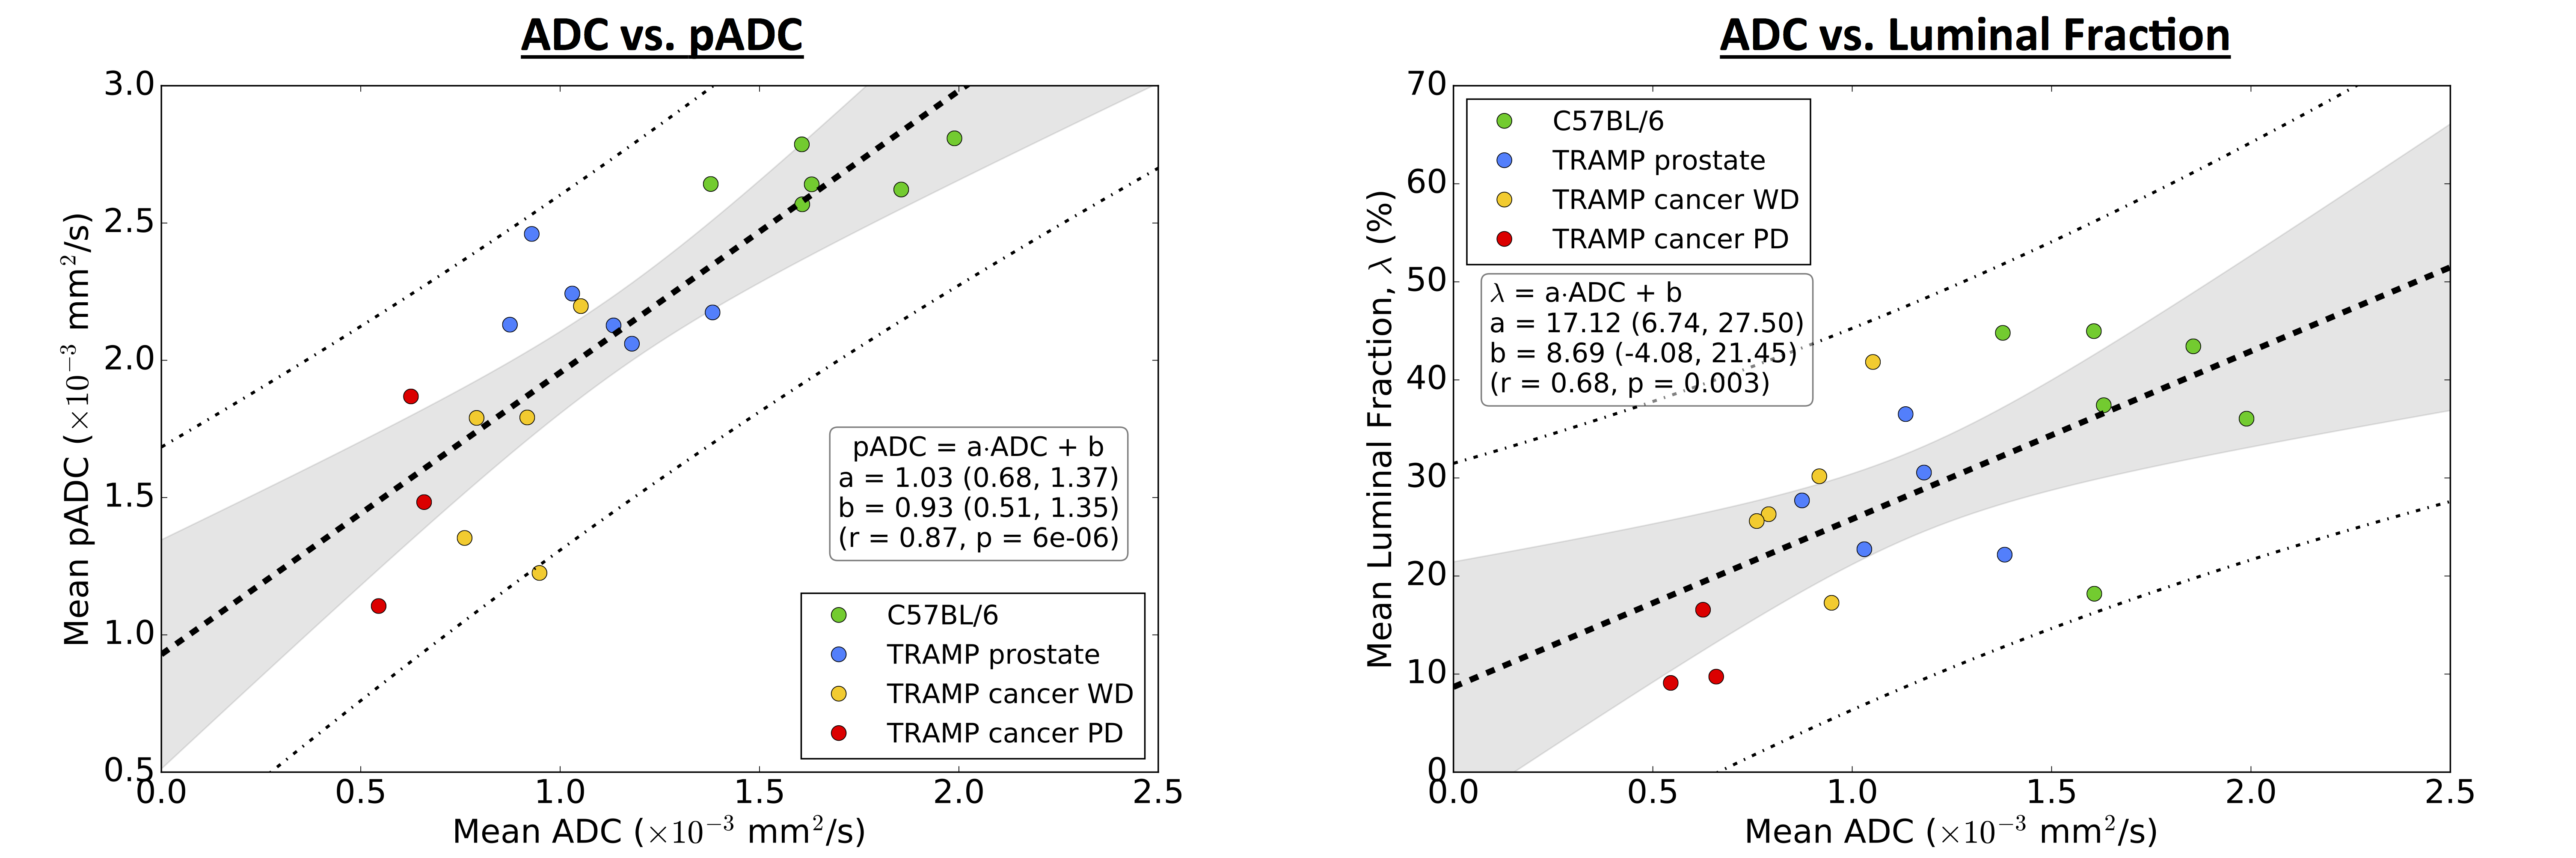
Good visual alignment was generally possible between HES-derived maps and MR-derived ADC (Figure 3). Model fitting of pADC with extranuclear fraction using Eq. 1 (Figure 4) provided an estimate for the extranuclear tortuosity exponent of this mouse population of 0.630 (95% CI: 0.629,0.632); boxplots of data residuals from the derived model reveal no major discrepancies between different animals and/or tissue subtypes (Figure 4). Significant, positive correlations were found when comparing ADC values with pADC (p<0.0005) and luminal space (p<0.005) (Figure 5).Discussion and Conclusion
Our estimate for the tortuosity exponent in this population is different from a value that indicates linearity between pADC and extranuclear fraction (τ=0.5), providing evidence that simple linear models between both are not appropriate. The linear fit between pADC and ADC reveals a positive bias in the former (positive intercept=0.93), indicating that movement of water molecules, as detected using DWI, is restricted by more than just nuclei (e.g. is sensitive to tissue components such as cell membranes and the extracellular matrix). The strong correlation between pADC and ADC demonstrates that pADC may provide a potent surrogate for identifying the tissue properties that give rise to ADC measurements made in-vivo. By including additional information such as fractional luminal space measured by whole-slide HES technologies, we gain even deeper insight into the structural properties affecting ADC in tissues such as the prostate6. Interrogating tissue structure with these methods we hope to enhance our understanding of longitudinal ADC measurements of different tissue components within multiple cancer types, thus improving our knowledge of tumour heterogeneity and how it may affect treatment.
Acknowledgements
CRUK and EPSRC support to the Cancer Imaging Centre at ICR and RMH in association with MRC and Department of Health C1060/A10334, C1060/A16464 and NHS funding to the NIHR Biomedical Research Centre and the Clinical Research Facility in Imaging. We acknowledge support from the liaison Committee between the Central Norway Regional Health Authority and the Norwegian University of Science and Technology, the Research Council of Norway. MRI was performed at the MR Core Facility, NTNU, animals were housed at the Comparative Medicine Core Facility, NTNU, and histology performed at the Cellular and Molecular Imaging Core Facility, NTNU.References
1. Hill, D. K., Heindl, A., et al., Proc. 23rd Ann Mtg ISMRM (2016), 0444
2. Chaterjee, A., Watson, G., et al., Radiology (2015), 277(3):751-62
3. Hill, D. K., Kim, E., et al., J. Magn. Reson. Imag. (2016), 43:1207–1217
4. Pfeuffer, J., Dreher, W., et al., Magn. Reson. Imag. (1998), 16(9): 1023-1032
5. Khanafer, K. and Vafai, K. Heat and Mass Transfer (2006), 42(10):939-953
6. Selnæs, K., Vettukattil, R., et al., Frontiers in Oncology (2016), 6:146
Figures