4460
Using Hippocampus Volume to Predict Treatment Outcome in Major Depressive Disorder1Department of Radiology, Huaxi MR Research Center (HMRRC), West China Hospital of Sichuan University, Chengdu, People's Republic of China
Synopsis
The current study aimed to use structural data of hippocampus volume obtained from magnetic resonance imaging to predict treatment outcome in major depressive disorder. Our findings demonstrated that there was a relationship between left hippocampus volume and medication efficiency in major depressive disorder group. Meanwhile, our results threw light on the predictive value as a marker of treatment responsiveness in major depressive disorder.
Clinical Question
Is it possible to predict treatment response in major depressive disorder through structural magnetic resonance imaging marker?Impact
Major depressive disorder (MDD), a highly disabling mental illness, is one of the leading causes of disease burden worldwide [1]. Patients with MDD have a 2-12% lifetime risk of committing suicide [2].
Furthermore, MDD is a chronic disease with a relapsing and remitting course. Antidepressant medications form the first-line treatment reported less than 50% of patients respond or remit to their first treatment [3,4]. A biomarker helpful to predict the treatment response shall have important clinical significance. However, in current stage, it is still hard to predict treatment response based on clinical information. The clinical standard is to use a “watch and wait” strategy relying on trial and error, which caused an enormous economic losses and an increase of the total healthcare burden associated with MDD.
The objective of this study were to examine whether the relations between imaging findings obtained by magnetic resonance scanner before treatment would associate with the clinical treatment outcomes in patients with MDD and to explore whether this methods could provide clinically applicable information about which patients were likely to achieve remission, versus those who will not have good response in clinical routine treatment. Hopefully, this will help clinical decision on MDD patients in the future to avoid invalid treatment strategy.
Approach
In this study, 37 DSM-IV criteria diagnosed MDD patients and 21 healthy controls were recruited. High resolution T1 weighted images were obtained using spoiled gradient recalled sequence (TR/TE, 8.5/3.4; flip angle, 12o; 156 axial sections; section thickness, 1mm; field of view, 24×24cm2; and 256×256 matrix) via a GE 3.0 T scanner. The volumes of subcortical gray matter structure, hippocampal subfields and intracranial volume (ICV) were measured by FreeSurfer software.
The efficiency of medication was represented by HAMD score reduction rate (SR) , which was calculated as (HAMDbefore-HAMDafter6W)/HAMDbefore. According to SR, patients group was further divided into two subgroups: remitted (SR>50%) and non-remitted (SR≤50%) groups.
Volume differences of subcortical nucleus and hippocampal subfields (presubiculum, CA1, CA2-3, fimbria, subiculum, CA4-DG and hippocampal-fissure) between patients and healthy controls were compared using general linear model with age, sex and ICV as covariates with statistical software SPSS (v.16.0). Pearson’s correlation between the volumes and SR was explored. Subgroup-wise comparison of volumes was investigated using the same method.
Gains and Losses
We found that bilateral caudate and left accumbens area was significantly reduced in MDD comparing with HC. Only hippocampus showed increased volume which did not reach statistical significance. Interestingly, there is a negative correlation between SR and volume of left hippocampus and its subfield (CA2-3, CA4-DG, subiculum, presubiculum) in MDD patients(Fig2) which suggested that the smaller the hippocampus size the better the clinical outcome after a short period of six weeks’ treatment.
When comparing subgroups, in left hemisphere, hippoampus as a whole and subfields of presubiculum, CA1, CA2-3, CA4-DG, hippocampal-fissure, subiculum all were significantly smaller in remitted patients. In the right hemisphere, the whole hippocampal volume was sightly smaller, with CA1 and subiculum significantly smaller in remitted group.(Table 2 & 3, Fig1)
In conclusion, our study demonstrated that there is a relationship between left hippocampus volume and medication efficiency in MDD group. Hippocapus was found larger in patients, and patients with less hippocampal abnormality are tend to achieve remitted under current medication guideline. Given the fact that previous studies have implicated hippocampus as a key target of antidepressant medication [5], our results threw light on its predictive value as a marker of treatment responsiveness. Future study with large sample size are needed to verify this finding.
Gains: With high-resolution, MRI is efficient, safe, no radiation and little impact on patients. Owing to variable MR sequence, we can acquire other information such as functional imaging data for further study.
Losses: However, it’s time consuming to obtain MRI and it is banned to be used to some patients such as one with cardiac pacemakers. The price of MRI scanning is another issue need consideration referring to cost-efficiency.
Preliminary Data
The high-resolution structural imaging data were obtained by a GE 3.0 T scanner. Demographic and clinical characteristics for all subjects are collected.Acknowledgements
This study was supported by the National Natural Science Foundation (Grant No. 81411130163, 81671669 and 81171488)References
[1]. Murray CJ, Lopez AD. (1996) Science 1996;274:740-743.
[2]. Nock M. K. et al. Br. J. (2008) Psychiatry 192, 98-105.
[3]. Gerald Gartlehner. et al. (2012) Psychiatry Rep. 14 (4), 360-369.
[4]. Richard Hansen. et al. (2008) Am. J. Psychiatry 167 (7), 748-751.
[5]. MacQueen GM. (2009) J Psychiatry Neurosci. Sep;34(5):343-9.
Figures
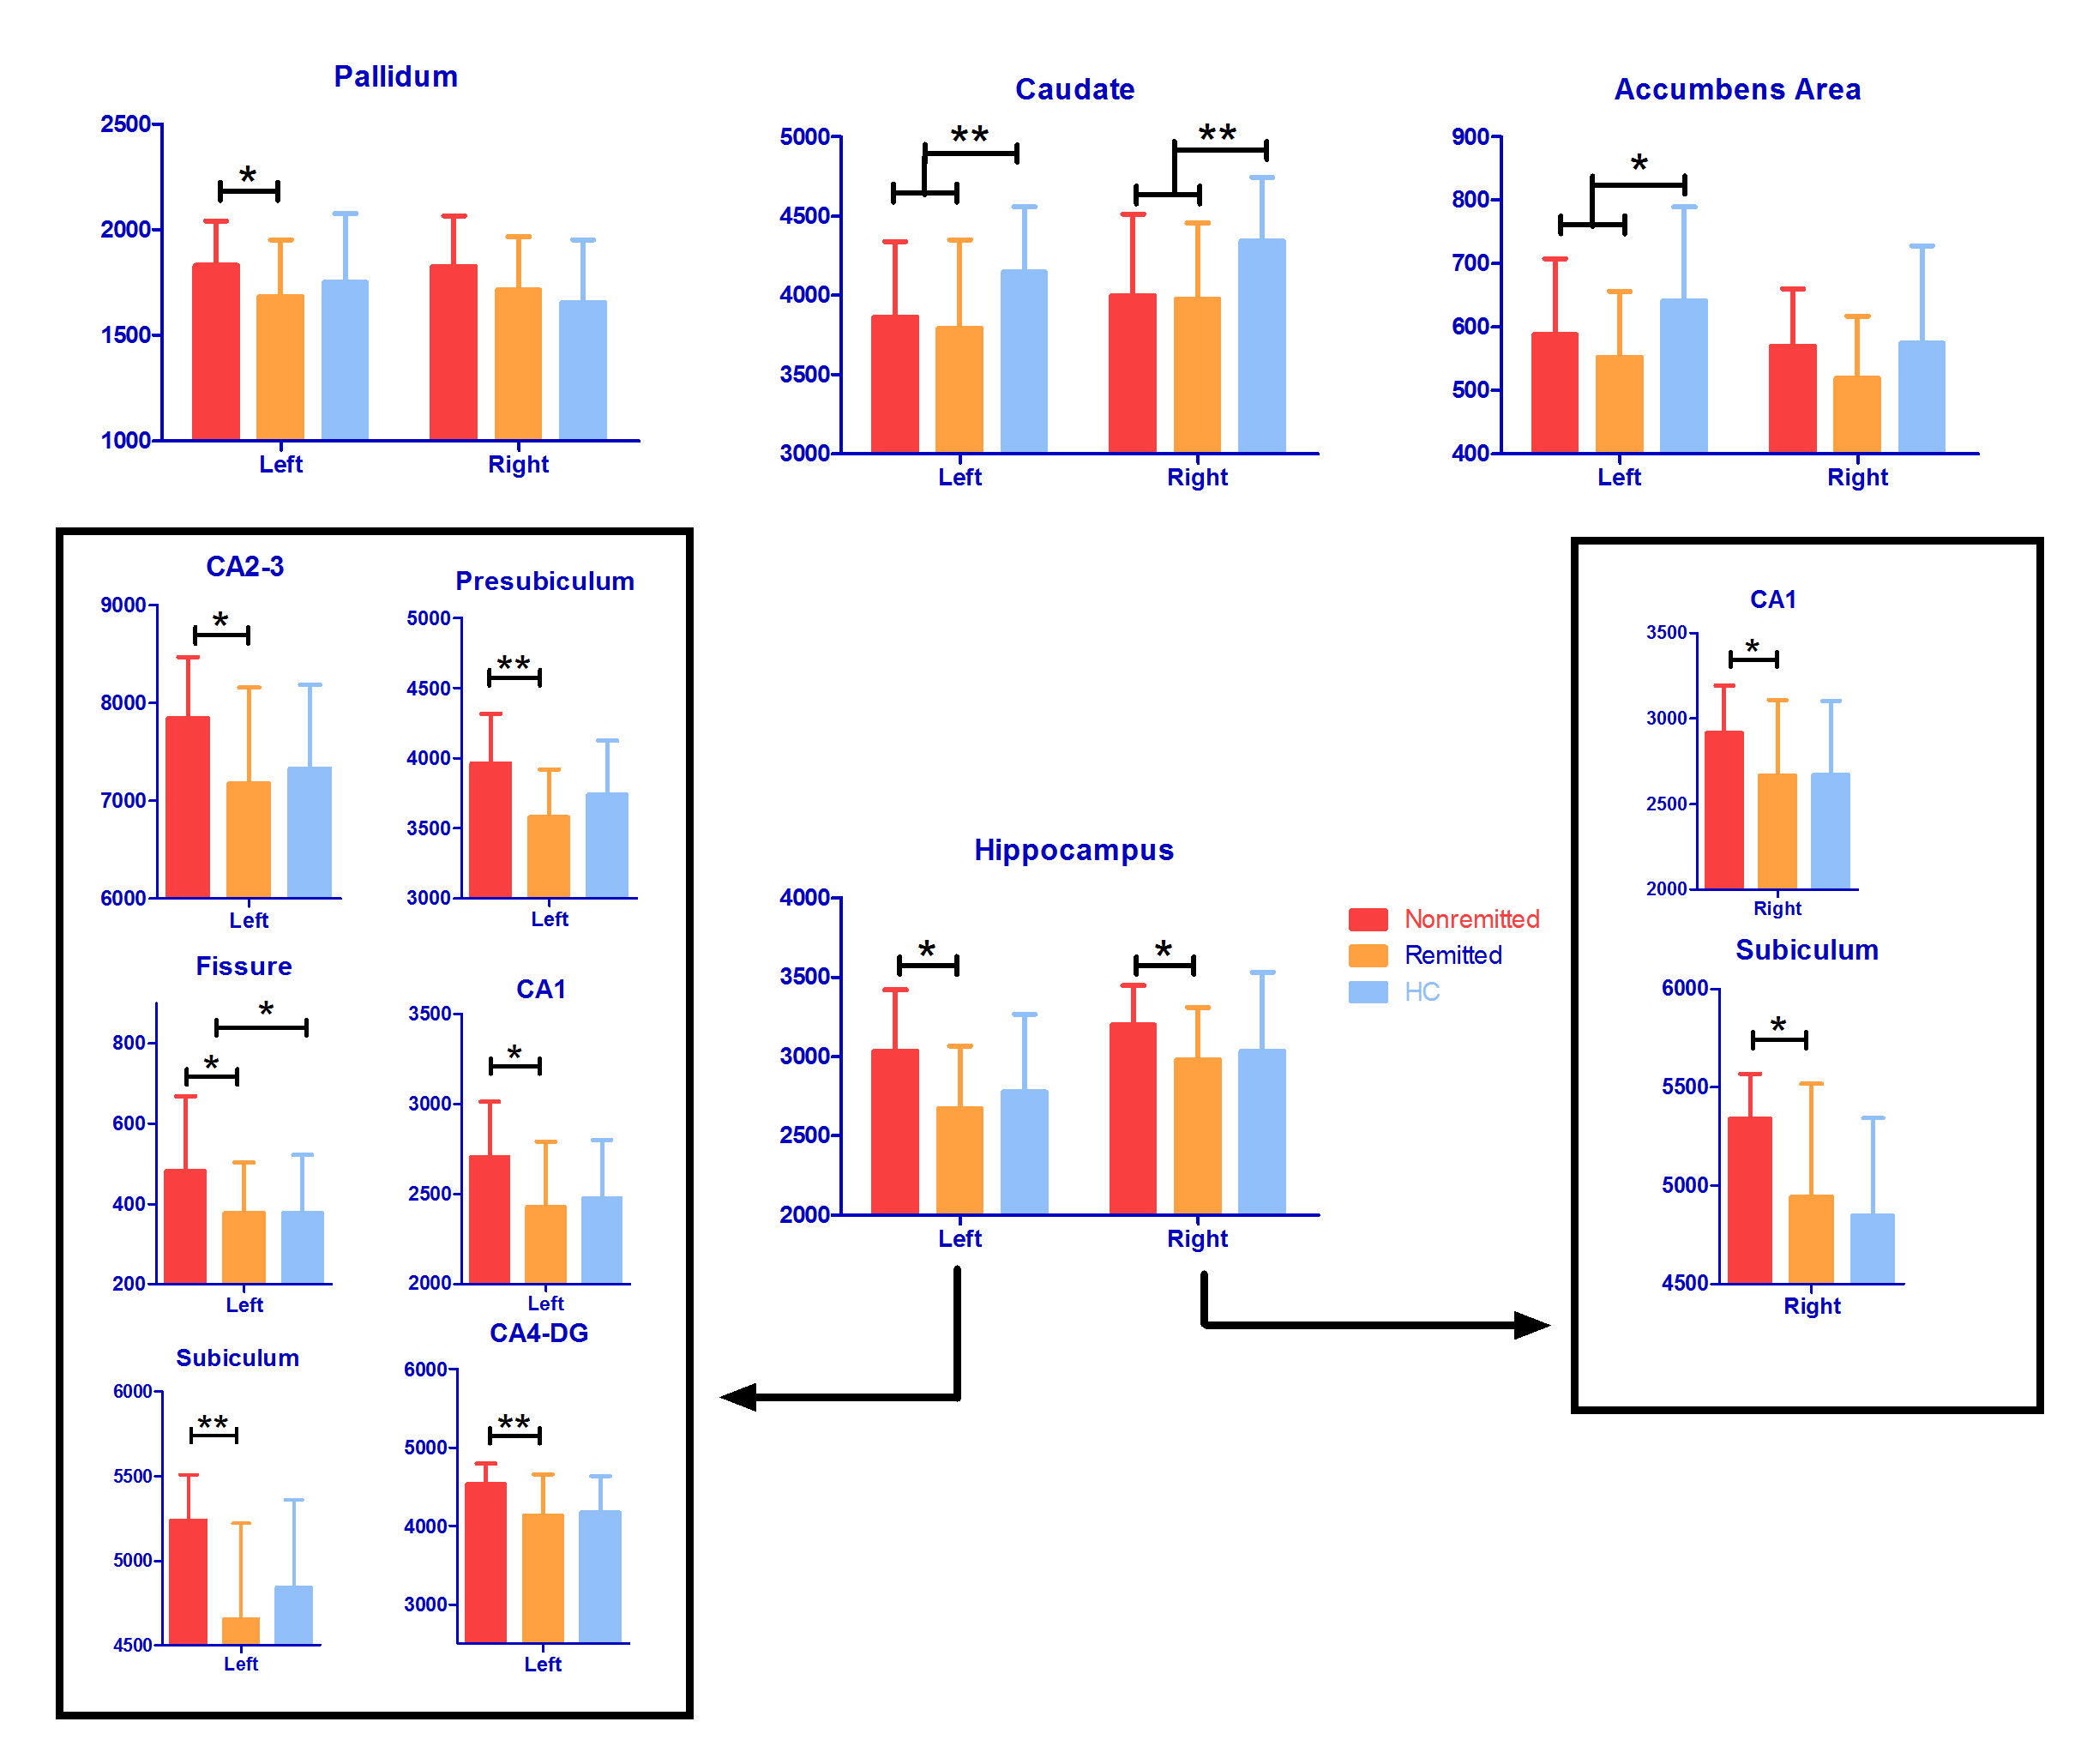
Fig1. Group-wise and subgroup-wise comparison of subcortical nucleus and hippocampal subfields. Group-wise comparison, bilateral caudate and left accumbens area was significantly reduced and right hippocampal fissure was statistically enlarged in patients group. Subgroup-wise comparison, left pallidum was reduced in remitted group. Left hippoampus and its subfields (presubiculum, CA1, CA2-3, CA4-DG, hippocampal-fissure, subiculum), as well as right hippocampus and its subfields (CA1, subiculum) were significantly smaller in remitted patients.
Abbreviations: CA, Cornu Ammonis; HC, healthy control.
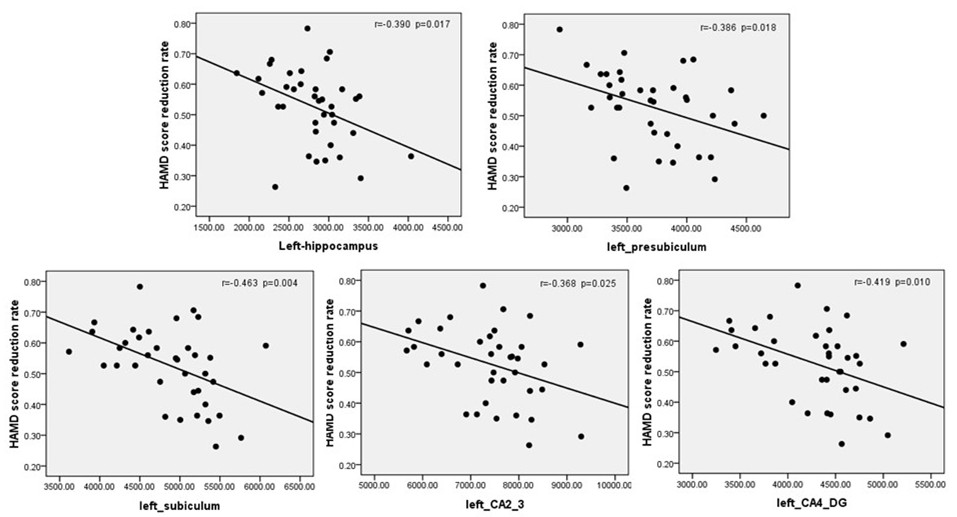
Fig2. Person’s correlation exhibiting negative correlation between the HAMD score reduction rate and volume of left hippocampus and its subfield (CA2-3, CA4-DG, subiculum, presubiculum) in MDD patients.
Abbreviations: CA, Cornu Ammonis; HAMD, the Hamilton Depression Rating Scale; MDD, major depressive disorder.
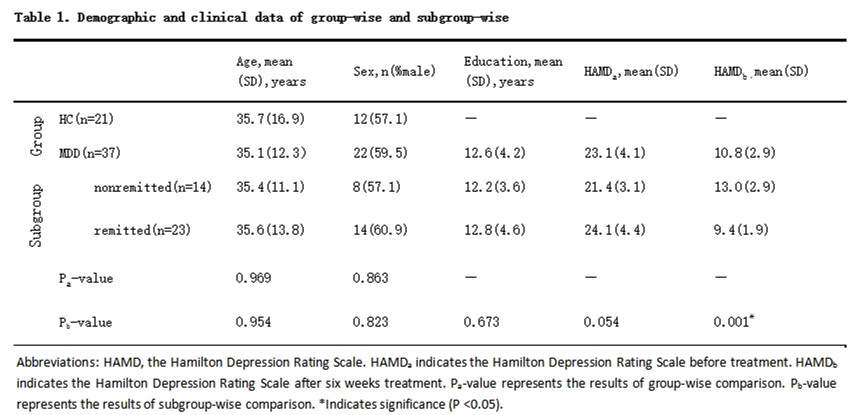
Fig 3. Demographic and clinical data of group-wise and subgroup-wise.
Abbreviations: HAMD, the Hamilton Depression Rating Scale. HAMDa indicates the Hamilton Depression Rating Scale before treatment. HAMDb indicates the Hamilton Depression Rating Scale after six weeks treatment. Pa-value represents the results of group-wise comparison. Pb-value represents the results of subgroup-wise comparison. *Indicates significance (P <0.05).
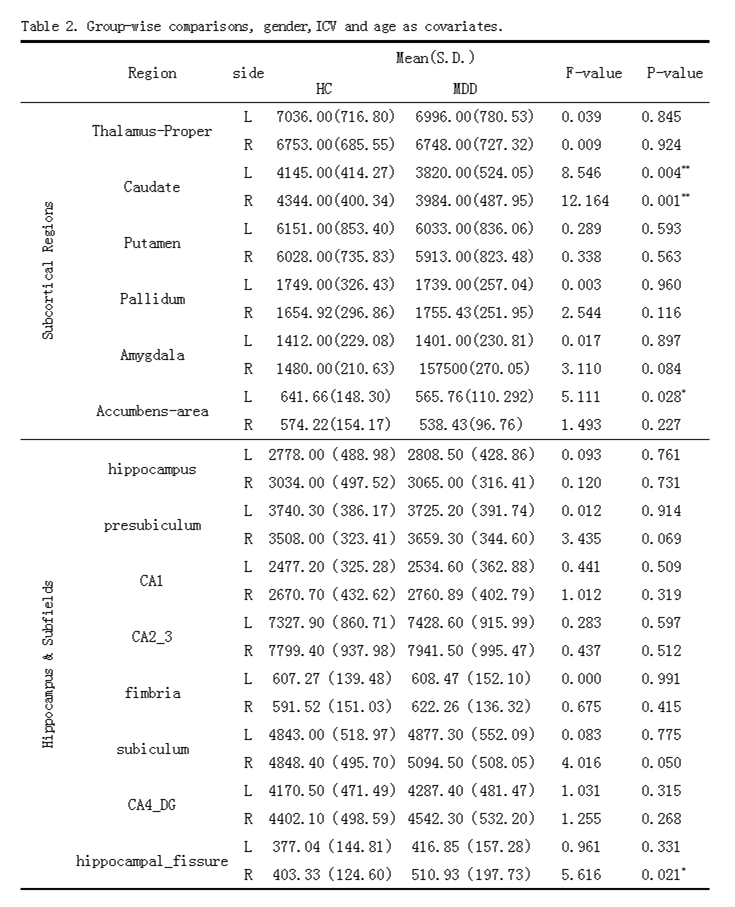
Fig 4. Group-wise comparisons with gender, ICV and age as covariates.
Abbreviations: CA, Cornu Ammonis;MDD, major depressive disease; HC, healthy control;L, left; R, right. The mean volumes (s.d.) in cubic millimeters of subcortical nucleus and hippocampal subfields of the healthy control and patient group are indicated. The F-value and P-values represent the results of analysis of covariance (with intracranial volume, age, sex as covariates). *Indicates significance (P <0.05) and **Indicates significance (P<0.01).
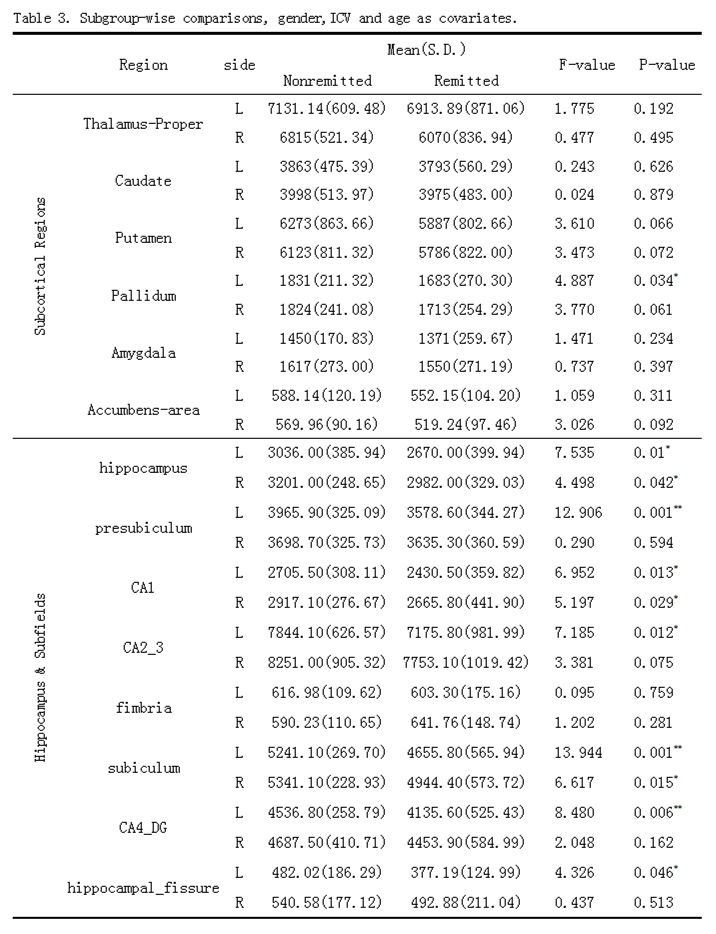
Fig 5. Subgroup-wise comparisons with gender, ICV and age as covariates.
Abbreviations: CA, Cornu Ammonis; L, left; R, right. The mean volumes (s.d.) in cubic millimeters of subcortical nucleus and hippocampal subfields of nonremitted group and remitted group are indicated. The F-value and P-values represent the results of analysis of covariance (with intracranial volume, age, sex as covariates). *Indicates significance (P <0.05) and **Indicates significance (P<0.01).