4458
Quality Assessment in the Multicenter MR Imaging Study of the German National Cohort (NAKO)1MR Physics and Imaging, Fraunhofer MEVIS, Bremen, Germany, 2Software Development, Fraunhofer MEVIS, Bremen, Germany, 3Central Executive Office of the German National Cohorte, Heidelberg, Germany
Synopsis
A fully automated workflow for image-based quality assessment (QA) was set up in a large, multi-center cohort whole-body MR imaging study, part of the National Cohort Study Germany NAKO. Study design, data management, workflow, and objectives have been described previously. Standardized quality assessment including technical aspects like program and protocol parameter truth, as well as image-based estimates of various quality indices demonstrate a high degree of stability and homogeneity of image quality across the 5 contributing MR centers. Furthermore, QA ensures short-term intervention procedures with respect to quality control, and offer valuable quantitative information for subsequent scientific data evaluation.
Introduction and Purpose
A fully automated workflow for image-based quality assessment (QA) was set up in a large, multi-center cohort MR imaging study. A subset of 30'000 subjects from the National Cohort Study Germany (NAKO) [1] is selected for a whole-body MR imaging program (baseline 2014-2019), covering neurological, cardiological, musculoskeletal, and thoracoabdominal protocols [2]. Study design, data management, workflow, and objectives have been described previously [3].
A standardized quality assessment including technical aspects like program and protocol parameter truth, as well as image-based estimates of various quality indices demonstrate a high degree of stability and homogeneity of image quality across the 5 contributing MR centers. Furthermore, QA ensures short-term intervention procedures with respect to quality control, and offer valuable quantitative information for subsequent scientific data evaluation. A weekly phantom QC procedure accompanies quality assessment independent from physiological variabilities.
Methods and Materials
During image acquisition, VPN-secured DICOM transfers synchronously forward all acquired data to a centralized storage and allows for QA procedures within one hour after MR exam. The MR program is strongly standardized and performed on identical, dedicated MRIs (3T MAGNETOM Skyra, Siemens Healthcare). A DICOM-based comparison versus a gold-standard program checks for protocol parameter deviations, program uniqueness and changes. Subsequently, various image-based quality measures (e. g. UIQI [4], sharpness, SNR, intensity drift and variation over time of time-series, N/2 correlation, noise correlation) are estimated and compared on-the-fly to monthly cohort statistics. Web-based graphical visualization using ElasticSearch/Kibana and indication of QA scores through the UploadApproval webinterface, based on MeVisLab [5], allow for daily checks, outlier detection and short-term quality control procedures. Statistical tools like Shewhart's charts [6] and Mann-Kendall tests [7,8] reveal quantitative long-term statistics of stability, multi-center homogeneity, and trend changes.
A phantom QC routine using a dedicated phantom adds information on focused technical aspects like geometric distortions independent from physiological influences.
Results
To date, the MRI Study has acquired more than 10'000 exams; daily acquisition rate is about 35 exams per day, data transfer ~100GB per day, processing and QA are fully automated. Most QA parameters can be approximated by a Gaussian distribution which is equivalent to an outliers rate (±3σ) of less than 0.5% (e. g. positioning or protocol failures, technical issues).
Due to the high number of exams, the five MR sites differ significantly (p<10-3) for all QA estimates; nevertheless all QA values reveal a high degree of long-term stability (p<10-3). Prominent differences between sites are found for the EPI time-series intensity drift which might be attributed to scanner hardware differences (e. g. amount of passive shim material).
Taking a time-period (QA data from 2015) as data inherent reference, Shewhart’s charts and Mann-Kendall tests provide quantitative tools to assess stability and homogeneity of recent (e. g. first half-year in 2016) data. Mann-Kendall tests are sensitive to trend changes. Despite a similar long-term stability, data from 2016 reveal more short-term changes in comparison to data from 2015. This might be attributed to a converging training effect among technicians across MR sites, and a higher sensitivity due to a decreasing variance of QA values. Additional external influencing factors like personnel rotation or maintenance cycles are under investigation.
Discussion and Conclusion
Fully automated and continuous QA value surveillance is essential for large MR cohort studies, providing valuable short-term information on multi-center acquisition stability and homogeneity, as well as crucial support for subsequent pooled data evaluation. Acquired data so far from the National Cohort MR Imaging Study show site specific differences with respect to most estimated QA values, not surprising given the high number of exams. Nevertheless, most QA values show a high degree of long-term stability and homogeneity across sites. Interestingly, recent data (first half-year period 2016) reveal slight trend changes in comparison to 2015 data, maybe uncovered by decreasing variance. Future data until 2018/19 will elucidate more correlations. Highly standardized protocols on identical scanners seem to be indispensable to reveal influencing factors of long-term multi-center MR studies. On this basis, a common reference for more heterogeneous (with respect to scanner types and vendors) might be established.
After finishing of baseline assessments in 2018/19, collected data will be available for research projects according to the Use and Access Policy of the German National Cohort [9].
Acknowledgements
The German National Cohort is an interdisciplinary project conducted by more than 30 research groups within the Helmholtz and the Leibniz Association, German Universities, and the Fraunhofer Association. The embedded MR Imaging Study is organized by the NAKO MR Imaging Core with colleagues from the University Hospital Großhadern Munich (project lead), University Medicine Greifswald (central data management and quality assurance), University Hospital Heidelberg and DKFZ Heidelberg (incidental findings committee), and the Fraunhofer MEVIS Bremen (MR data management and quality assessment). Further information on involved groups is found in references [1, 2].
The study was funded by the German Ministry for Education and Research (BMBF), the Federal States, and the Helmholtz Association.
References
[1]
German National Cohort (GNC) Consortium. The
German National Cohort: aims, study design and organization.
Eur J Epidemiol, 2014 May; 29(5):371-82.
[2]
Bamberg F, et al. Whole-Body
MR Imaging in the German National Cohort: Rationale, Design, and
Technical Background.
Radiology, 2015 Oct; 277(1):206-20.
[3]
Hirsch JH, et al. Fully
Automated Data Management and Quality Assurance in Very Large
Prospective Cohort MR Imaging Studies – the MR Imaging Study within
the German National Cohort (NAKO).
Proc International Society for Magnetic Resonance in Medicine 2016, #247.
[4]
Wang Z, Bovik C.
A Universal Image Quality Index.
IEEE Signal Proc Letters, 2002 March; 9(3):81-4.
[5]
Link F, et al. A
Flexible Research and Development Platform for Medical Image
Processing and Visualization. Proc
Radiological Society of North America; 2004 Dec; Chicago.
[6]
Shewhart WA. Economic
control of quality of manufactured product. D.
Van Nostrand Company, Inc., New York, 1931.
[7]
Mann, HB. Non-Parametric
Tests against Trend.
Econmetrica, 1945; 13:245-259.
[8]
Kendall, MG. Rank
Correlation Methods.
5th
Edition, Charles Griffin, London, 1990.
[9]
http://nako.de/allgemeines/der-verein-nationale-kohorte-e-v/beratungsgremien/use-access-komitee/
Figures
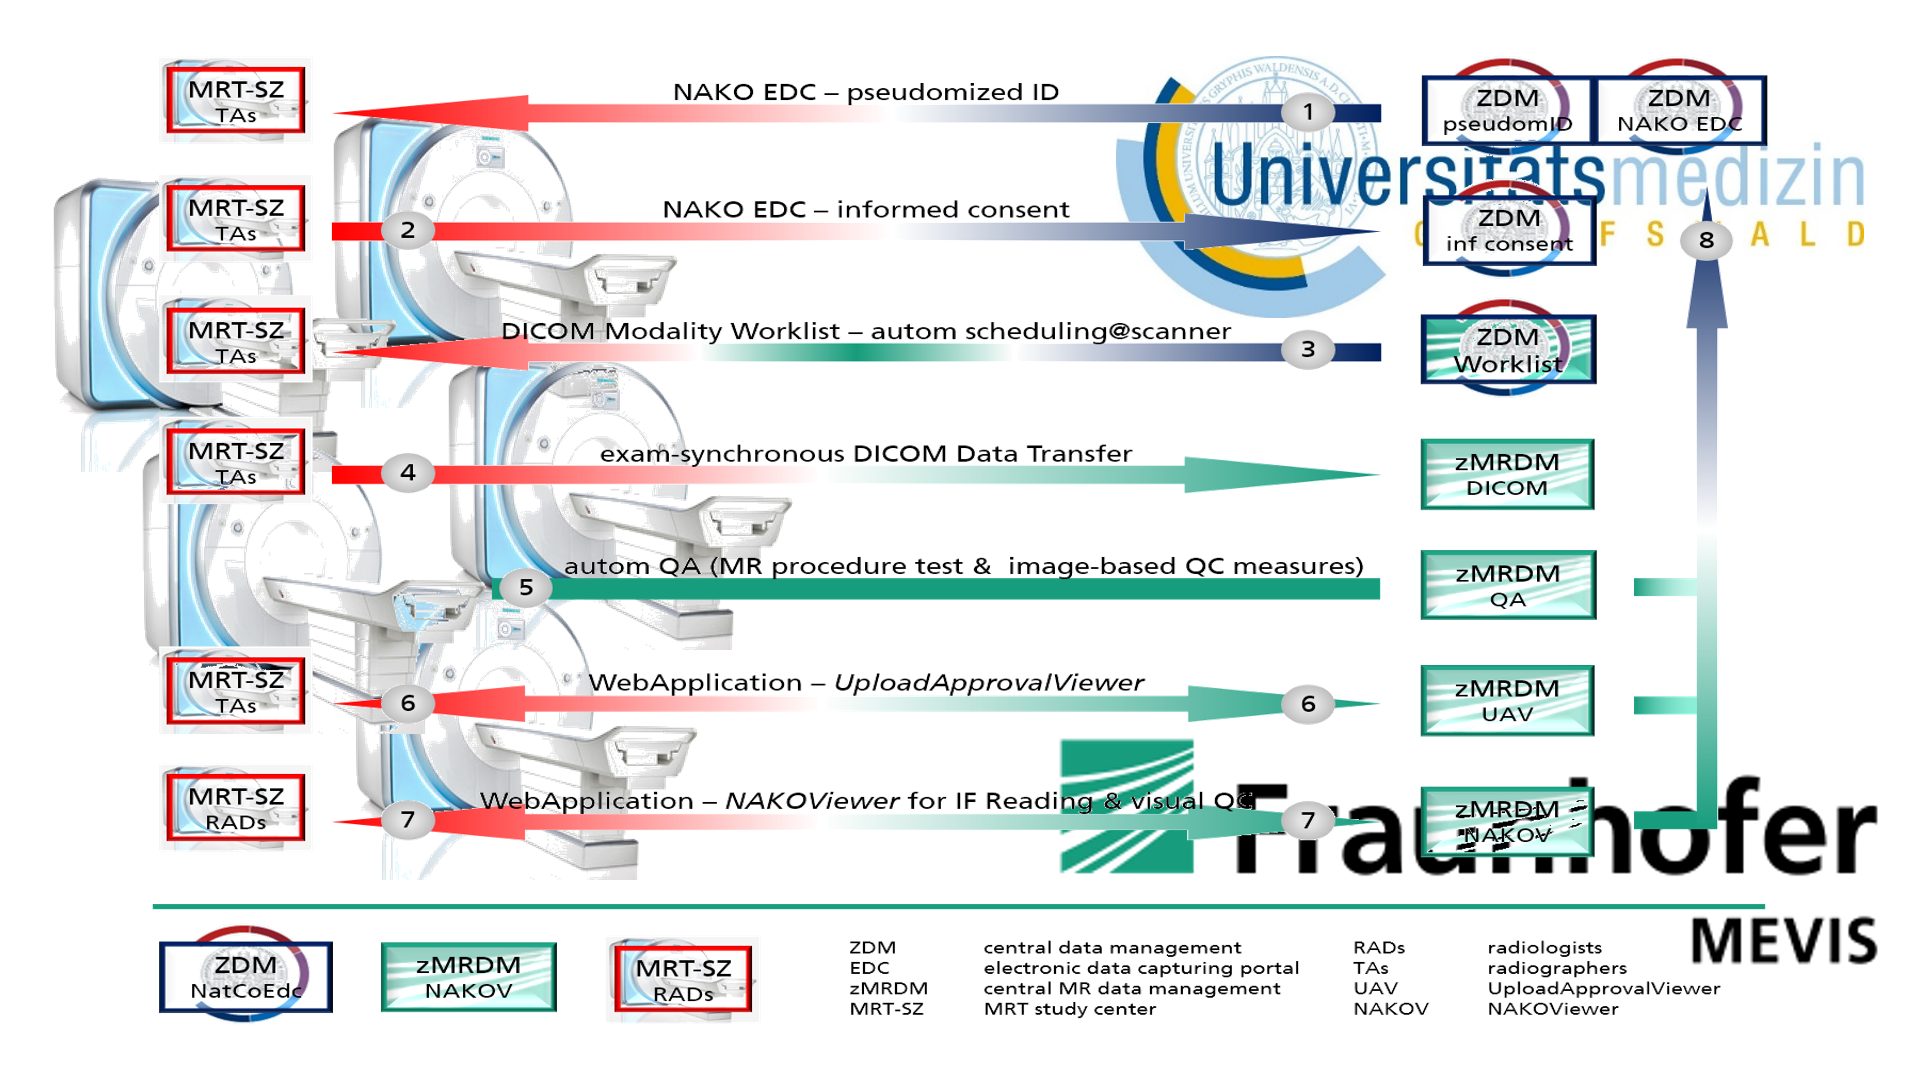
Fig 1 – Workflow chart of the MR Imaging Study within the German National Cohort (NAKO).
Workflow sketch showing automated processes and interactions between the central study management (incl the board of trustees, University Medicine Greifswald), local MR sites (technicians and radiologists), and the central MR data management (web-applications and QA, Fraunhofer MEVIS Bremen).
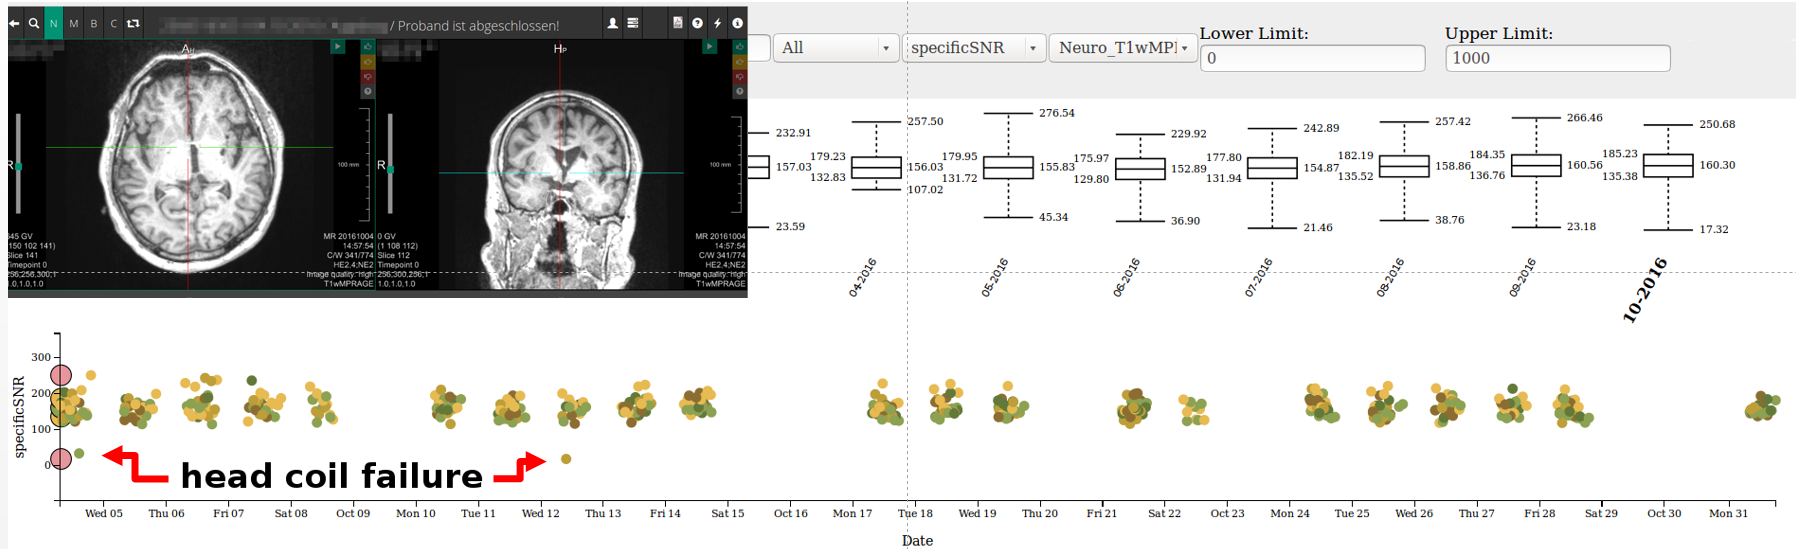
Fig 2 – Image-based quality assessment – QC on a daily basis, identifying acquisition and/or technical conspitcuities.
Plots of image-based QA parameters (examplarily “specificSNR”, T1wMPRAGE) showing exams across all sites within one month. Outliers due to technical and/or acquisition failures are easily depicted, and are used for training or maintenance purposes. The upper plot summerizes monthly mean and standard deviation QA values.
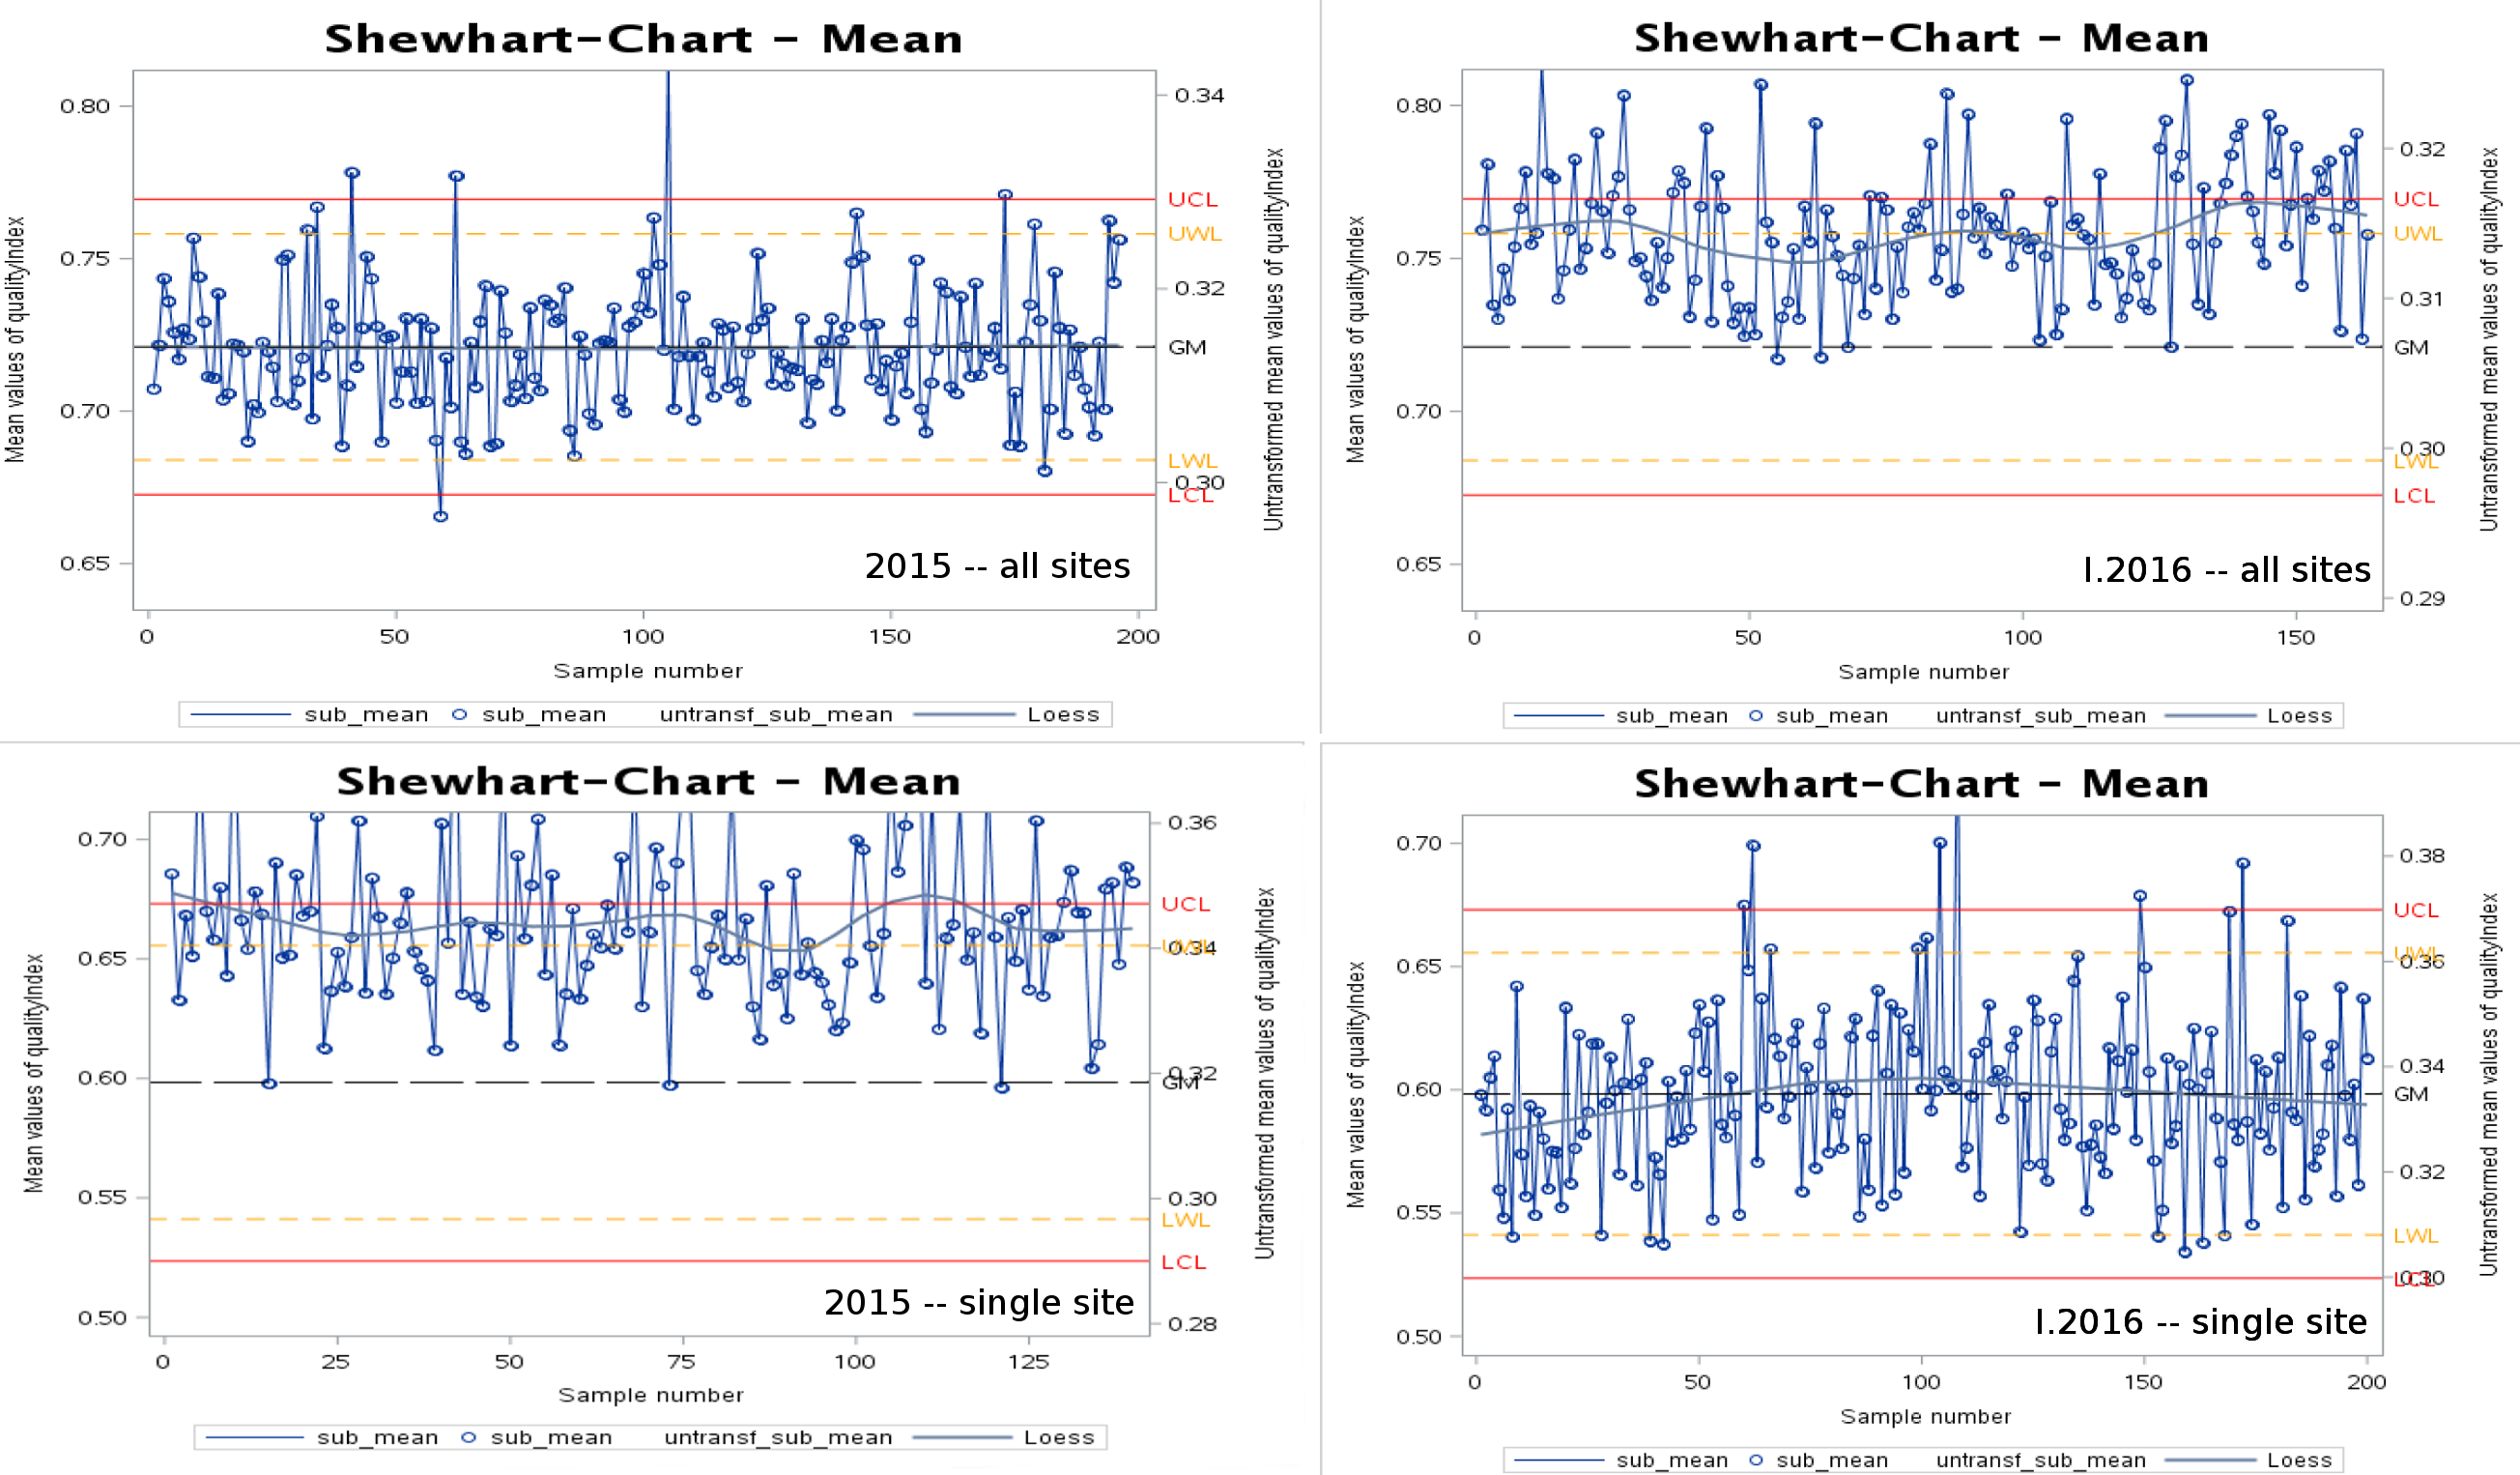
Fig 3 – Shewhart's Charts and Mann-Kendall Tests
Shewhart's charts quantify statistically significant differences between data groups or acquisition periods. For example, all exams in 2015 across all sites are taken as reference, upper/lower warning/critical limits (lcl, lwl, uwl, ucl) are calculated. Using this as reference, charts for single sites or different time periods reveal detailed information on data changes like short-term trend effects. Furthermore, the rate of outliers might be taken as quality measure. The charts show the qualityIndex of the hip protocol as example.