4449
Gradient Echo vs. Spin Echo MRI to Determine Liver Iron Concentration1Diagnostic and Interventional Radiology, Ulm University, Medical Center, Ulm, Germany, 2Section for Experimental Radiology, Ulm University, Medical Center, Ulm, Germany, 3Department of Pediatrics and Adolescent Medicine, Ulm University, Medical Center, Ulm, Germany
Synopsis
To evaluate an alternative to an established method for liver iron content (LIC) determination based on spin-echo (SE) MRI, we analyzed 195 MRI scans, including both SE and gradient echo (GRE) protocols, of regularly transfused patients suspected for liver iron overload. A relationship was derived between reference LIC obtained by Ferriscan® and GRE data. From this, LIC was determined using GRE acquisitions and these values correlated to reference LIC. Considering the LIC threshold of 80 µmol/g (4.5 mg/g) relevant for therapy, diagnostic accuracy of the GRE approach was quite good, with sensitivity and specificity of 99/98 % compared to Ferriscan®.
Clinical Question
Determination of Liver Iron Concentration (LIC).Impact
Iron accumulates in patients with diseases requiring regularly blood transfusion. If untreated, iron overload causes severe organ malfunction, and in the end, organ failure. Treatment with iron chelators, however, has to be monitored to avoid overtreatment. The organ best suited to screen whole-body iron content is the liver. Therefore, regularly transfused patients undergo liver MRI scans each year.Approach
An FDA approved protocol for MRI based LIC determination named Ferriscan® (Resonance Health, Claremont, WA, Australia), based on spin-echo (SE), is used since about ten years (1). It requires five separate acquisitions of at least one minute duration each, periodic scanner calibration, and charge fees apply. Attempts have been made to shorten MR scan time using gradient echo and paraspinal muscles as internal reference (2,3). However, results differed from reference LIC (4). Our new approach working with gradient echo requires one single breathhold to obtain sufficient information for determining LIC with equivalent reliability. No calibration is needed, and there are no costs.Gains and Losses
A) Gain: scan time
MR investigation is shortened by at least 60%, increasing patient comfort and reducing required MR scanner time.
B) Loss: coverage
Compared to 11 slices of the liver, acquired with SE, GRE is limited to 5 slices. However, GRE exam can be easily extended to cover the whole liver by two additional breathholds.
C) Loss: resolution
Since breathhold is needed for GRE, resolution had to be reduced due to time limits.
D) Loss: SNR
On the other hand, reducing resolution increases SNR. SNR is larger for SE, not only due to higher intrinsic signal, but also because surface array coils can be used. The SIR analysis proposed for GRE, however, relies on homogenous signal throughout the whole image. Therefore, the body volume coil had to be used as receiver, with lower SNR than surface array coils.
E) Gain: rapid diagnosis
Sophisticated postprocessing is needed for SE data, which requires data transfer for centralized analysis, taking at least one working day. GRE analysis, however, is simple and can be performed immediately after the scan, yielding instant LIC results.
F) Gain: no scanner calibration
Since signal of paraspinal muscles is used as internal reference, there is no need for calibration of the MR scanner.
Preliminary Data
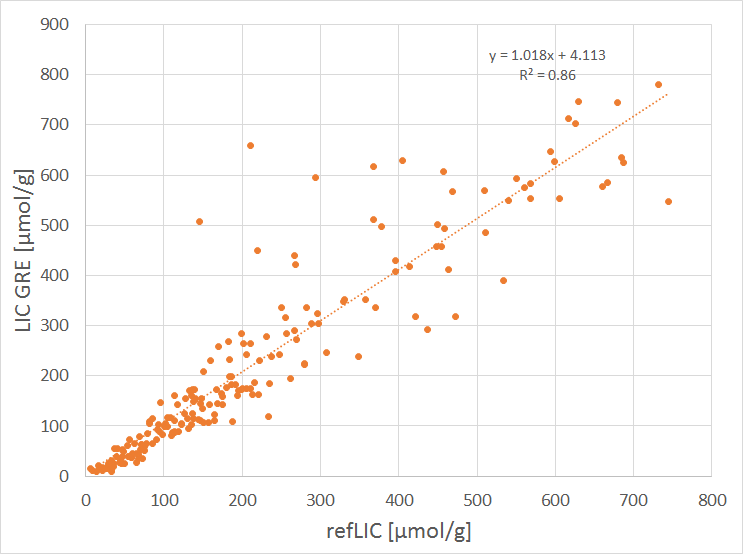
With regard to the clinical question, image quality is not the matter of concern, but reliable quantitative LIC values. To address this, 195 investigations of regularly transfused patients (86 f, 109 m, age range 1.9 to 79.9 (29.1 ± 20) years) were analyzed with both methods. Correlation and congruence was good between both methods, cf. fig. 1. Considering the LIC threshold of 80 µmol/g (4.5 mg/g) relevant for therapy, we observed a sensitivity/specificity of 99/98 % for the GRE method compared to the SE method. This indicates equivalent clinical value for both methods. To determine LIC from GRE data, we used a correlation valid for the whole patient cohort in this preliminary analysis. This might be optimized with disease-specific LIC determination, since there is evidence for differing correlation between GRE data and reference LIC for diverse diseases. Neglecting this fact in the present study probably accounts for the scatter obvious in fig. 1.Acknowledgements
No acknowledgement found.References
1. St Pierre TG, Clark PR, Chua-anusorn W, Fleming AJ, Jeffrey GP, Olynyk JK, et al. Noninvasive measurement and imaging of liver iron concentrations using proton magnetic resonance. Blood. 2005; 105(2):855-61. PubMed PMID: 15256427.
2. Alustiza JM, Artetxe J, Castiella A, Agirre C, Emparanza JI, Otazua P, et al. MR quantification of hepatic iron concentration. Radiology. 2004; 230(2):479-84. PubMed PMID: 14668426.
3. Gandon Y, Olivie D, Guyader D, Aube C, Oberti F, Sebille V, et al. Non-invasive assessment of hepatic iron stores by MRI. Lancet. 2004; 363(9406):357-62. PubMed PMID: 15070565.
4. Juchems MS, Cario H, Schmid M, Wunderlich AP. Liver iron content determined by MRI: spin-echo vs. gradient-echo. RoFo 2012; 184(5):427-31. PubMed PMID: 22351500.
Figures