4441
A novel method to maintain PET detector performance in the presence of MR gradient induced heating1Applied Science Lab, GE Healthcare, Menlo Park, CA, United States, 2PET/MR engineering, GE Healthcare, Waukesha, WI, United States, 3Imaging Subsystems, GE Healthcare, Waukesha, WI, United States, 4Radiology Department, Stanford Unviersity, Palo Alto, CA, United States
Synopsis
In a simultaneous ToF-enabled SiPM PET/MR scanner, eddy currents induced by the changing gradient field lead to increased temperature around the PET detectors; this can change the detector gain and shift the position of the photopeak in the spectrum, reducing accuracy of the reconstructed image. Conventionally, peak stability is achieved by thermal monitoring system and adjusting the gain based on the temperature. A more accurate gain control algorithm is presented, which analyzes the spectrum of single events detected on each device. Reconstructed activity of a PET phantom in extreme MR gradient switching is measured to remain stable, better than 0.5%.
Purpose
In a simultaneous ToF-enabled SiPM PET/MR scanner, gradient induced eddy currents lead to increased temperature around the PET detectors and change the detector gain. This will lead to shifting the energy peak for detected events and thus reducing accuracy specifically in applications such as simultaneous fMRI and functional PET1, which are very sensitive to small changes in tracer’s activity. Conventionally, peak stability is achieved by monitoring system temperature and adjusting the gain accordingly2,3. Here, we have shown a more accurate gain compensation by analyzing the spectrum of single events detected by each device.Theory
The time-of-flight enabled SIGNA PET/MR (GE Healthcare, Waukesha, WI, USA) detector ring consists of 28 modules. Each module (shown in Figure 1, top row), comprises 5 units, each having 4 blocks with 3 SiPM arrays (devices) each. Single events from each channel (either block or device) are analyzed at the detector level, and as soon as a statistically significant shift is detected in the gain, an adjustment is made to the gain of the channel.Methods
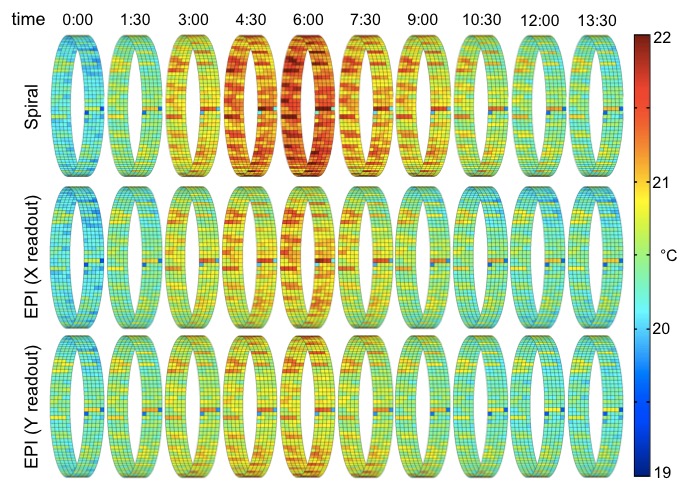
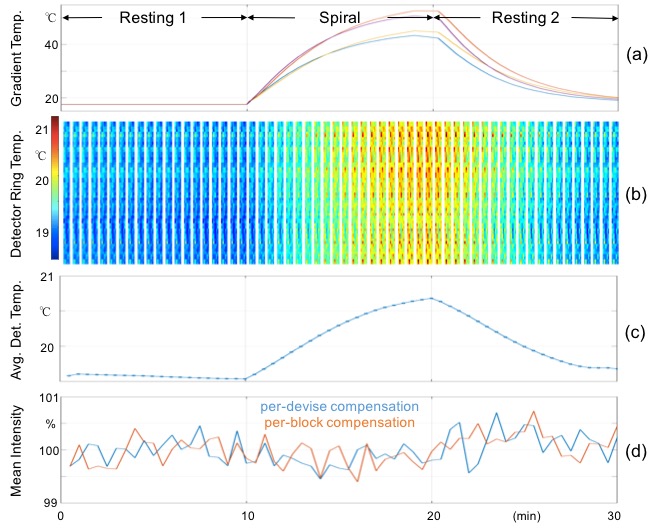
An EPI GRE sequence and a Spiral in-and-out GRE sequence are used to compare the effect of gradient heating on the PET detector. The EPI GRE parameters were: TR=3100 ms, TE=30 ms, FOV=22 cm, FA=77 degree, 64x64 matrix, 30 slices, 4 mm thickness, 1 mm spacing, 116 temporal phases and 6:00 min scan time. The EPI sequence was repeated twice with X and Y readouts. The spiral sequence parameters were: TR=2400 ms, TE=30 ms, FOV=24 cm, FA=90 degree, 96x96 matrix, 30 slices, 5 mm thickness, 0 mm spacing, 150 temporal phases and 6:00 min scan time. A flood phantom was filled with 2.5 mCi of FDG and was scanned immediately for 30 minutes. There was no MR sequence in the first 10 minutes and events were detected in the resting state. Then a 10 min spiral sequence (with 250 temporal phases) was used to increase the detector temperature and it was followed by another 10 min resting state as the detector ring cooled down. The detector front end logic was programmed with a prototype algorithm for real-time gain control, and data that passed the energy cutoff levels (425 keV to 650 keV) was written to list mode file. To evaluate the effect of local temperature variations, events were aggregated either on a per-device level (12 crystals) or per-block level (36 crystals). The PET list file was un-listed into 30 frames and reconstructed with TOF-OSEM with 28 subsets and 3 iterations using attenuation, scatter and dead-time correction.Results
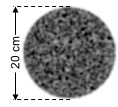
Figure 2 compares the PET detector temperatures using a 6 min EPI sequence vs. spiral sequence followed by 7:30 min of cool down period. The EPI sequence heats up the PET detector along the readout axis. The spiral sequence heats up the entire ring about 1.5 °C and causes higher temperatures on the PET detector compared to EPI sequence. Figure 4 evaluates the effect of a 10:00 min spiral sequence on the PET images of a phantom (Figure 3). Figure 4(a) shows the 4 temperature readings located on different parts of the gradient coil and shows that the spiral sequence is increasing the coil temperature up to 55 °C from its resting state of 18 °C. The detector ring temperature map and its average is shown in figure 4(b) and 4(c) respectively. It shows that the detector temperatures are increased by an average of 1.5 °C. Figure 4(d) shows the average of phantom images using 2 compensation methods: per-block and per-SiPM device. Both methods show a stable reading throughout the spiral reading and during the cooling down period. The maximum changes in reconstructed uniformity are 0.32% and 0.34% for gain control per SiPM array and per block respectively.Discussion
Both compensation methods (per SiPM array and per block) show excellent results providing a very stable PET reading during the most gradient-stressful spiral MR sequence on the PET/MR scanner. Compensation per SiPM array shows slightly better results as it tracks the 3 SiPM arrays in each block individually. However, in PET exams with very small doses, compensation per block will provide faster response to changing temperatures, as the count rate will be 3 times than on an individual SiPM array.Acknowledgements
GE Healthcare, Stanford University Lucas Center.
References
[1] Wang F, Hamilton P, Knutson B, Gotlib I, Sacchet M, Mehta H, Schreiner C, Holley D, Chin F, Shen B, Zaharchuk G, Khalighi MM, Glover G. A Preliminary Study of Major Depressive Disorder Using Simultaneous PET/fMRI with Two MID Tasks in a Single Scan, ISMRM 2016, p3766
[2] Kim C, Peterson WT, Kidane T, Maramraju SH, Levin CS. Compensation for thermally-induced loads on PET detectors from MR stimulus in simultaneous PET/MR, ISMRM 2014, p780.
[3] Levin CS, Maramraju HS, Khalighi MM, Deller TW, Delso G, Jansen F. Design Features and Mutual Compatibility Studies of the Time-of-Flight PET Capable GE SIGNA PET/MR System. IEEE TMI. 2016; 35(8):1907-14
Figures
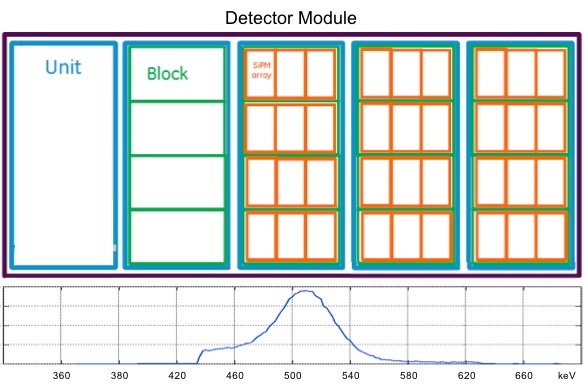
Figure 1: The detector module (top row), consists of 28 modules. Each module comprises 5 units, each having 4 blocks with 3 SiPM arrays (device) each. Single events from each channel (either block or device) are analyzed at the detector level and their spectrum is calculated (bottom row). The gain of the channel is adjusted as soon as a statistically significant shift is detected.