4438
Compact NMR Spectrometer for 129Xe Polarization Monitoring with Java Based Signal Processing and User Interface1Unit of Academic Radiology, University of Sheffield, Sheffield, United Kingdom
Synopsis
Monitoring of the 129Xe polarization by NMR during spin-exchange optical pumping (SEOP) is vital for quality control and for experimental investigations into optimizing system running parameters. In this study, we present a compact NMR spectrometer designed to improve user flexibility and reduce cost for online polarimetry on a 129Xe SEOP system. A Java-based user interface was developed to control the system with an Arduino based hardware control. The performances of the user interface and hardware in routine 129Xe NMR spectrometer measurements are demonstrated herein.
Background
Monitoring the polarization level of 129Xe in a spin-exchange optical pumping (SEOP) polarizer imposes engineering challenges for portability, compactness and cost. To date, many systems have been developed for this purpose, but have either lacked an integrated computer interface1-3 or relied upon expensive proprietary hardware and software for analogue to digital conversion4-5.Purpose
Development of a NMR spectrometer for low-field (~2.5 mT) NMR of 129Xe that integrates open source hardware (Arduino) and software (Java) to minimize cost while maximizing user flexibility.Methods
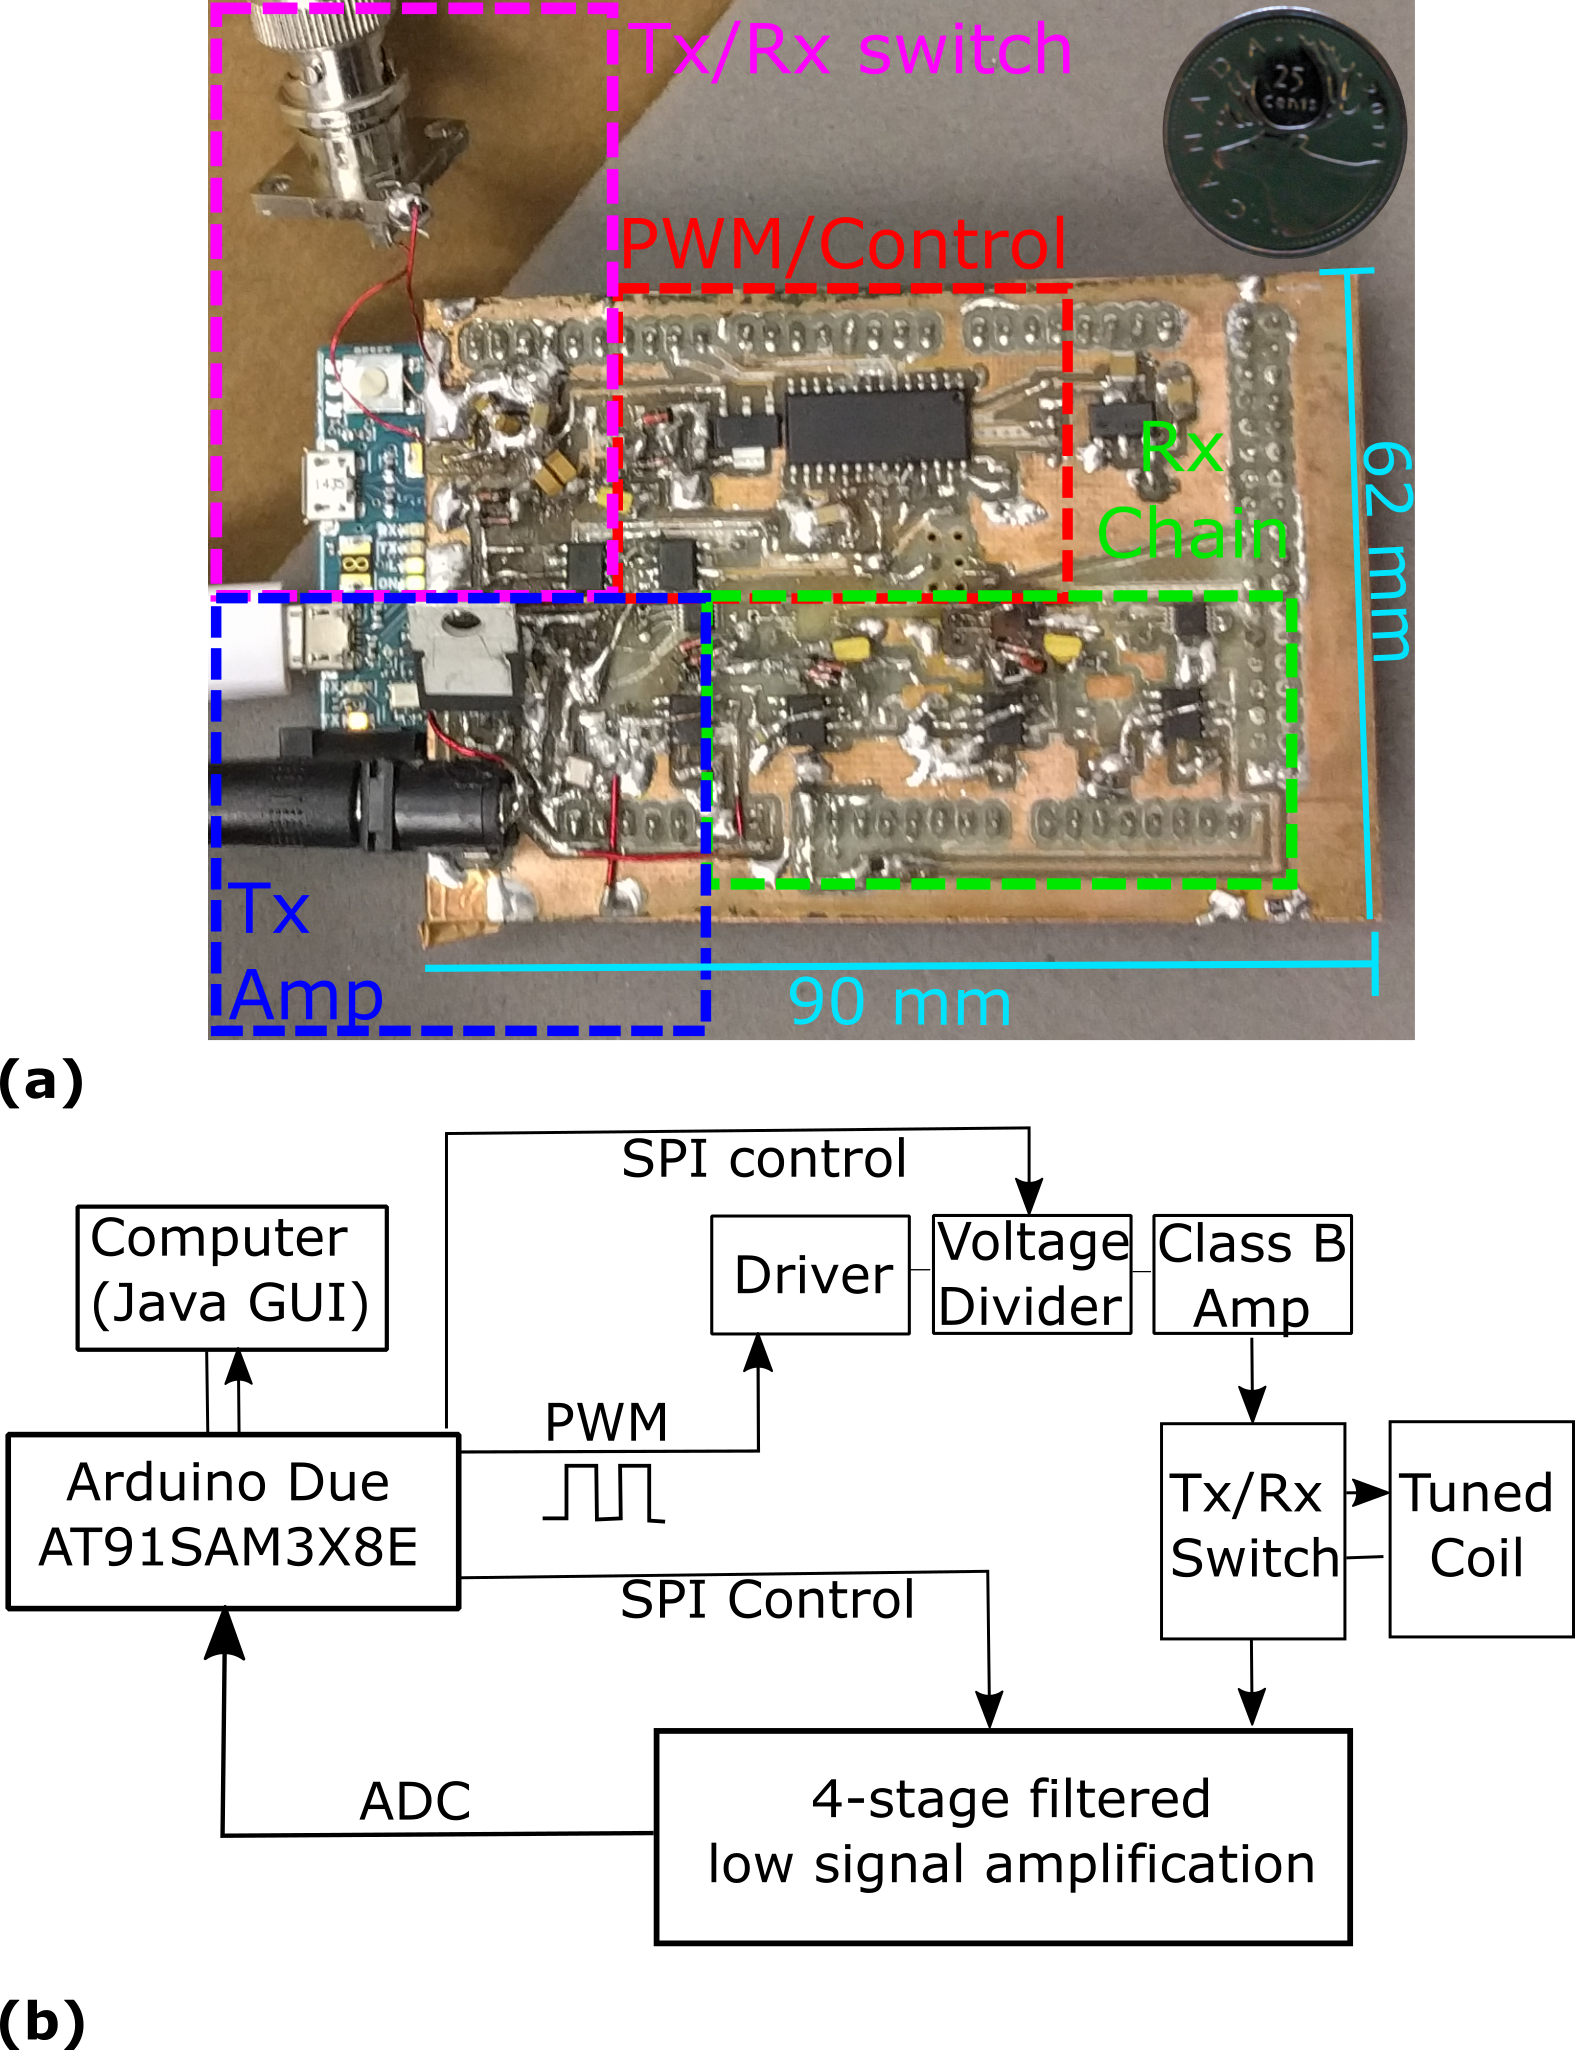
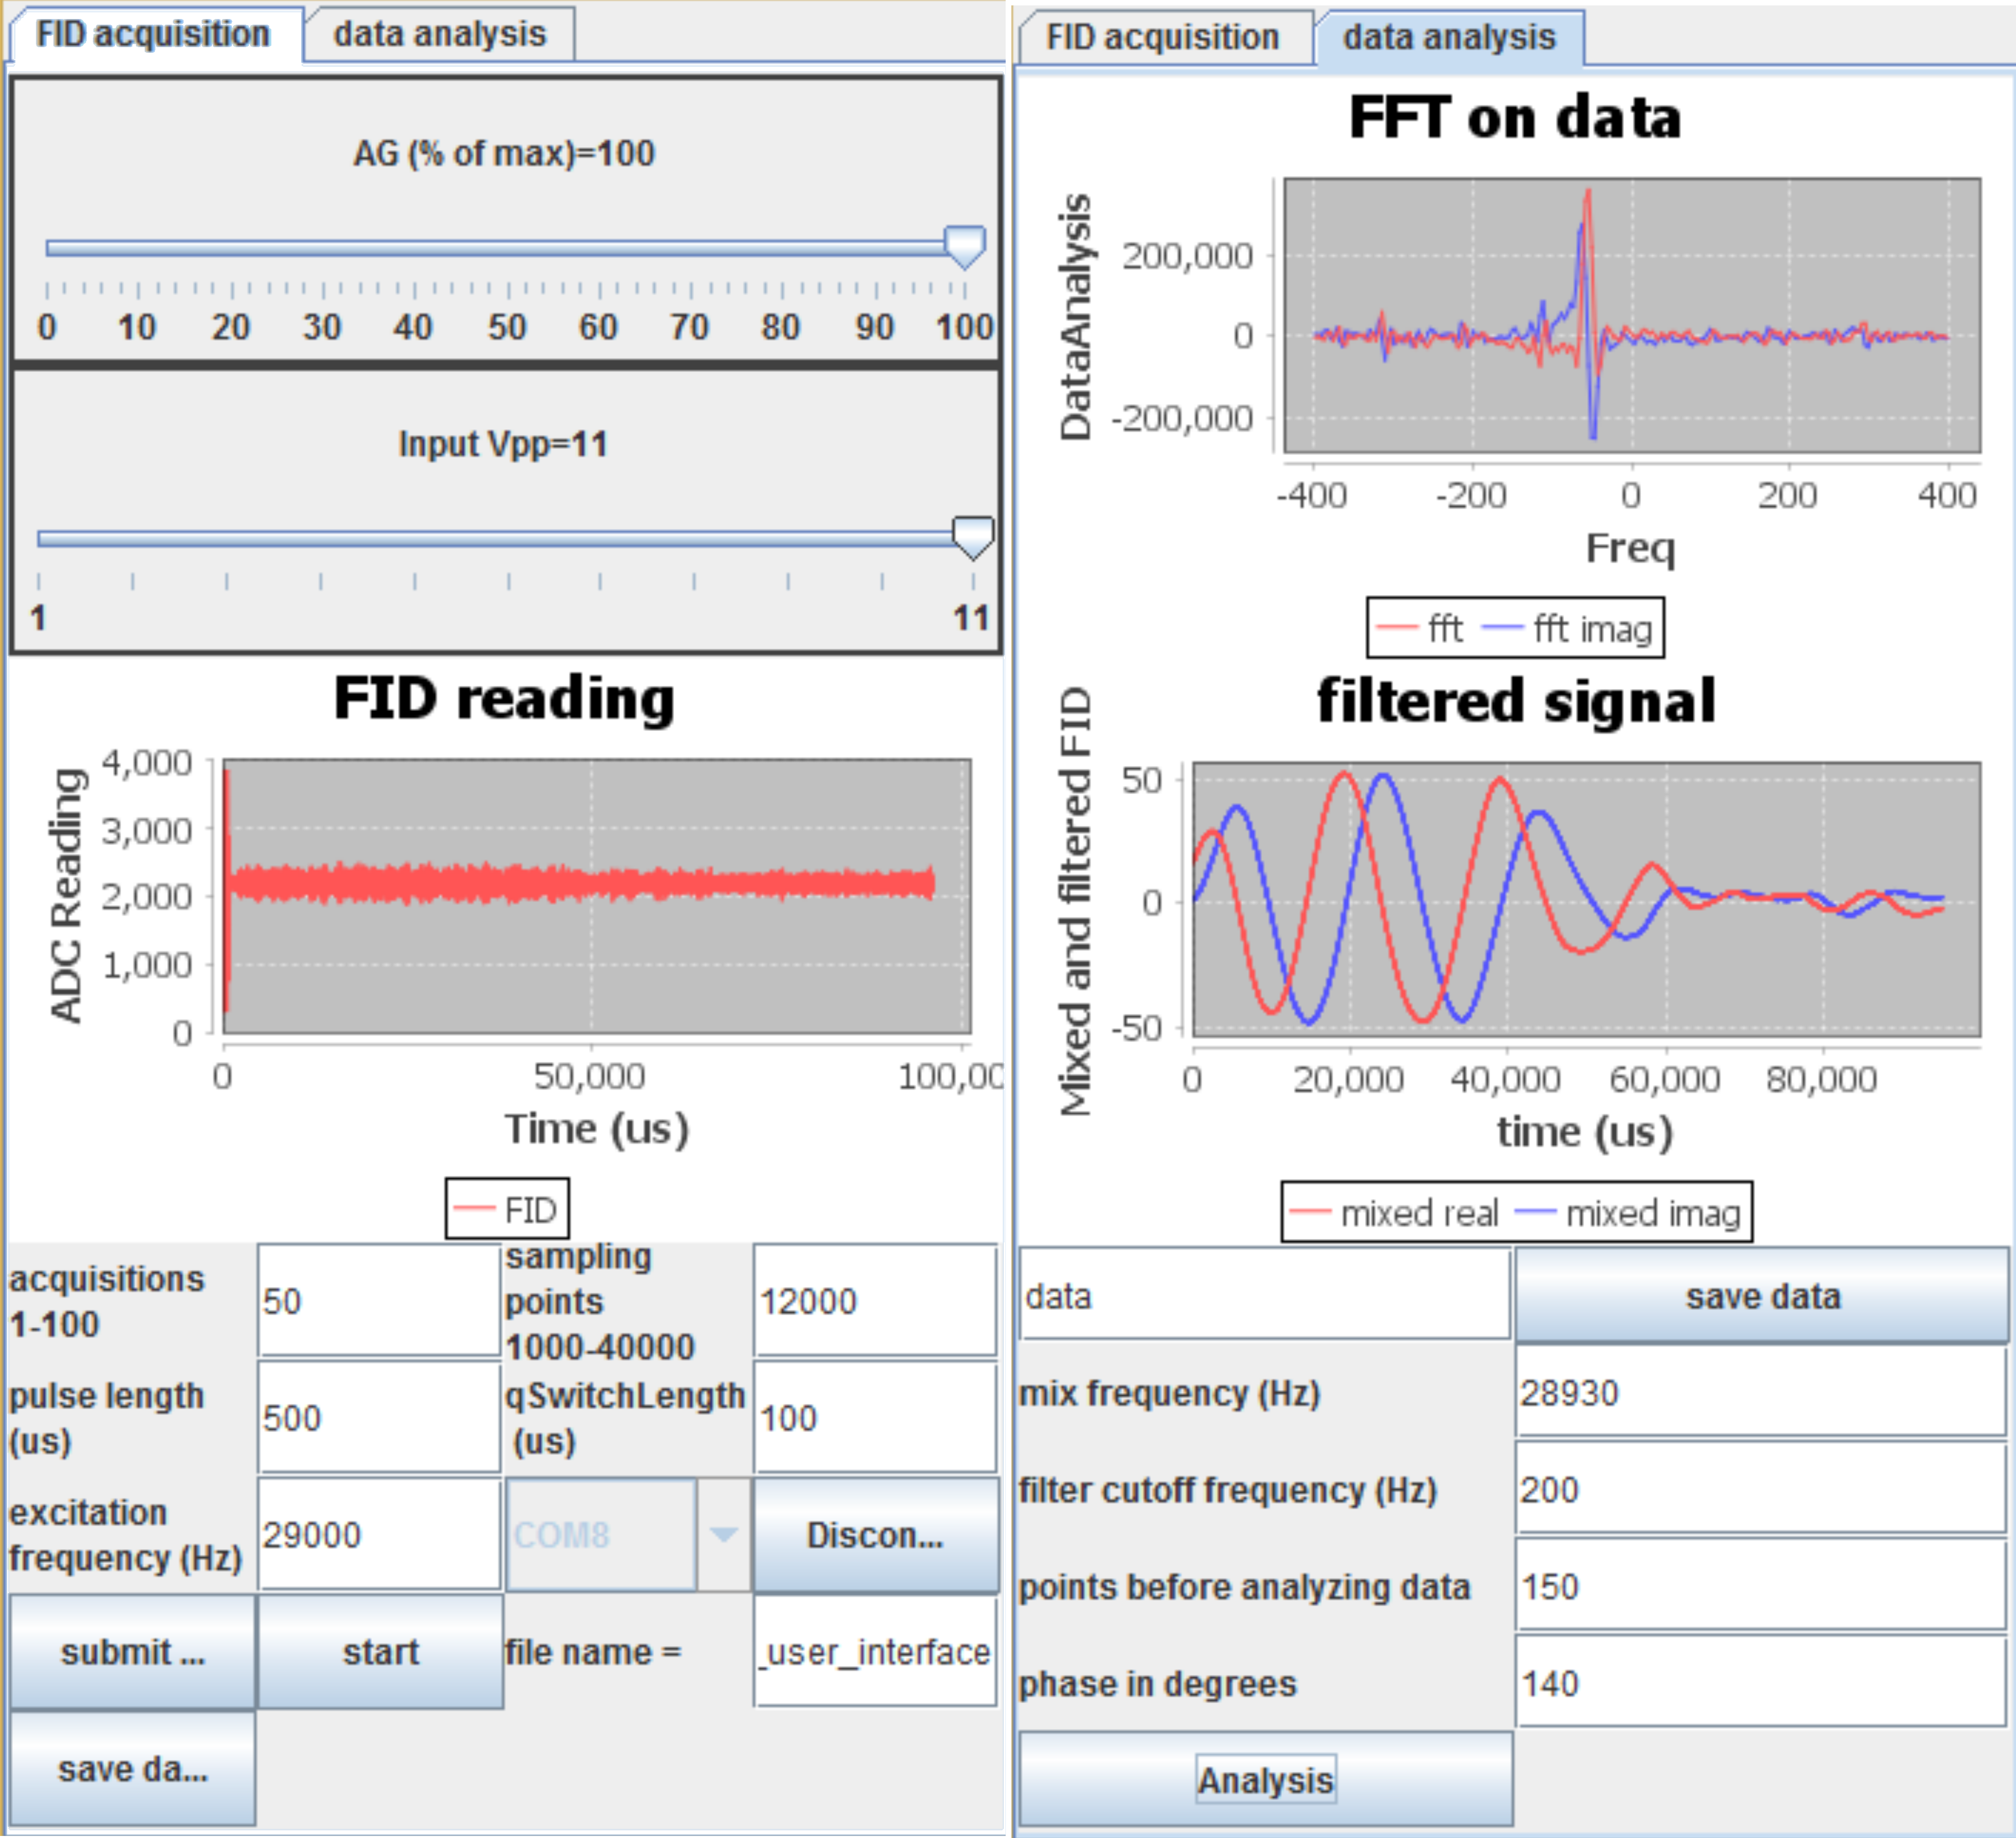
The spectrometer in Figure 1(a) is a two-part construction, consisting of an Arduino-based digital component and custom-designed analogue component. Functionally, the spectrometer is composed of the modules in Figure 1(b). Firstly, a transmit module with class B LM675 amplifier; and secondly, a receiver module made of four stage amplification, filters and 12 bit ADC @ 125 kHz sampling rate. Data is transferred by serial communication between the Arduino processor and the computer. As seen in Figure 1(a), analogue circuits are mounted on a separate custom board, which is fitted to the Arduino board (only partly visible in Figure 1(a)). The Arduino generates the transmission signal (129Xe Larmor frequency @ 2.5 mT B0 field 29.4 kHz). The Java user interface is shown in Figure 2, which includes control of transmit and receive voltage gain and NMR sampling parameters such as acquisition time and spectral resolution. The transmit and receive gains are regulated by digital potentiometers; maximum receiver chain gain is 10 000 V/V (80dB) and actively bandpass filtered for maximum gain at 30 KHz. NMR parameters include: input voltage, analogue gain, pulse length, Q-switch length, number of acquisitions, sampling points and excitation frequency. A Q-damping circuit4 was employed to reduce coil ringing and was switched on for 50-200 µs after the pulse. The JAVA GUI communicates with the microcontroller at 328, 125 bits/s. FIDs or processed FIDs can be saved as text files for signal analysis. Results are displayed in real time and can be analysed with user-varied parameters: mixing frequency, low pass filter frequency cutoff, start point for analysis, and phase of mixing frequency. Measurements presented here utilized a 150 turn, 2.2 cm diameter (measured 480 µH inductance and 2.1 Ω resistance) coil tuned with a parallel capacitor. For 129Xe polarization measurements, the coil was placed on the surface of the SEOP cell. Pulse width was optimized for maximum signal, and from the beginning of the polarization process, the spectral magnitude at the 129Xe Larmor frequency was measured every 30 seconds to determine the Rb-129Xe spin-up time constant.Results
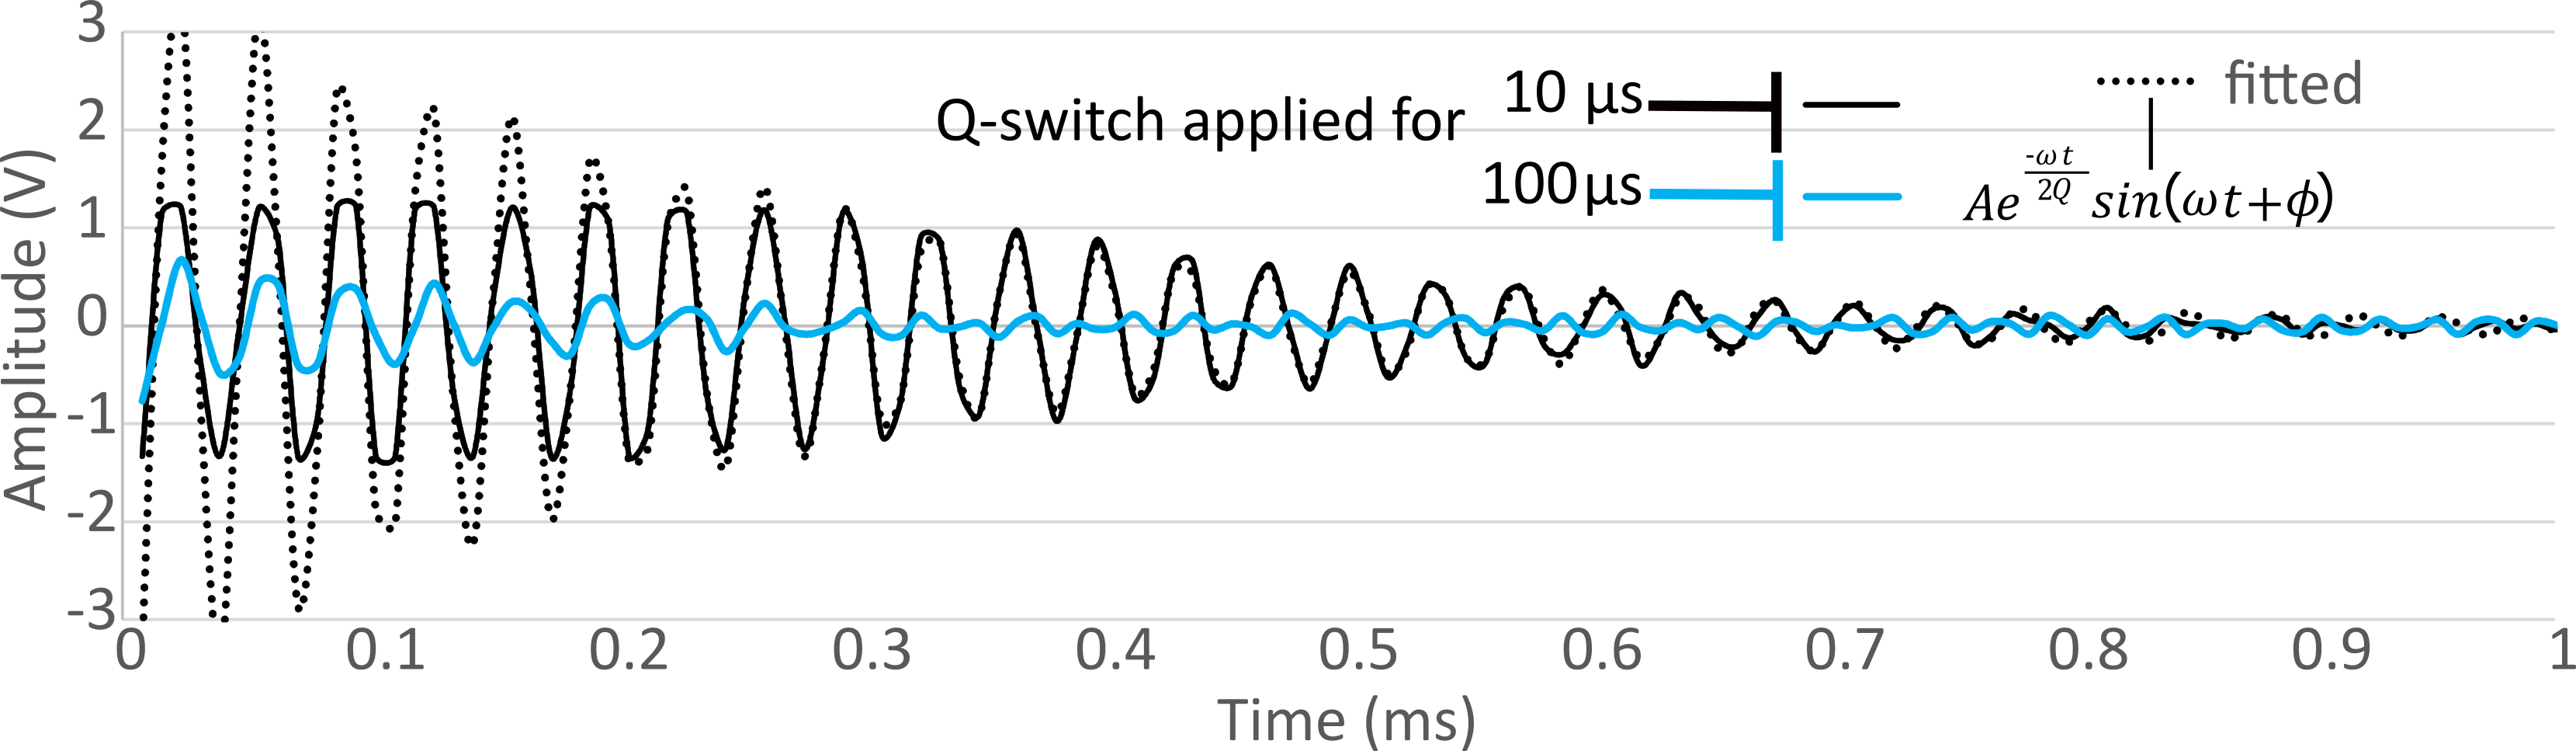
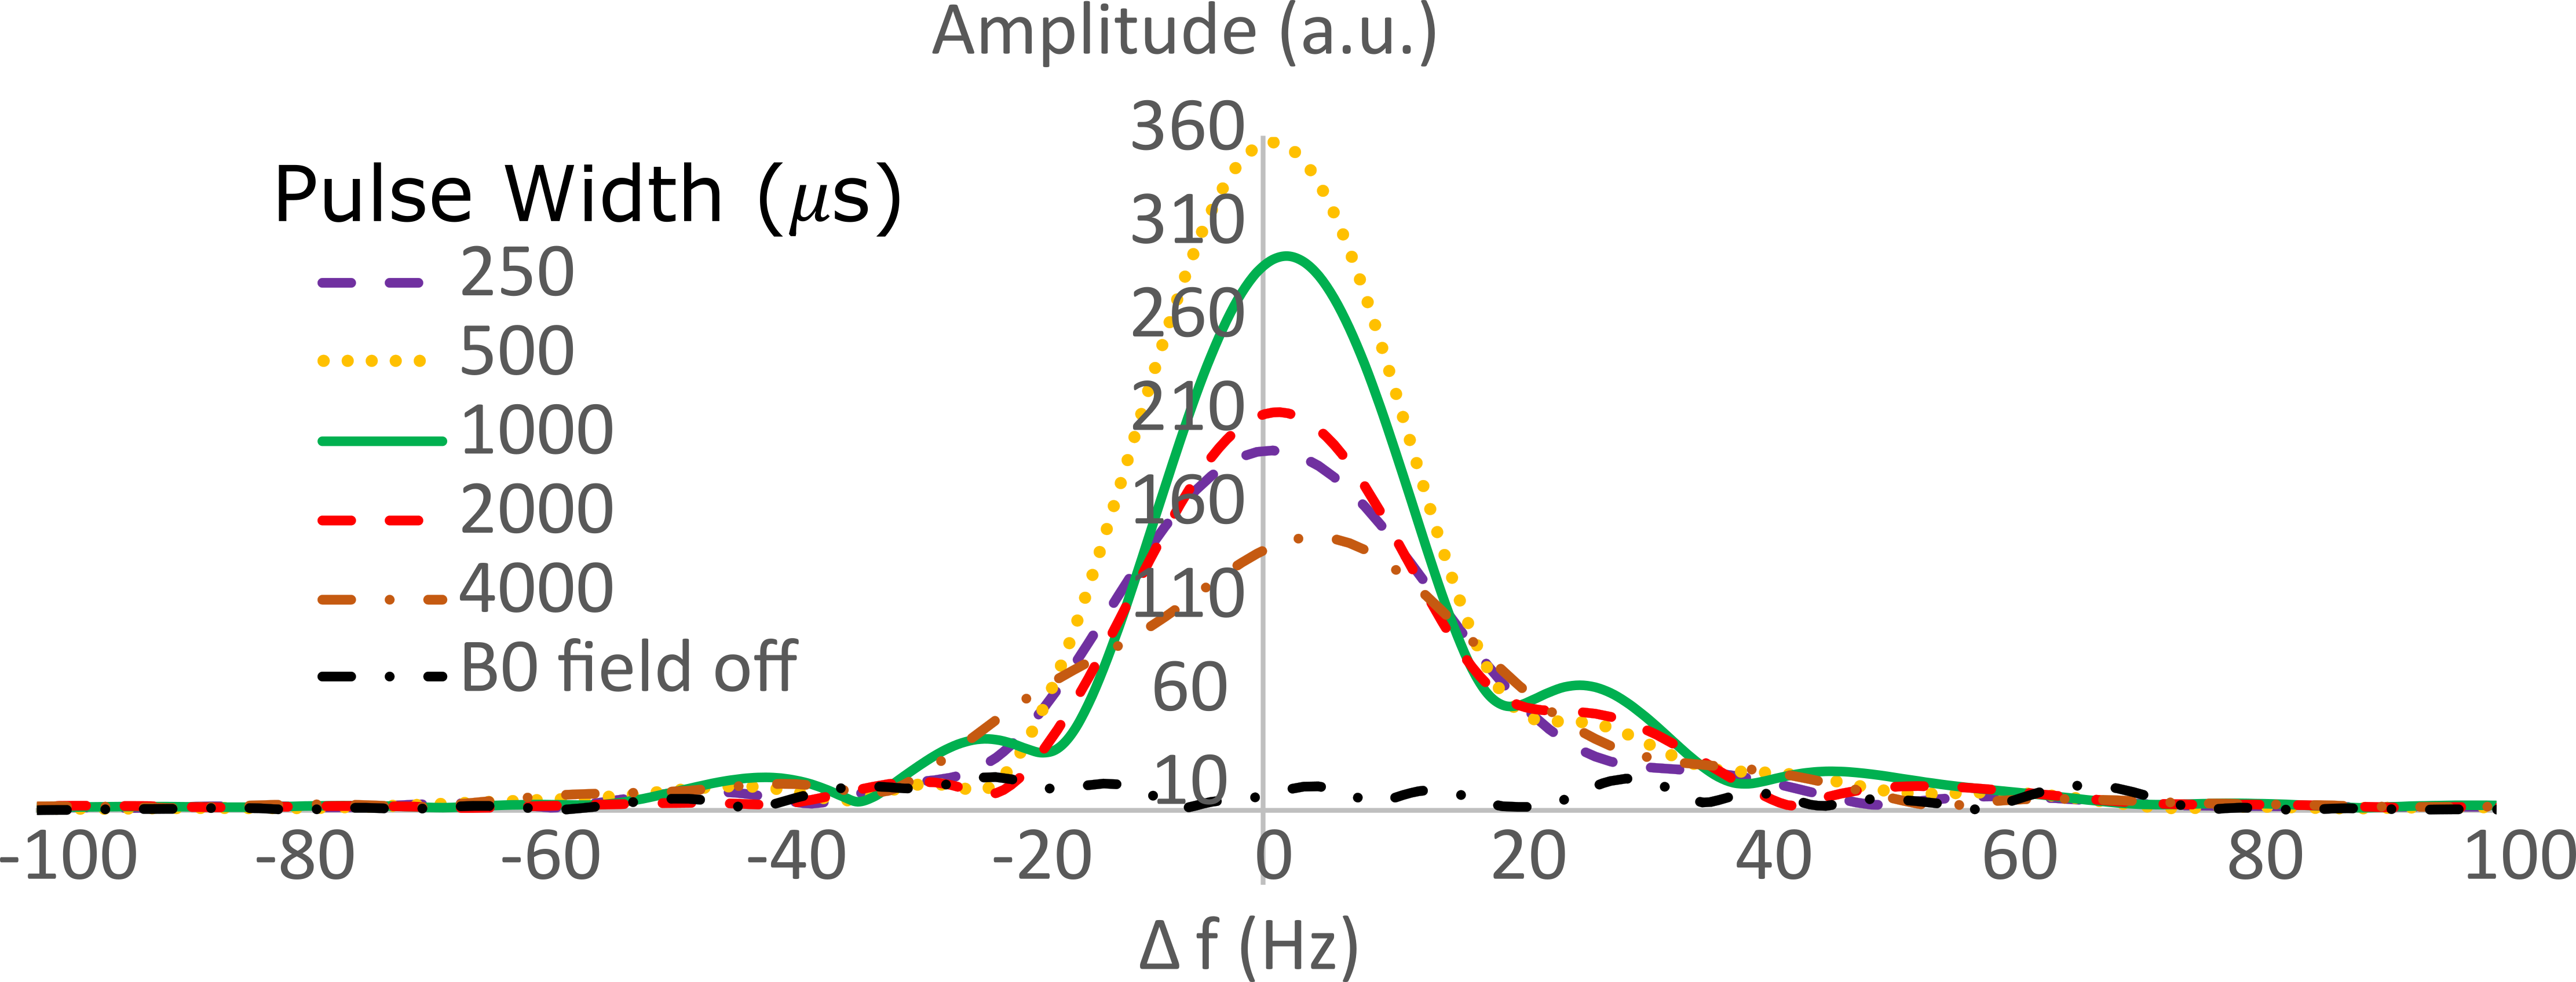
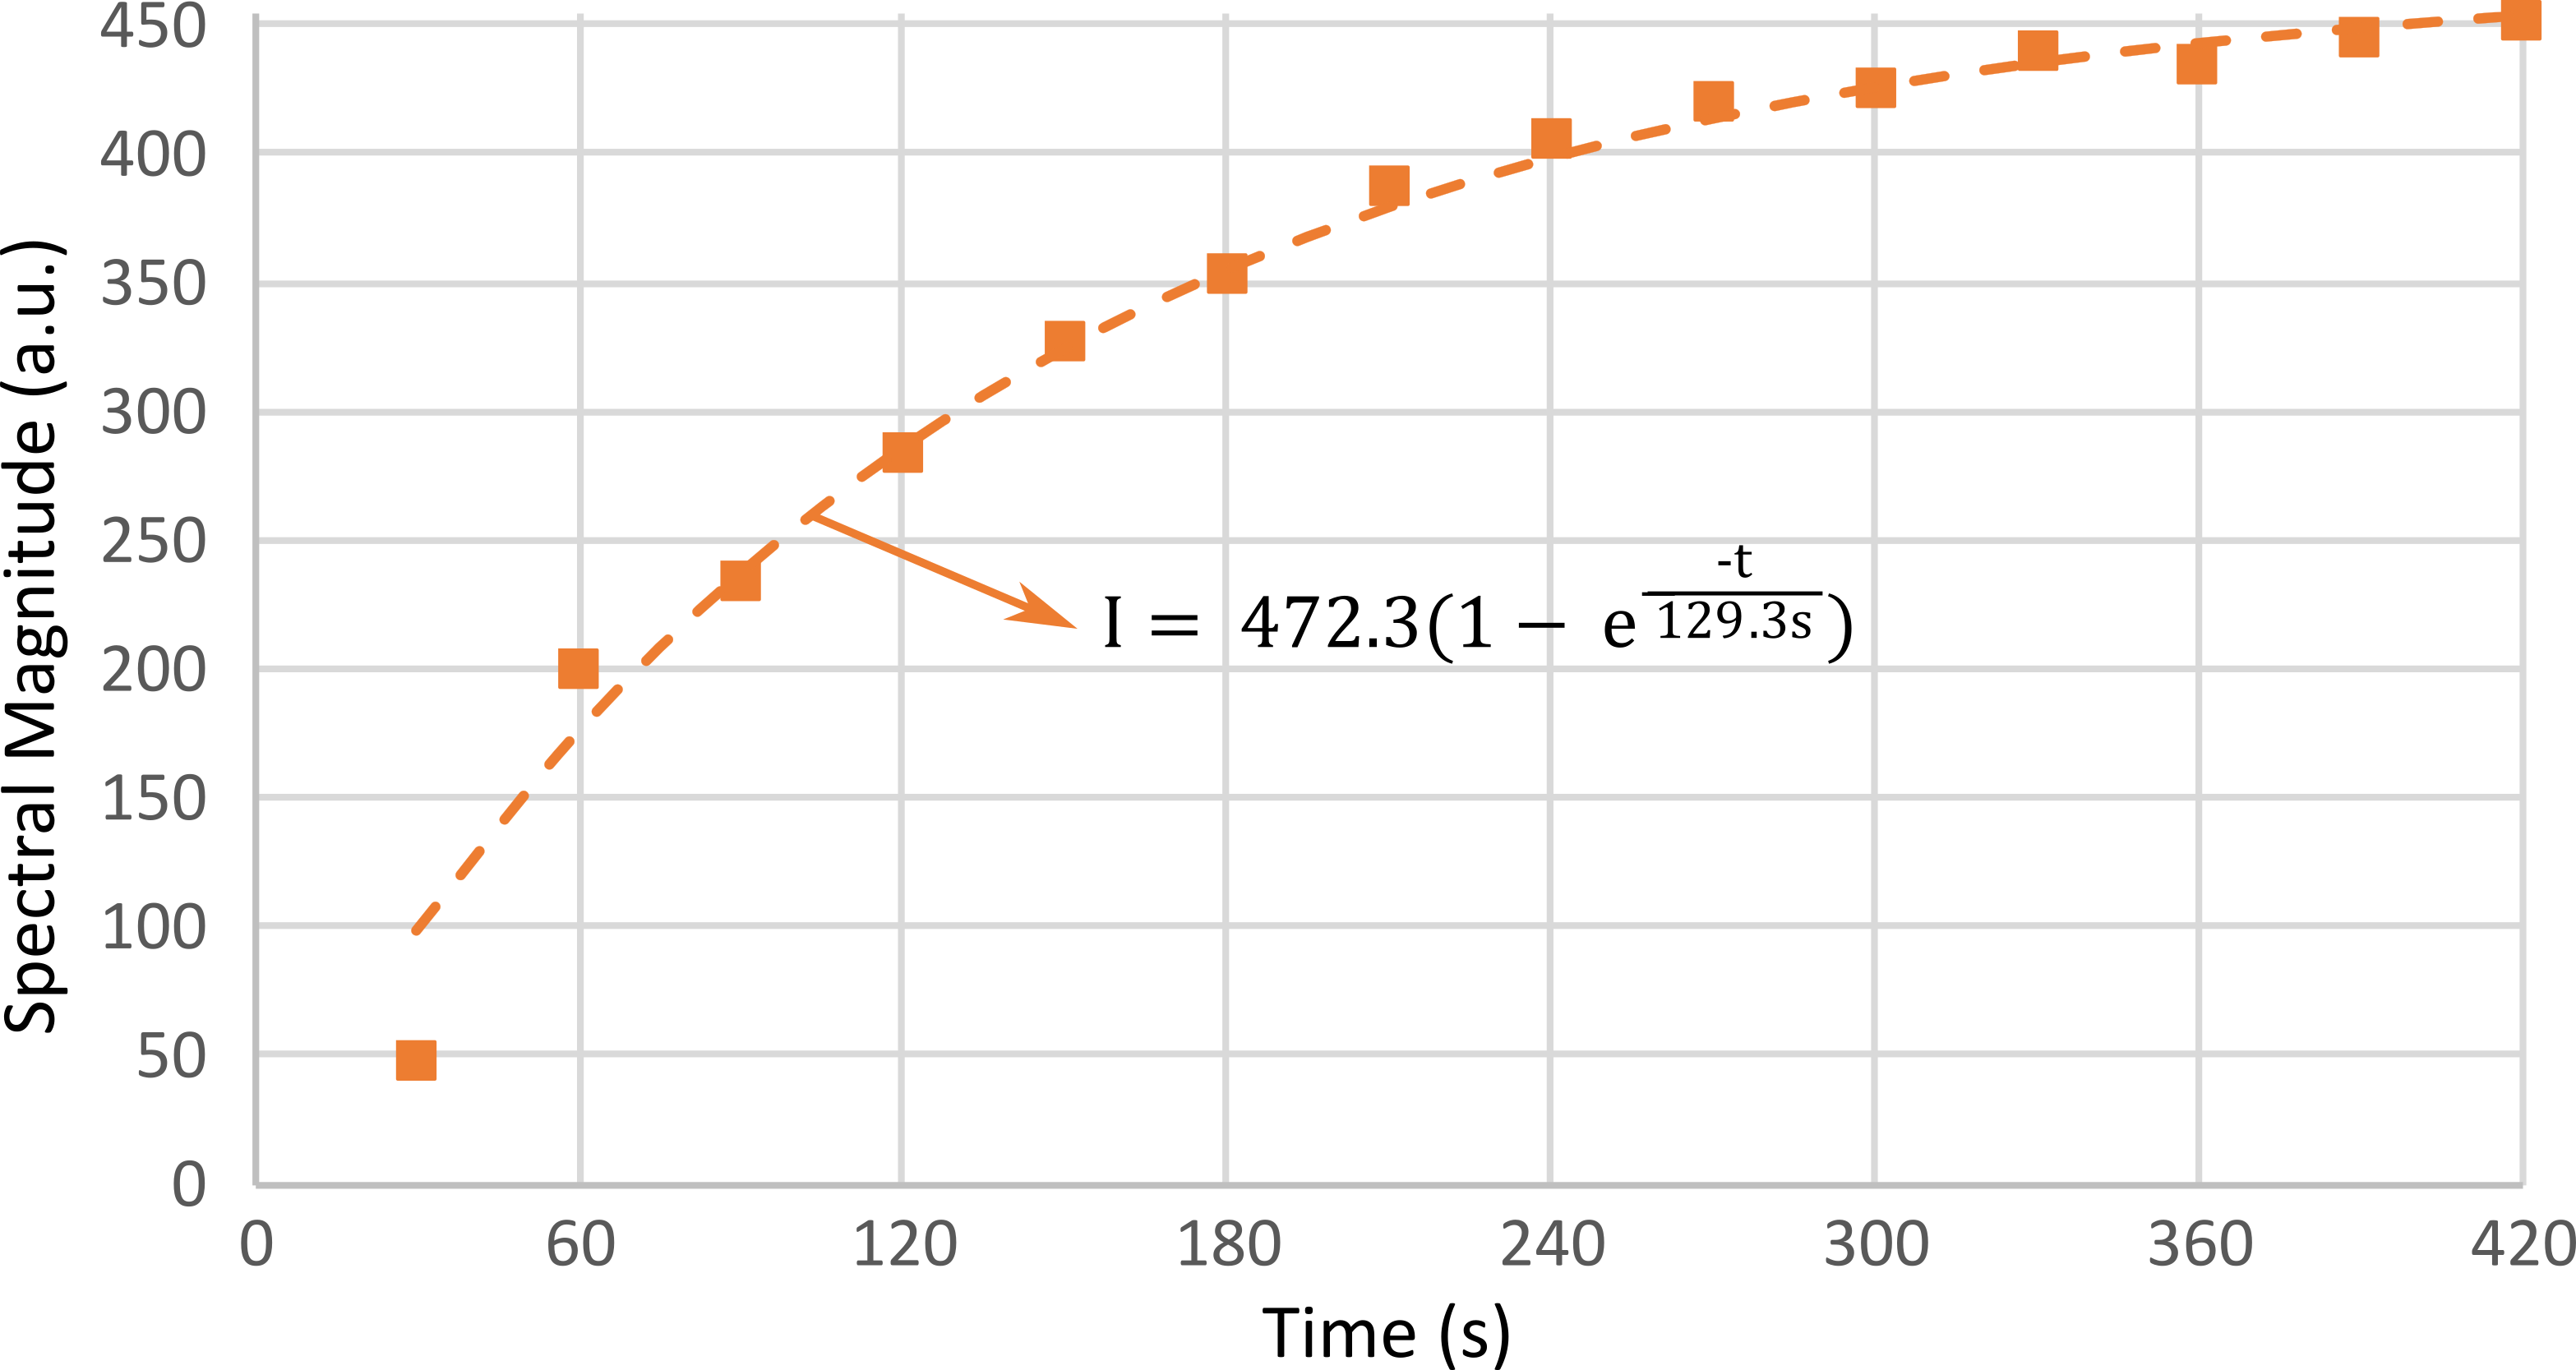
The coil ring-down with application of the Q-switch for short (10 µs) or long (100 µs) time periods are shown in Figure 3. By fitting the coil ring-down, the coil Q was measured as 23.3. A 90 µs longer application of the Q-switch reduced the amplitude of ringing by a factor of 6.5, allowing for more rapid acquisition post-excitation. Measured NMR spectra of 129Xe are shown in Figure 4 for varying transmit RF pulse width, where it was found a pulse width of 0.5 ms resulted in the highest signal (FA ~ 90º). Signal-to-noise (SNR) was shown to be high by comparison to noise-only acquisitions made with the static B0 field switched off. After phasing of the NMR data, the 129Xe in the SEOP cell was measured at 37 ms from the full-width-half-max of the absorption spectrum. In Figure 5, the monitoring of 129Xe polarization increase after the beginning the SEOP process is demonstrated showing that steady state 129Xe polarization is obtained after ~ 420 s in this SEOP cell.Discussion and Conclusion
An NMR spectrometer with a user-friendly interface is demonstrated, providing high SNR that can be used to calculate the nuclear polarization of 129Xe on a SEOP polarizer. Through using inexpensive, off-the-shelf components and custom-written open source (Java) software, a large degree of flexibility the potential for customization is offered by the NMR system. Whilst employed here for in situ polarization monitoring, the system could readily be adapted for off-bench polarimetry, and is directly applicable to other HP nuclei such as 13C and 3He. Future implementations of the system may include parallel multiple transceive coils, optional measurement with the directly sampled or hardware mixed signal to open up the possibility of measurements at higher field strengths and transmit/receive switching utilizing FET switches rather than crossed diode pairs. Direct relation of the FID amplitude to 129Xe polarization level in the SEOP cell will involve comparison with an independently calibrated measurement of polarization.Acknowledgements
Doctoral program funding for Adam Maunder was partially provided by support from GE Healthcare Inc. and scholarships from the Natural Sciences and Engineering Research Council of Canada (NSERC) and University of Sheffield. This work was funded by the National Institute for health research (NIHR), Medical Research Council (MRC) and University of Sheffield Hyperpolarised Imaging Group - POLARIS. The views expressed in this abstract are those of the author and not necessarily those of NHS, NIHR, MRC or the Department of Health.References
1. G. P. Wong, C. H. Tseng, V. R. Pomeroy, R. W. Mair, D. P. Hinton, D. Hoffmann, et al., "A system for low field imaging of laser-polarized noble gas," Journal of Magnetic Resonance, 1999;141:217-227
2. C. H. Tseng, G. P. Wong, V. R. Pomeroy, R. W. Mair, D. P. Hinton, D. Hoffmann, et al., "Low-field MRI of laser polarized noble gas," Phys Rev Lett, 1998;81:3785-3788
3. B. T. Saam and M. S. Conradi, "Low Frequency NMR Polarimeter for Hyperpolarized Gases," Journal of Magnetic Resonance, 1998;134:67-71
4. S. E. Korchak, W. Kilian, and L. Mitschang, "Configuration and Performance of a Mobile 129Xe Polarizer," Applied Magnetic Resonance, 2013;44:65-80
5. R. P. Steven, B. W. Elliot, B. Stephen, and D. F. Christopher, "Digital pulsed NMR spectrometer for nuclear spin-polarized 3He and other hyperpolarized gases," Measurement Science and Technology, 2008;19:045601
Figures