4425
Improved local sensitivity in magnetic resonance spectroscopy at 3 T using a new flexible and compact metasurfaceRita Schmidt1, Assaf Tal2, and Andrew Webb1
1Radiology, Leiden University Medical Center, Leiden, Netherlands, 2Chemical Physics, Weizmann Institute of Science, Rehovot, Israel
Synopsis
Magnetic resonance spectroscopy is a powerful technique for in-vivo measurement of metabolites, however its sensitivity is limited due to very low concentration of the metabolites. This is especially valid for studies of neurotransmitters such as glutamate and GABA. In this study, a new hybrid metasurface comprising of conducting strips and agar-gel was designed to improve MR sensitivity at 3T. The metasurface forms a compact and flexible pad which is placed in the vicinity of the region of interest. The measurements focused on MRS acquisitions including PRESS and MEGA-PRESS, showing an improvement in SNR of a factor of 1.75, 2 cm from the pad.
Introduction
Magnetic resonance spectroscopy is a powerful technique for in-vivo measurement of metabolites, with special interest for functional neurobiology research. However, its sensitivity is limited due to very low concentration of the metabolites, which results in long scan durations. This is especially valid for studies of neurotransmitters such as glutamate and GABA (γ-aminobutyric acid), that require J-coupling editing sequences, which reduce the sensitivity even further1-4. Approaches to improve the SNR include local receive coils5, high permittivity dielectric pads6,7, as well as initial proof-of-principle implementations of metamaterials8-10. In this study, a new hybrid metasurface comprising of conducting strips and agar-gel was designed to improve MR sensitivity at 3T. The metasurface forms a pad which is placed in the vicinity of the region of interest. An optimization study resulted in the design of a compact and flexible pad that can be incorporated inside a multi-element receive head coil. The measurements focused on MRS acquisitions including PRESS and MEGA-PRESS with an interest in GABA detection sensitivity improvement.Methods
3D EM simulations of the B1+ field were performed using FIT (finite integration technique) software (CST Microwave Studio, Darmstadt, Germany). All B1+ maps were normalized to an accepted power of 1 Watt. The first steps in the design included an optimization study of the resonant structures at 128 MHz and of the metasurface dimension and shape. Figure 1a shows the structural geometry of the metasurface with a final dimensions of 13x20x1 cm3 including a 1cm thick dielectric layer. The metasurface conducting strips were implemented using copper strips in a zigzag shape (which allowed the resonant mode to be achieved at 128 MHz within the aforementioned structure dimension) and were attached to a transparent plastic sheet, placed inside the pad. The next step was to perform full EM simulations with a quadrature birdcage coil and human model “Duke” from the Virtual family11. The pad was curved to fit the shape of the head or the phantom. Experimental realization of the dielectric layer used a gel prepared using 0.4% agarose added to demineralized water (relative permittivity of 80), which allowed a flexible pad to be formed. The phantom setups were a Siemens cylindrical phantom (doped with nickel-sulphate to give a short T1) for B1+ measurements and a spherical brain-mimicking phantom for MRS. The Siemens commercial 12-channel head matrix coil was used for receive and the body RF coil for transmission. Phantom images were acquired on a 3T Siemens TIM TRIO scanner. The images included a low flip angle gradient-echo sequence that was used for SNR estimation and B1+ maps were acquired using the AFI12 sequence. Localized 1H spectroscopy used PRESS sequence with TE of 23ms, and TR of 3000 ms, 20x20x20 mm3 voxel, 16 averages and MEGA-PRESS with TE of 68ms, TR of 3000 ms, 20x20x20 mm3, 32 averages, MEGA-editing was achieved with 17-ms editing pulses applied at 1.9 ppm and 7.5 ppm in alternate spectral lines.Results
Figure 1d shows simulations in the human brain comparing setups with and without the metasurface. The results show an enhancement of the local B1+ by approximately a factor-of-three in the vicinity of the pad (the pad was located 5 mm from the head). The simulated maximum local SAR normalized to input power was the same with and without the metasurface, although the SAR spatial distributions were different. Figure 2 shows phantom B1+ simulations and measurements results, with a maximum enhancement of a factor-of-four in B1+ and 3.5 in the SNR (B1-/√P) in the low flip angle gradient echo image. Figure 3 shows experimental results from the MRS acquisition comparing a voxel planned near the metasurface and another at the far-end of the phantom. The voxel was located 2 cm from the metasurface. At this location, both PRESS and MEGA-PRESS showed an enhancement of 1.75 in the SNR near the metasurface.Conclusions
In this study we designed a new flexible and compact metasurface for 3T that can be beneficial for MRS measurements, improving the receive sensitivity as well as the transmit efficiency, thus reducing scan time. Further control and optimization of the SNR enhancement and SAR reduction can be performed by manipulating the dimensions of the dielectric, the length of the copper strips and the distance between the strips. Figure 4 shows that greater enhancement can be achieved in deeper regions of the brain by using two metasurfaces. This work has shown an improvement in SNR of a factor of 1.75 in MRS acquisition of a voxel located 2 cm from the pad. In vivo studies are planned to perform localized GABA measurements.Acknowledgements
We are grateful for receiving the software of the MEGA-PRESS sequence from the CMRR group that was developed by Edward Auerbach and Malgorzata Marjanska and for preparation of the mimicking brain phantom by Osnat Volovyk.References
[1] Puts N.A.J., Edden R.A.E., Prog Nucl Magn Reson Spectrosc, 2012;60:29-41, [2] Mullins P.G. et al. Neuroimage 2014; 86: 43–52. [3] Tremblay S. et al., Clinical Neurophysiology. 2014; 125(7): 1371–1379. [4] Bogner W. et al. Neuroimage 2014; 103: 290–302, [5] Farivar R., et al. Magn. Res. Med. 2016; 76:321–328 [6] Snaar JEM, et al. NMR in Biomedicine, 2011; 24(7): 883-87. [7] Brink WM, et al. Invest. Radiol. 2014; 49(5): 271-277. [8] Freire, M. J., et al. J. Magn. Reson. 2010; 203: 81–90. [9] Algarin JM et al. J. Magn. Reson. 2014; 247: 9-14 [10] Slobozhanyuk, AP. et al. Adv. Mater. 2016; doi: 10.1002/adma.201504270, [11] Christ A., et al., Phys. Med. Biol., 2010: 55, N23–38 [12] Yarnykh V., Magn. Reson. Med. 2007;57:192–200.Figures
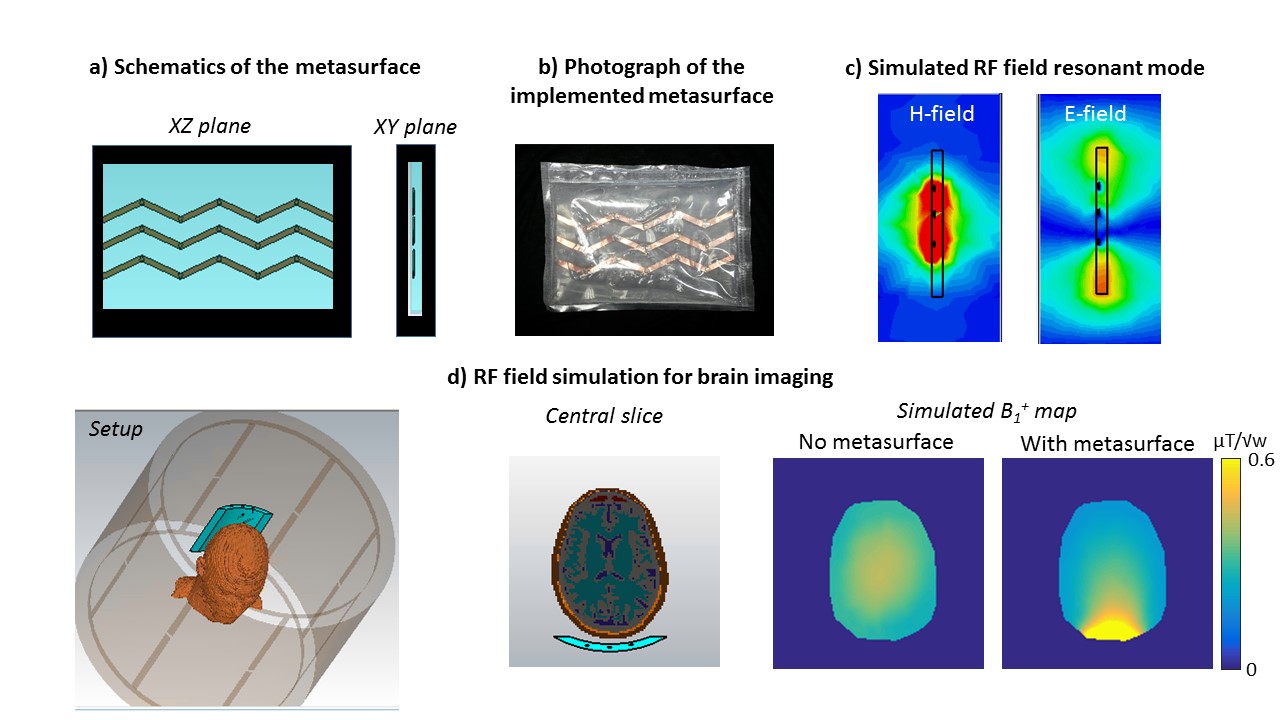
Figure 1: a) Schematic setup of the hybrid
metasurface, including high permittivity dielectric combined with metallic
structure, shown in two orthogonal planes; b) a photograph of the implemented
metasurface pad; c) simulated magnetic and electric field maps in vacuum near
the metasurfaces (shown as a black overlay); d) EM simulations of the full
human model. From left to right: full setup schematic screenshot, a central
axial cross-section of the brain and the B1+ maps in the central slice without and with the metastructure. The pad is shown in blue overlay in the
setup. “Duke” model mesh resolution is 2.5x2.5x2.5 mm3.
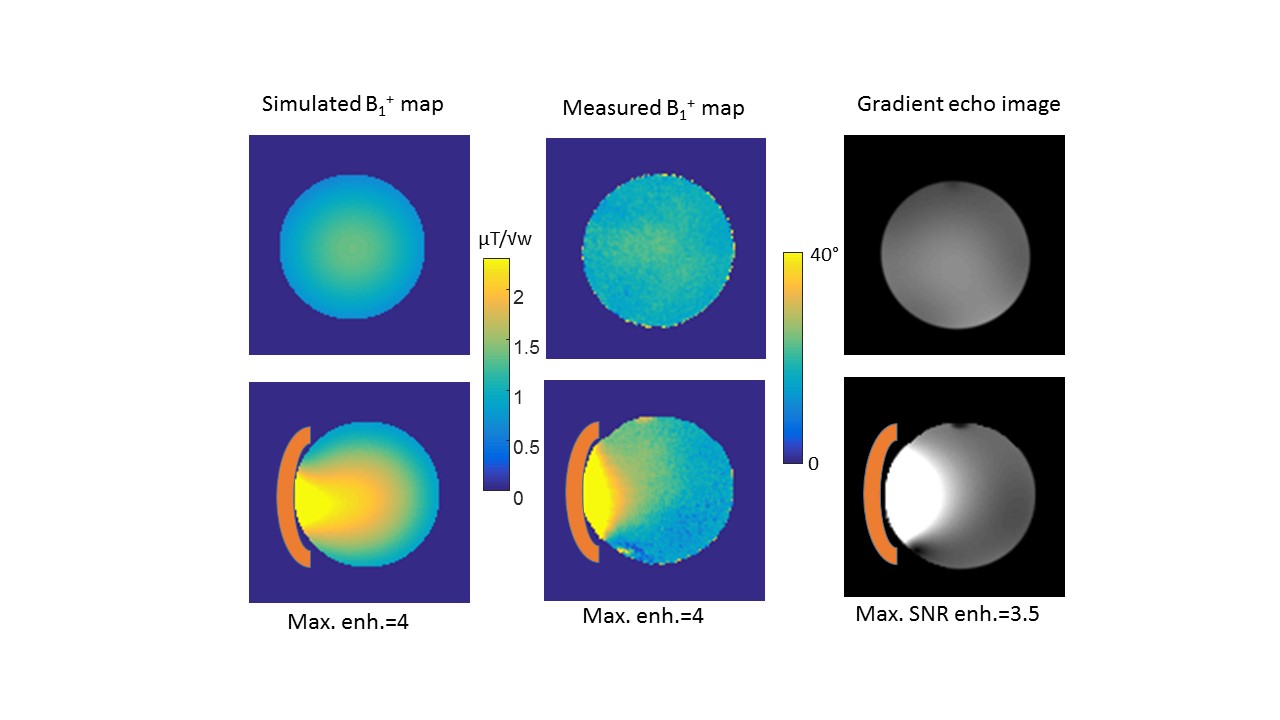
Figure
2: Phantom imaging results – comparison of simulated B1+
maps, measured B1+ maps and low flip angle gradient echo
images. Top – without the metasurface, bottom – with the metasurface. Maximal
enhancement for each case is shown below. Each pair is with the same colorbar. The
phantom setup simulations used a cylindrical phantom with relative permittivity
of 70 and conductivity of 0.4 S/m.
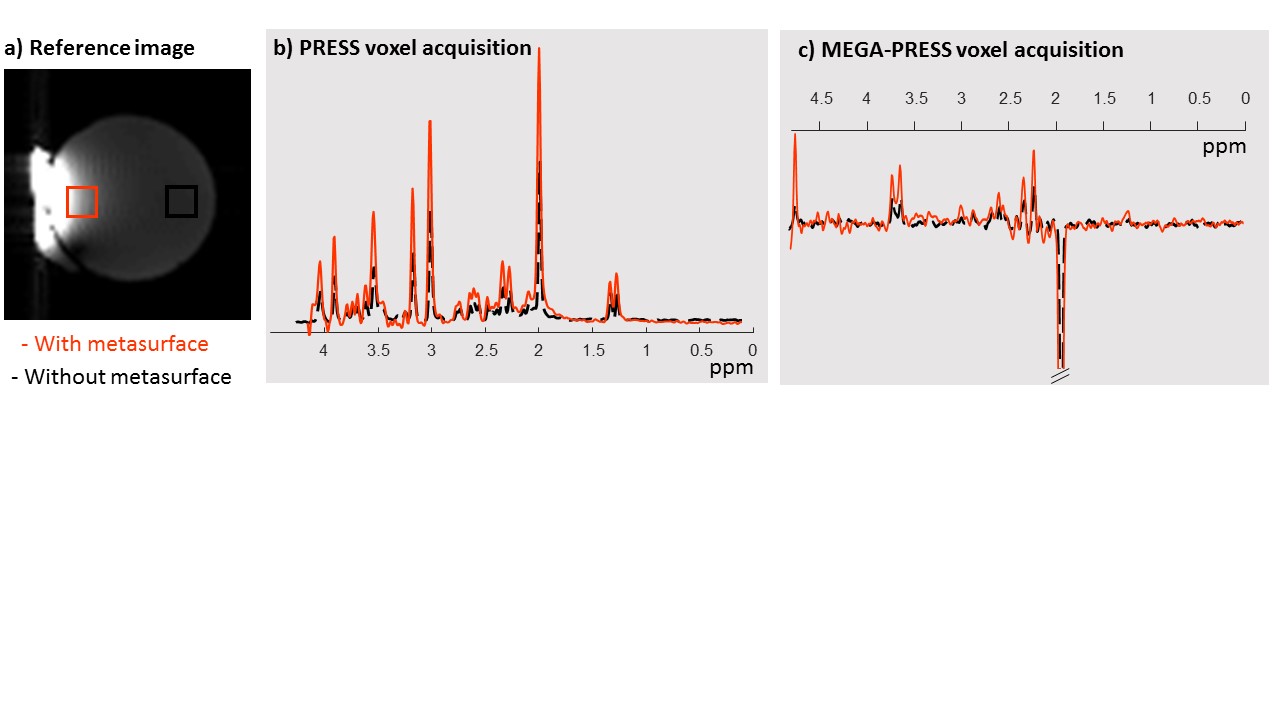
Figure 3: MRS results – a) reference gradient echo image
with the voxels locations (red- located near the metasurface, black- located
far from the metasurface); b) PRESS spectra comparison; c) MEGA-PRESS difference
spectra (the NAA peak is cut). The noise in compared
cases (with and without metasurface) was the same. Zero filling of
factor 2 and Gaussian lineshape apodization
of 2 Hz was used. Mimicking brain phantom metabolites content was 10mM L-Glutamic acid, 10mM
Creatine 8mM myo-Inositol, 2mM GABA, 2mM Choline chloride, 5mM Choline
chloride, 5mM Sodium lactate 12.5mM NAA and 0.5mL Gd for short T1.
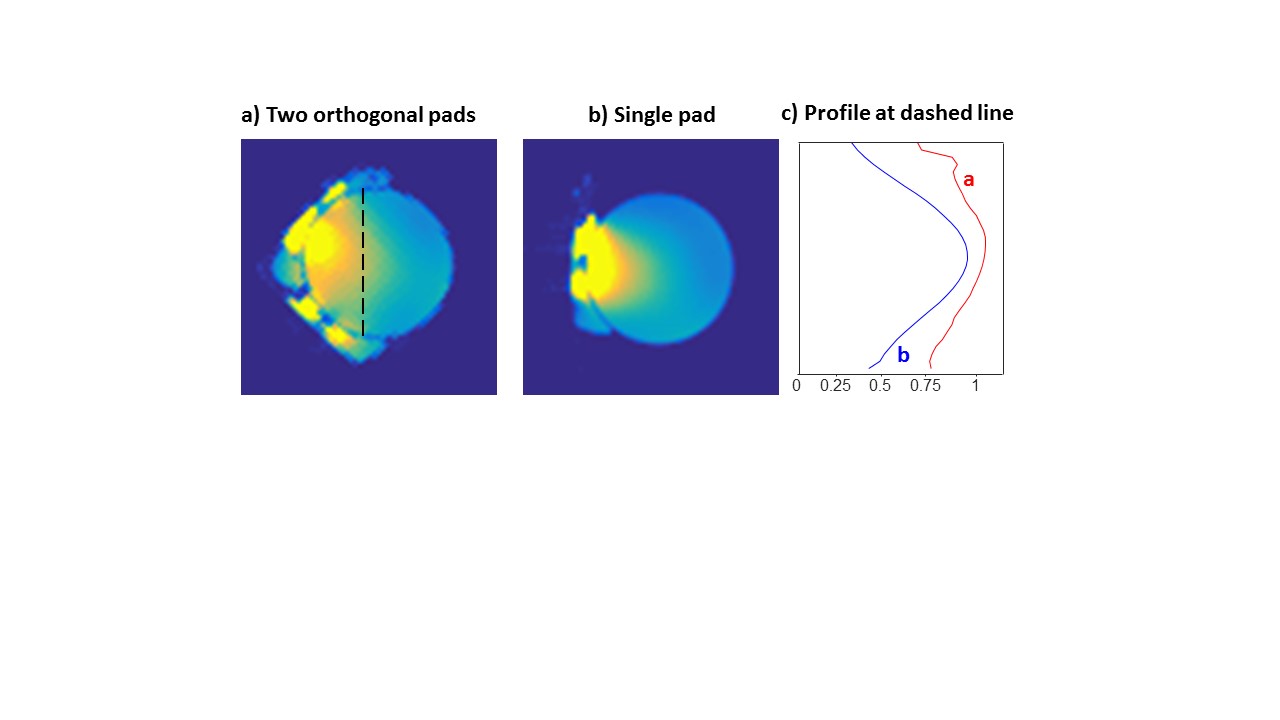
Figure 4: Improving enhancement coverage - two pads versus
single pad comparison – a-b) low flip angle gradient echo images with two pads
(a) and single pad (b), c) intensity profile at the dashed line.