4418
Improvement of Magnetic Field Uniformity of 19F Imaging using the Inductive Coupling at 7.0T1FDA, Silver Spring, MD, United States, 2NIH
Synopsis
Numerical simulations and experimental verification of the feasibility are shown to improve B1 uniformity of a commercial 19F RF coil with addition of a secondary resonator using inductive coupling without changing the RF coil at 7.0T animal MRI. The designed resonator was placed on the opposite side of the imaging object from the 19F surface coil to improve the field uniformity. Numerical simulations and related experiments using a 19F phantom show significant improvement of |B1+| and image uniformity, i.e., about 26%. The mouse leg image of 19F/1H with the designed resonator is shown as an example of potential pre-clinical applications.
INTRODUCTION:
The 19F/1H MR images with perfluorocarbons (PFC) have been used for in-vivo cell tracking to provide valuable information on disease pathogenesis, metastatic processes, cell differentiation and tissue renewal [1]. However, the surface coil used for the detection of 19F frequency has limited radiofrequency (RF) magnetic field (B1) field uniformity, causing a rapid fall-off in image intensity with depth. Previous studies have shown that electromagnetic fields can be manipulated using high dielectric constant material [2] and inductive coupling [3] without changing the RF coil. Here we present a method with numerical simulations and experimental verifications to show that inductive coupling can be used to improve the field uniformity of a 7.0T MR 19F image.METHODS:
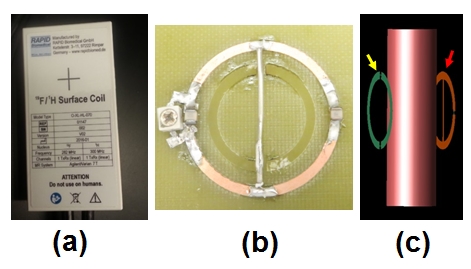
The geometry of 19F/1H surface coil, resonator and phantom are shown in Fig. 1. The surface coil was designed as a double-tuned, one for 19F (282 MHz, one loop coil) and another for 1H (300 MHz, saddle coil). The circular RF resonator located opposite side of the imaging object has a diameter of 30 mm, with a trace width of 4 mm, to match the animal holder, and was tuned to 282 MHz using two capacitor breaks. The 19F surface coil model has ID of 18 mm, and OD of 22 mm. The cylindrical phantom has an ID of 14 mm and length of 50 mm with 0.9% saline solution (σ = 1.7 S/m, εr = 78) and 12 mg/ml of PFC. Approximately 7x10⁵ mesenchymal stem cells (MSCs) were labeled overnight with 4 mg/ml PFC, concentrated into 70 ml of phosphate-buffered saline (PBS), and injected intramuscularly into the mouse leg. Parameters used for the phantom test: Gradient echo, TR/TE = 20/4 ms, Flip angle = 20o, Avg. = 128, Matrix = 64×64, FOV = 64×64 mm2, Thickness = 10 mm, and Scan time = 2 min. 44 sec. Numerical simulations were performed using commercially available software (xFDTD; Remcom, Inc; State College, PA) and post-processing analysis was performed in Matlab (the MathWorks, Inc., Natick, MA). All the simulation results were normalized to have a magnitude of transmit RF rotating magnetic field (|B1+|) of 2 μT at the center of the phantom. An Agilent 7.0T horizontal bore MRI (Agilent Inc.; Santa Clara, California) with ID of 310 mm magnet was used.RESULTS:
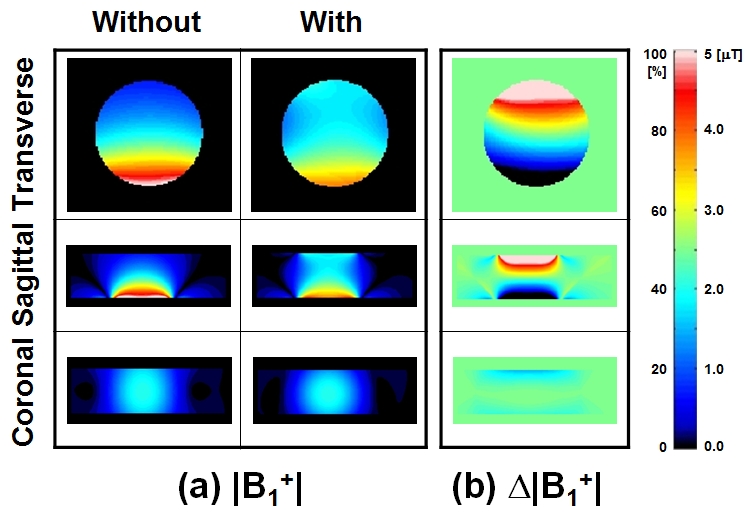
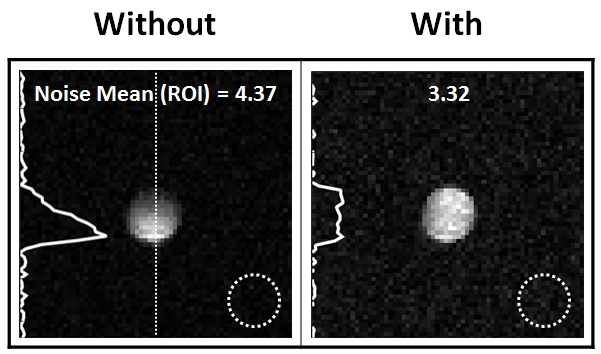
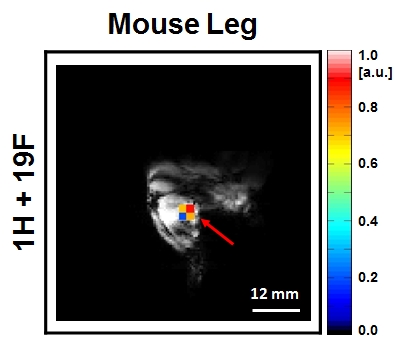
The simulation results of |B1+| and Δ|B1+| without and with the designed resonator at the transverse plane of a center of the RF coil and resonator were shown in Fig. 2. The values of |B1+| without the resonator shows considerable drop off from 5.3 to 0.7 μT, Addition of the resonator significantly improves the homogeneity (1.7 to 3.8 μT) and the corresponding experimental results of 19F images using the cylindrical phantom are shown in Fig. 3 demonstrating the significant improvement in homogeneity and SNR across the entire phantom region. An example of mouse in-vivo 19F image (red) overlaid on the 1H grayscale image with the designed resonator is shown in Fig. 4.DISCUSSION:
With addition of the resonator, the |B1+| at the top region was significantly increased resulting in improved field uniformity about 26 % (standard deviation of |B1+| within the phantom was changed from 34 to 25) while sacrificing some signal decrease at the bottom region (Fig. 2). The experimental verification corresponding to the simulations were shown in Fig. 3. Note that the image uniformity was improved about 30 % as well as the background noise at the region of interest (ROI, white dotted circle) was decreased from 4.37 to 3.32 with the same input RF power. The superimposed image of 19F (color) and 1H (gray) with the designed resonator shows the example of clinical applications (Fig. 4).CONCLUSIONS:
The designed resonator using inductive coupling improves magnetic field uniformity resulting in increased image depth for 7.0T 19F/1H MR, and thus provides valuable additional information.Acknowledgements
Disclaimer: “The mention of commercial products, their sources or their use in connection with material reported herein is not to be construed as either an actual or implied endorsement of such products by the Department of Health and Human Services.”References
1. Ahrens and Bulte, Nature Rev Immunol. 2013; 13(10) 755–763.
2. Foo et al, MRM. 1992: 23, 287–301.
3. Qian et al., MRM. 2016; 75, 2573–2578.
Figures