4416
34 µm Isotropic Resolution MRI of Rat Brain using 55K cryo-probe1Diagnostic and Interventional Imaging, University of Texas, Health Science Center-Houston Medical School, Houston, TX, 2Electrical and Computer Engineering, University of Houston, Houston, TX, United States, 3Texas Center for Superconductivity
Synopsis
We report on the performance and development of a 300-MHz (7 T) cryogenic receive- only surface coil for MRI of rat brain. Practical performance limits of the cryo-coil were tested such as SNR gains at 55 K for a 19 mm in diameter Cu coil and its frequency stability over long (up to a few days) scans. 3D-RARE isotropic images of ex-vivo rat brain up to 512 slices with outstanding isotropic resolution of 34 μm were acquired showing structural details not seen with conventional small animals coils. In addition, a comparison of such images with matching histological plates is discussed.
Purpose
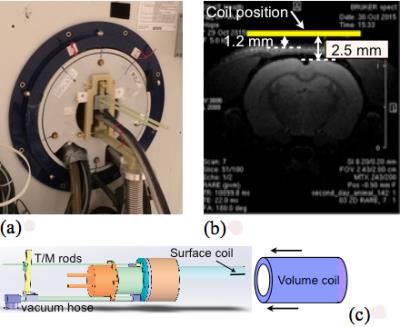
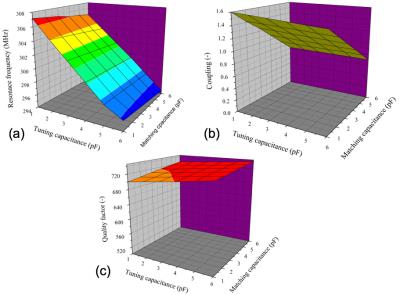
In MRI, a true 3D isotropic imaging at very high resolution is a significant challenge mainly due to intrinsically low SNR [1]. Recent developments in cryo-coils technology, however, can serve to advance this goal. Such technology demonstrated that in pre-clinical high-field MRI for the cases when the thermal noise of the system is coil noise dominated a significant SNR gain could be achieved [2, 3]. Here we demonstrate the performance of a 1H receiver coil for 7T scanners [4-6] by introducing lower-loss circuitry, stabilizing the operating frequency at cryogenic temperatures for very long scans and shortening the coil-body distance (Fig.1). We also improved user-friendly handling process of the coil so that the time from start of the cryo-cooler to actual scanning is less than an hour. In this work our objective was to explore the practical isotropic resolution limits for the rat brain using very high SNR cryo-coil (up to 45,000/mm3).Method and Results
The 19mm cryo-coil SNR and
SNR gain from cooling were measured and calculated with the macro Auto_snr,
which is a part of the Bruker scanner software. Twofold SNR-gain was
obtained. A spin echo sequence, applied to the coil loaded with a water
phantom doped with CuSO4 was selected as a control sequence. The
mean signal and the noise were measured in a region of interest (ROI) of 3 by 3
voxels around the brightest voxels and at the edges and corners of the image,
respectively. In order to account for the effect of acquisition parameters such
as slice thickness, bandwidth, and number of averages, the used Auto-snr
routine calculates the SNR per unit volume as: SNR=mm3 x SNR x acqfactor x
voxel factor. Here voxel factor = 1/V, and acqfactor = 1/(256x5.12 (acqsize x
acqtime)), whereas V volume is in mm3,
acqtime and acqsize are the sampling time in the frequency encoding direction
and the number of phase encoding steps, respectively [7]. This method yields SNR that is independent of the acquisition
parameters, allows avoiding any possible operator bias and allows for
comparison across different scanners and with different acquisition parameters.
The rat brain used in this study was fixed and stored in
formaldehyde solution. It was transferred to a 15ml tube filled
with perfluorinated polyether (“Fomblin”) and placed directly under the
cryo-coil. After tuning, matching, and shimming a 3D-RARE sequence was used to
acquire images with an isotropic resolution of either 50µm (Fig.3) or 34µm (Figs.4
and 5). The “Field-of-View” was 13.0x9.4x17.2mm3 with an acquisition
matrix 380x280x512. This relatively large volume was chosen to maximize the SNR
for the 3D-acquisition. The TR was 500ms, the effective TE was 28.7ms and the
RARE-factor was 4. First we have compared images acquired at room temperature
(RT) using state-of-the art Cu coil. In Fig.3 a comparison of RT and low
temperature cryo-coil, LT, images are shown. Acquisition time was 7 hours for
10 averages (160 slices). As can be seen the RT images do not provide the
quality of the LT images (SNR gain 2x) even after 10 averages. When the number
of slices was increased to 512 the total acquisition time was close to 60
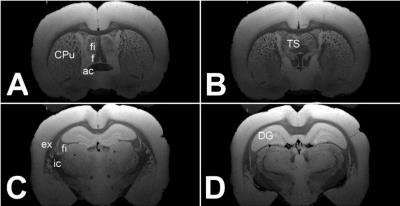
hours. Fig.4 shows images that clearly exhibit several resolved fine brain
structures (i.e. fibers), which appear as a homogenous gray area
at conventional resolution. The fine structures in the Caudate Putamen (CPu)
or hippocampal fimbria (fi) and the horizontal fibers around the triangular
septal nucleus (TS) cannot be seen at lower resolutions. Also the area between
the external capsule, fimbria, and the internal capsule exhibits here many
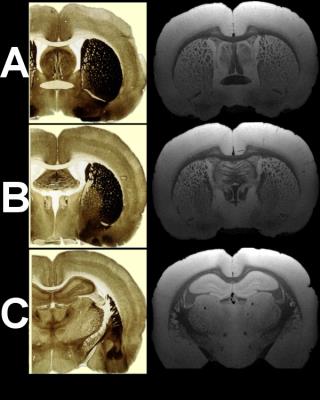
fibers usually not seen in MRI. Figure 5 displays in the right column the
sections A, B, C from Fig.4, but this time labels have been removed to ease the
comparison with matching histological plates from the Paxinos and Watson-Atlas
[8] (left column).
Discussion and Conclusions
In this study a twofold SNR gain reached with a 19mm Cu coil for ex-vivo scans was used to obtain very high resolution images (Fig.4 and 5). The optimal size for gaining a twofold increase of SNR ranges between 18-20mm for copper coils and around 17mm for superconducting coils. The high resolution images obtained here show structures which till now only could be seen in histological sections, but not in MRIs acquired with conventional small animal coils. The contrast quality is sufficient to supplement histological sections, especially if beside the histochemistry also the architecture of brain structures regarding distortions or displacements (i.e. after TBI) is of interest. Allowing for compromises regarding the graininess shorter acquisition times than used by us could be possible.Acknowledgements
No acknowledgement found.References
[1] H. Greenspan, "Super-Resolution in Medical Imaging," The Computer Journal, vol. 52, pp. 43-63, 2008.
[2] L. Darrasse and J. C. Ginefri, "Perspectives with cryogenic RF probes in biomedical MRI," Biochimie, vol. 85, pp. 915-37, Sep 2003.
[3] N. Khare, S. A. Belomestnykh, H. S. Padamsee, A. Brazdeikis, J. Wosik, and J. R. Claycomb, "Superconductive Passive Devices," pp. 723-806, 2015.
[4] J. Wosik, K. H. Bockhorst, I.-C. Tan, K. Qin, K. Nesteruk, and P. A. Narayana, "Performance and Design of 7 Tesla MRI Cryo-probe with Normal Metal and/or Superconducting Coil for Rat," in Proc. Intl. Soc. Mag. Reson. Med. 2016, Singapore, 2016, p. 3505.
[5] K. R. Kamel, L. M. Xie, L. Xue, J. Wosik, K. Nesteruk, K. Bockhorst, et al., "Very High SNR Superconducting Receive-only 7 Tesla Coil for Rat Brain Imaging," Proc. Intl. Soc. Mag. Reson. Med., vol. 15, p. 327, 2007.
[6] C. Wang and P. E. Gifford, "A Single-Stage Pulse Tube Cryocooler for Horizontally Cooling HTS MRI Probe," in AIP Conf. Proc, 2004, p. 1805.
[7] P. A. Narayana, J. J. Herrera, K. H. Bockhorst, E. Esparza-Coss, Y. Xia, J. L. Steinberg, et al., "Chronic cocaine administration causes extensive white matter damage in brain: diffusion tensor imaging and immunohistochemistry studies," Psychiatry Res, vol. 221, pp. 220-30, Mar 30 2014.
[8] G. Paxinos and P. Watson, The Rat Brain in Stereotaxic Coordinates: 6th Edition, Academic Press, 2006.
Figures


