4410
Human brain tissue equivalent MRI phantom for well defined T1 and T2 times at 3 and 7 Tesla1Division MR Physics, Center for Medical Physics and Biomedical Engineering, Medical University of Vienna, Vienna, Austria
Synopsis
Tissue-equivalent phantoms with well-defined T1- and T2-relaxation behaviour are often required for sequence optimisation and quality control purposes. Based on numerous T1 and T2 measurements at 3T and 7T with varying concentrations of Agarose and gadopentetate dimeglumine (Magnevist), we herein present a formula for creating phantoms with T1-values between 700 ms and 3000 ms and T2-values between 30 ms to 250 ms at both field strengths.
Introduction
Test objects are an important prerequisite for coil development, sequence optimisation and quality control procedures. In addition, the interest in quantitative MRI has greatly increased over the last years with new developments in multi-parametric mapping (MPM1) and magnetic resonance fingerprinting (MRF2) techniques. Although some literature exists for test objects at 3 Tesla3 and lower4, there is a surprising lack of literature for mixing tissue-equivalent phantoms with well-defined relaxation behaviour at 7T. Thus, the purpose of this study was to assess T1 and T2 relaxation in phantoms over a wide range of relaxation times at 3T and 7T in order to establish a recipe for creating human brain tissue equivalent test objects at these field strengths with T1- and T2-values as desired.Methods
Twenty phantoms were created in test vials, each consisting of different concentrations of Agarose (Sigma-Aldrich) (0.5-4 %) and gadopentetate dimeglumine (Gd-DTPA, Magnevist; Bayer) (0-200 µmol/kg) distributed on an irregular grid. The combinations were chosen as to improve the density of the samples in regions relevant for grey and white matter at 7T. Additionally, 0.1% of NaCl5 was added for conductivity adjustments (target of 0.55 S/m, equivalent to brain tissue at 7T6) and 0.05% of NaN3 for the prevention of bacterial growth.
T1 and T2 relaxation times were measured at 3T (Prisma Fit, Siemens) and 7T (Magnetom 7T, Siemens) using a 20 and 32 channel head coil, respectively. Each measurement contained five samples in a saline solution with a DC conductivity of 0.39 S/m. T2 was measured using a multi spin-echo (MSE) sequence with 32 contrasts (Siemens, se_mc, TR/TE = 8s/14ms, 0.5x0.5x5 mm³, 256x256x1 px³). T1 was measured using an inversion recovery turbo spin echo (IR-TSE) sequence with a delay time of 6 s (Siemens, TI 50/100/200/400/800/1000/1500/2000/2500/3000/3500 ms, Turbo Factor 20, 0.3x0.3x5 mm³; 3T: tir, TE 15ms, 448x448x1 px³; 7T: tse_uhf, TE 14ms, 432x432x1 px³). Additionally, a turbo flash based flip angle (FA) map was acquired. Data analysis was performed using Matlab (Mathworks).
A mono-exponential function was non-linearly fitted to the MSE data and the general equation for T1 relaxation for imperfect pulses7 to the IR-TSE data for the evaluation of T2 and T1 respectively. The mean value in each ROI representing a vial was used as the relaxation time at the corresponding Gd-DTPA and Agarose concentrations. For T2, only voxels with an error in FA less than 10% were used in each ROI.
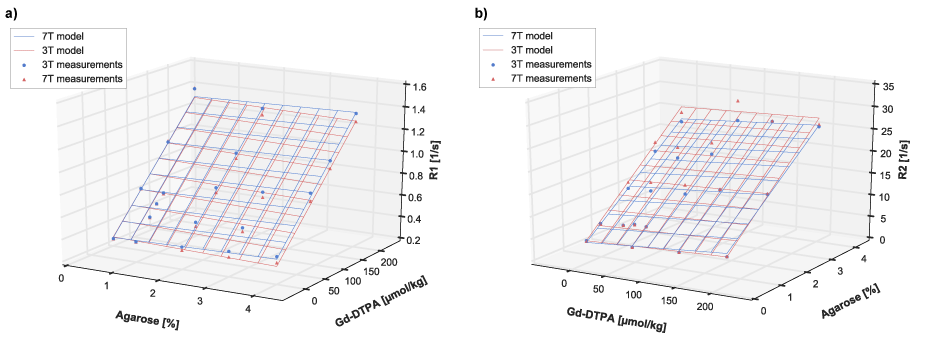
Finally, similar to Hattori et al.3, a linear model was fitted to the relaxation rates R1 and R2 using linear least squares:
$$\frac{1}{T_x}=a_1Gd + a_2A + (a_3 + a_4Gd + a_5A)B + a_6$$
where Gd and A represent the concentration of Gd-DTPA and Agarose respectively and B the B0 field strength in tesla and Tx either T1 or T2.
Results
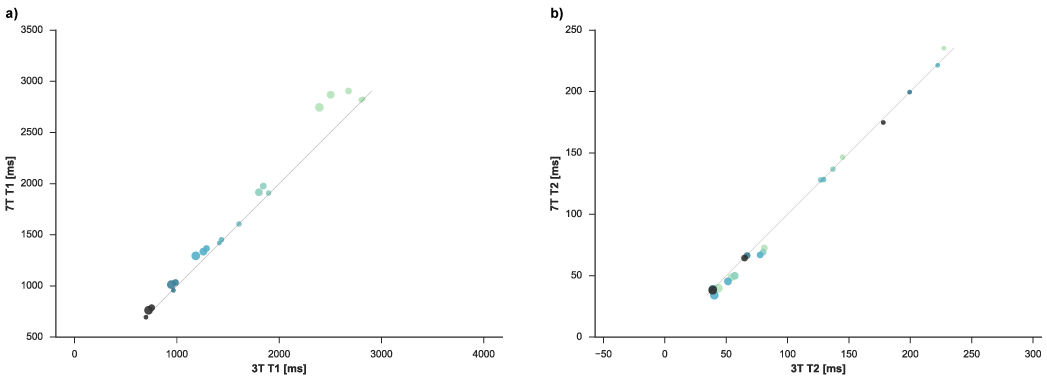
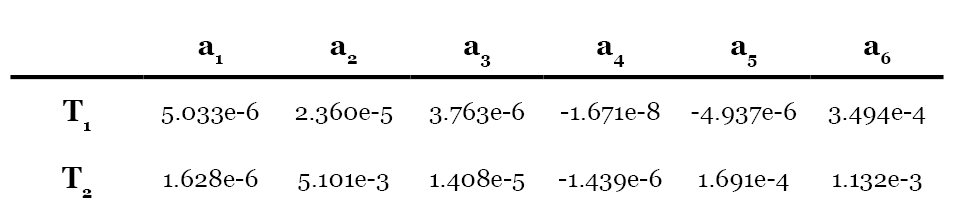
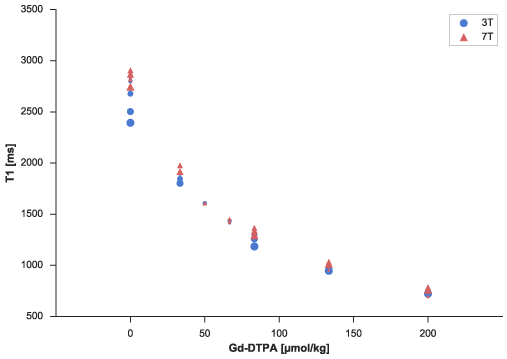
T1-values ranged from 698-2820ms at 3T and 694-2906ms at 7T, T2 values ranged from 39-227ms at 3T and 34-235ms at 7T. The fitted data are in high accordance with the model (mean relative error of 2.48% and 4.07% for T1 and T2 respectively) and showed a minimal dependency on the field strength (see Figure 1 and 2). T1 was mainly influenced by the Gd-DTPA concentration, whereas T2 was mainly influenced by the Agarose concentration. The fitted model parameters can be seen in Figure 3. Closer examination of the field strength dependency showed that T1 was higher at 7T especially for low Gd-DTPA concentrations (Figure 4).Discussion
In contrast to previous studies at lower field strengths3,4, our choice of Gd-DTPA as T1-modifier was able to significantly reduce the field dependency of the phantoms, while at the same time creating a very simple model for human brain tissue equivalent phantoms. The low field dependence of the longitudinal relaxation of Gd-DTPA for Larmor frequencies above 100 MHz8 might be able to explain the low field dependence in the phantoms and makes it possible to use essentially the same phantoms at both field strengths.
The good fit of the data to the simple model has its merits, as it is easily invertible by the usage of linear algebra for the calculation of Gd-DTPA and Agarose concentrations for given T1 and T2 times.
Conclusion
We have created a recipe with a low field strength dependency for the creation of human brain tissue equivalent phantoms at 3T and 7T. Due to low field strength dependency, it can be even expected to be valid at field strengths above 7T. This recipe can be used to enhance future studies on quantitative MR imaging at high field strengths.Acknowledgements
The authors would like to thank Andreas Berg for his helpful insights regarding the acquisition of the data and Vladimir Mlynarik for his insights into their interpretation.References
1. Weiskopf N, Suckling J, Williams G, et al. Quantitative multi-parameter mapping of R1, PD*, MT, and R2* at 3T: a multi-center validation. Frontiers in Neuroscience. 2013;7:95.
2. Ma D, Gulani V, Seiberlich N, et al. Magnetic resonance fingerprinting. Nature;495:187-192.
3. Hattori K, Ikemoto Y, Takao W, et al. Development of MRI phantom equivalent to human tissues for 3.0 T MRI. Medical Physics. 2013;40(3):032303.
4. Kato H, Kuroda M, Yoshimura K, et al. Composition of MRI phantom equivalent to human tissues. Medical Physics. 2005;32(10):3199-3208.
5. Wald L. Wald group anthropomorphic phantom builder's Wiki. Martinos Center. July 8, 2016. https://phantoms.martinos.org/Main_Page. Accessed November 8, 2016.
6. Gabriel S, Lau RW, Gabriel C: The dielectric properties of biological tissues: II. Measurements in the frequency range 10 Hz to 20 GHz. Physics in Medicine and Biology. 1996;41(11):2251-2269.
7. Kingsley PB. Signal Intensities and T1 Calculations in Multiple-Echo Sequences with Imperfect Pulses. Concepts in Magnetic Resonance. 1999;11(1):29-49.
8. Laurent S, Vander Elst L, Houzé S, et al. Synthesis and Characterization of Various Benzyl Diethylenetriaminepentaacetic Acids (dtpa) and Their Paramagnetic Complexes, Potential Contrast Agents for Magnetic Resonance Imaging. Helvetica Chimica Acta. 2000;83(2):394-406.
Figures