4402
Quantitative MRI of extra-ocular muscles in the clinical evaluation of systemic diseases1Ophthalmology, LUMC, Leiden, Netherlands, 2Radiology, CJ Gorter center for high field MRI, LUMC, Leiden, Netherlands, 3Neurology, LUMC, Leiden, Netherlands
Synopsis
Current diagnostic tools fail to accurately assess the condition of the eye muscles and orbital fat in ocular diseases. We have developed a high-resolution 7 Tesla quantitative MRI-protocol of the eye and evaluated its clinical value for Graves' orbitopathy and myasthenia gravis. The scan protocol proved to be robust against eye-motion and extra-ocular muscles were easily segmented from the orbital fat. Patient data showed elevated muscle fat fractions for both conditions compared to healthy subjects. Since the method quantifies the condition of the tissues, which otherwise can only be assess via an invasive biopsy, it potentially is an efficient technique to assess treatment response.
Purpose
To develop and assess the clinical value of quantitative ocular MRI-techniques for patients with systemic diseases.Background
Most imaging techniques within ophthalmology concentrate on the visualisation of the bulbus of the eye, but do not image the remaining part of the orbita.
Quantitative MRI could be extremely useful for this purpose, however, the sensitivity of MRI to eye motion prevented its regular use in ophthalmology. In the last years, new MRI-methods, such as cued-blinking paradigms, have effectively solved these problems, opening new clinical possibilities.1,2
In Graves' orbitopathy, for example, the extra-ocular muscles and orbital fat are inflamed, causing double vision and proptosis. In myasthenia gravis, patients can suffer from the inability to move the eyes, caused by dysfunction of the extra-ocular muscles. Quantitative information on the integrity of the muscles, such as the presence of muscle inflammation or fatty infiltration, would facilitate a more targeted treatment selection and a more direct method to determine the treatment response, which varies greatly between patients.
Pitcheathly et al.3 used quantitative MRI to show a prolonged T2 in extra-ocular muscles of patients with mitochondrial disease. Their protocol did not, however, distinguish between inflammation and increased fat content, both of which lead to a prolonged T2.4 In this study we evaluate the clinical value of the DIXON-technique, which enables a reliable determination of the water/fat ratio.5 We furthermore incorporated the cued-blinking paradigm for these scans, to improve the image quality and quantification.
Methods and materials
All scans were performed on a 7Tesla MRI (Philips Achieva), using the cued-blinking paradigm.6 Images were acquired with the upper 16 elements of a 32-channel head-coil (Nova Medical). A 3D FLAIR (resolution:0.5x0.5x1.0mm3, TR/TE/Flip-angle/TI:2.9/5.6/7º/1280ms, time:3:17min), which suppresses the signal from the vitreous body, was used as a general anatomical reference for subsequent scans. The DIXON scan was acquired with: 0.7x0.7x1.0mm3 resolution, TR/TE/Flip-angle:2.4ms/10ms/3º and time: 2:51min.
5 healthy subjects (22-49 years, 2M, 3F), 1 myasthenia (68 years, F) and 1 Graves orbitopathy (32 years, M) patient were scanned, after obtaining informed consent. The muscles, optic nerve and orbital fat were manually segmented on the water and fat images of the DIXON by a single observer, using the Medical Image Processing, Analysis and Visualization (MIPAV) software, on the first coronal slice posterior to the globe (Figure 2).3 The mean water and fat signal intensity and surface area were determined for all ROIs.
Results
The scan protocol proved to be robust against eye motion for all participants. Extra-ocular muscles were easily segmented from the orbital fat for all healthy subjects, figure 1, except for the separation between the levator palpebrae and rectus superior in the two patients. The cross sectional area of the different muscles was similar for all healthy subjects and patients, figure 2. The cross-sectional area of the orbital fat was, however, almost twice as high for both patients compared to the healthy subjects. For the healthy subjects, the different muscles show a similar fat fraction of 11% (SD 3%), while it was higher for both patients (26% and 23%), figure 3.Discussion
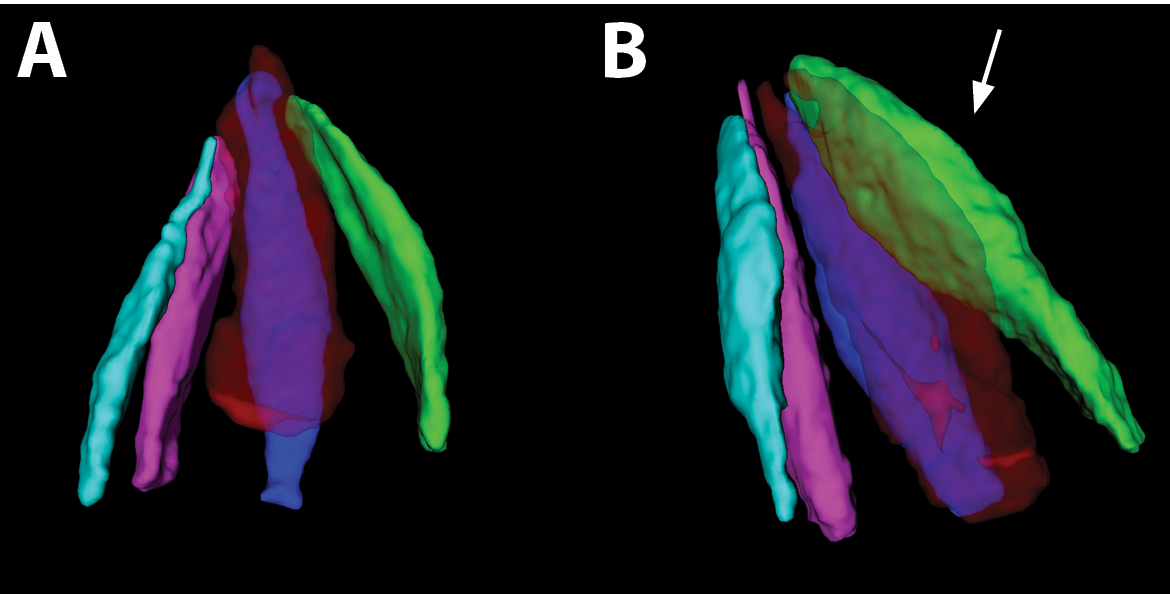
The high-field strength, combined with the cued-blinking paradigm, enables sufficient resolution and image quality to separate the individual muscles, which have a cross-section of only a few mm. These pilot data were based on the evaluation of one standard slice, but volumetric data can be obtained and enable an evaluation of the complete muscles, figure 4. This is a significant advantage over the single slice evaluation used by others3, as the site of local thickening in the muscle can vary substantially (see Graves' patient in figure 1).
Although only a small number of patients have been included so far, the Dixon data already are highly promising in terms of clinical relevance. The high fat content of the ocular muscles of the myasthenia patient was an unexpected finding and warrants further study. The high water content of the orbital fat in the Graves' patient confirms the presence of inflammation. For both patients, these quantitative measures could provide a new and useful diagnostic tool, and the potential to assess the treatment response. This can otherwise only be obtained by taking a biopsy, which is generally avoided because of its invasiveness, or by indirect measures, such as the Clinical Activity Score. The MRI scan furthermore provides data on the individual muscles, whereas these methods only provide a general measure.
Conclusion
Quantitative MRI can provide key clinical information on the status of the extra-ocular muscles and orbita for patients with systemic diseases, such as Graves orbitopathy or autoimmune myasthenia gravis, which are not available with the conventional diagnostic techniques.Acknowledgements
No acknowledgement found.References
1. Beenakker JWM, Ferreira TA, Soemarwoto KP, et al. Clinical evaluation of ultra-high-field MRI for three-dimensional visualisation of tumour size in uveal melanoma patients, with direct relevance to treatment planning. MAGMA 2016 (3):571-577.
2. Beenakker JWM, Shamonin DP, Webb AG, et al. Automated retinal topographic maps measured with magnetic resonance imaging. Invest Ophthalmol Vis Sci. 2015 56:1033-1039.
3. Pitceathly RDS, Morrow JM, Sinclair CDJ et al. Extra-ocular muscle MRI in genetically defined mitochondrial disease. Eur Radiol. 2016 (26):130-137.
4. Carlier PG. Global T2 versus water T2 in NMR imaging of fatty infiltrated muscles: different methodology, different information and different implications. Neuromuscul Disord 2014 (24):390–392.
5. Wokke BH, Bos C, Reijnierse M. Comparison of Dixon and T1-weighted MR methods to assess the degree of fat infiltration in Duchenne muscular dystrophy patients, J. Magn Reson Imaging. 2013 (38): 616-624.
6. Beenakker JWM, Rijn van GA, Luyten GPM et al. High-resolution MRI of uveal melanoma using a microcoil phased array at 7 T. NMR Biomed. 2013 (12):1864-1869.
Figures
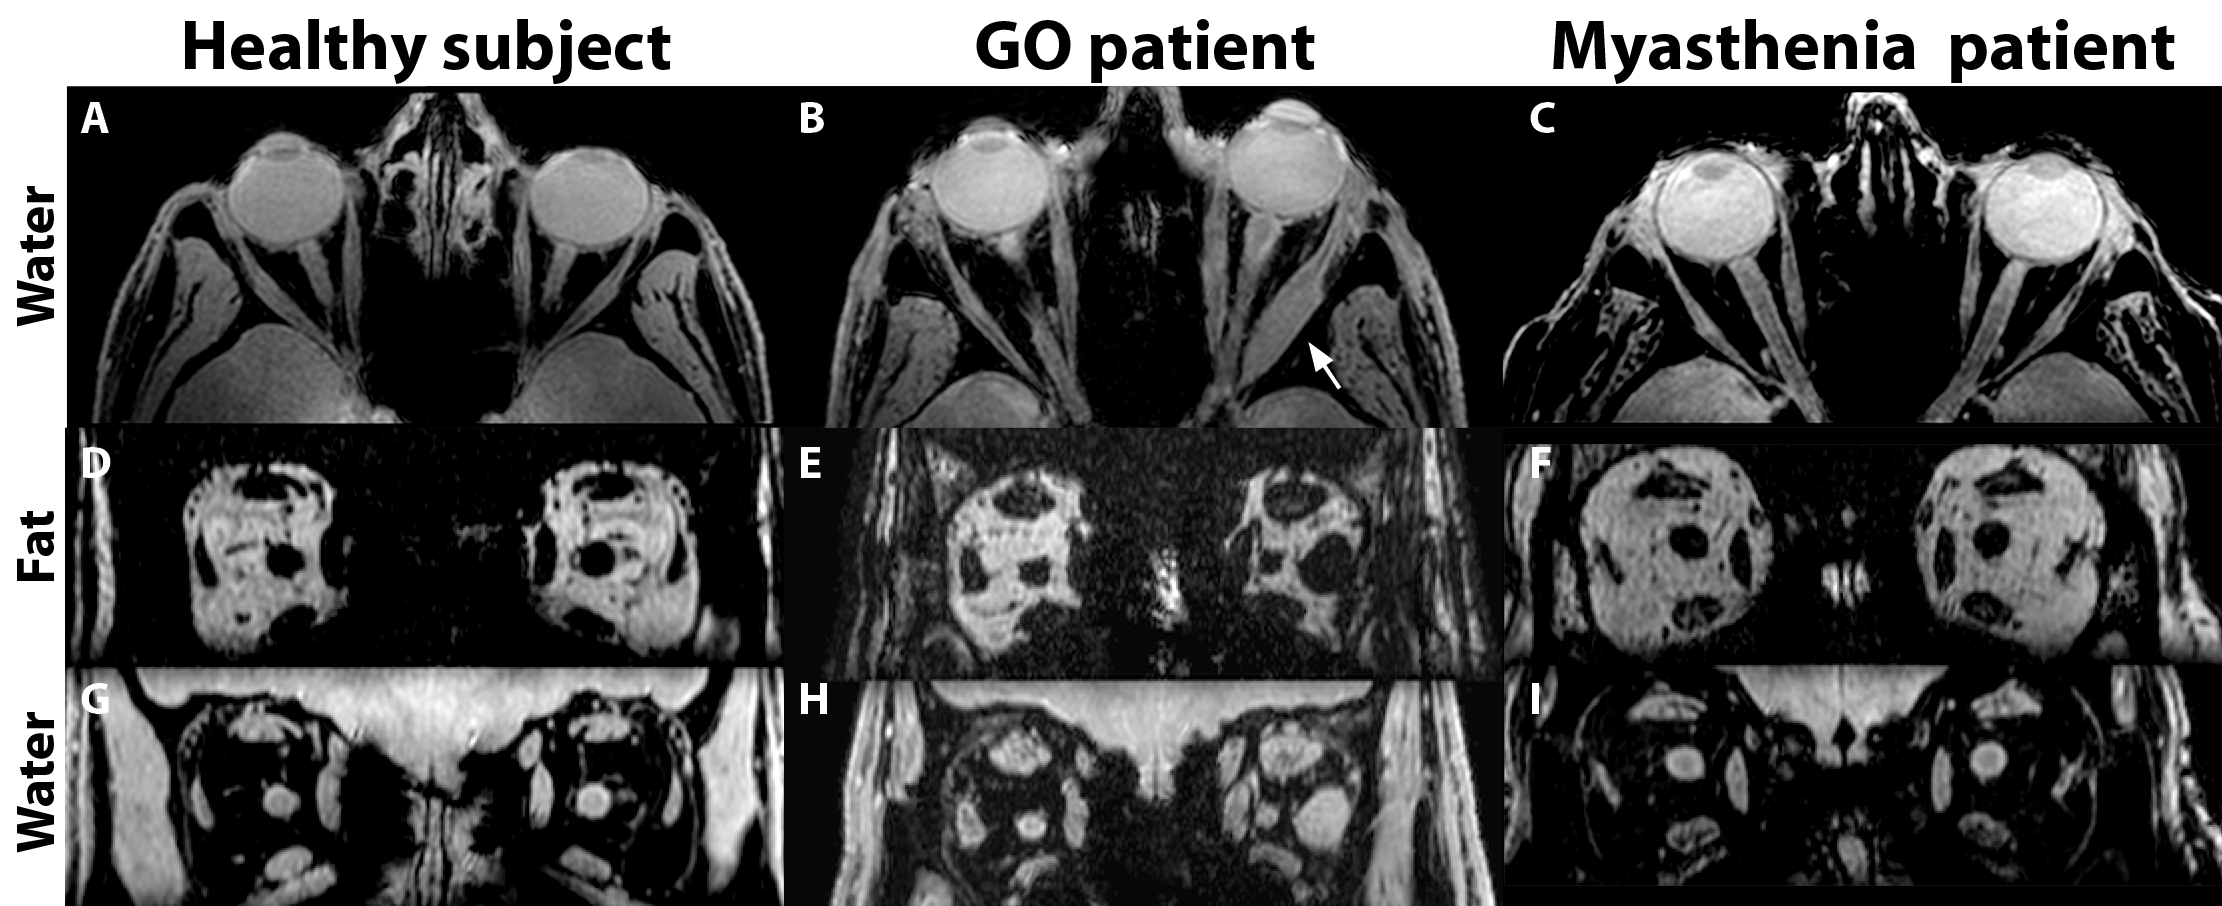
Figure 1: (ABC) transverse slices of the water image of the 3D DIXON scan of a healthy subject(A), Graves' orbitopathy (B) and myasthenia (C) patient. In (B) the local thickening in the muscle of the left eye of the Graves' patient (arrow) is clearly visible.
(D-I) show a sagittal reconstruction of the fat (DEF) and water (GHI) data from the same subjects. For all subjects the eye muscles, orbital fat and optic nerve can clearly be identified.
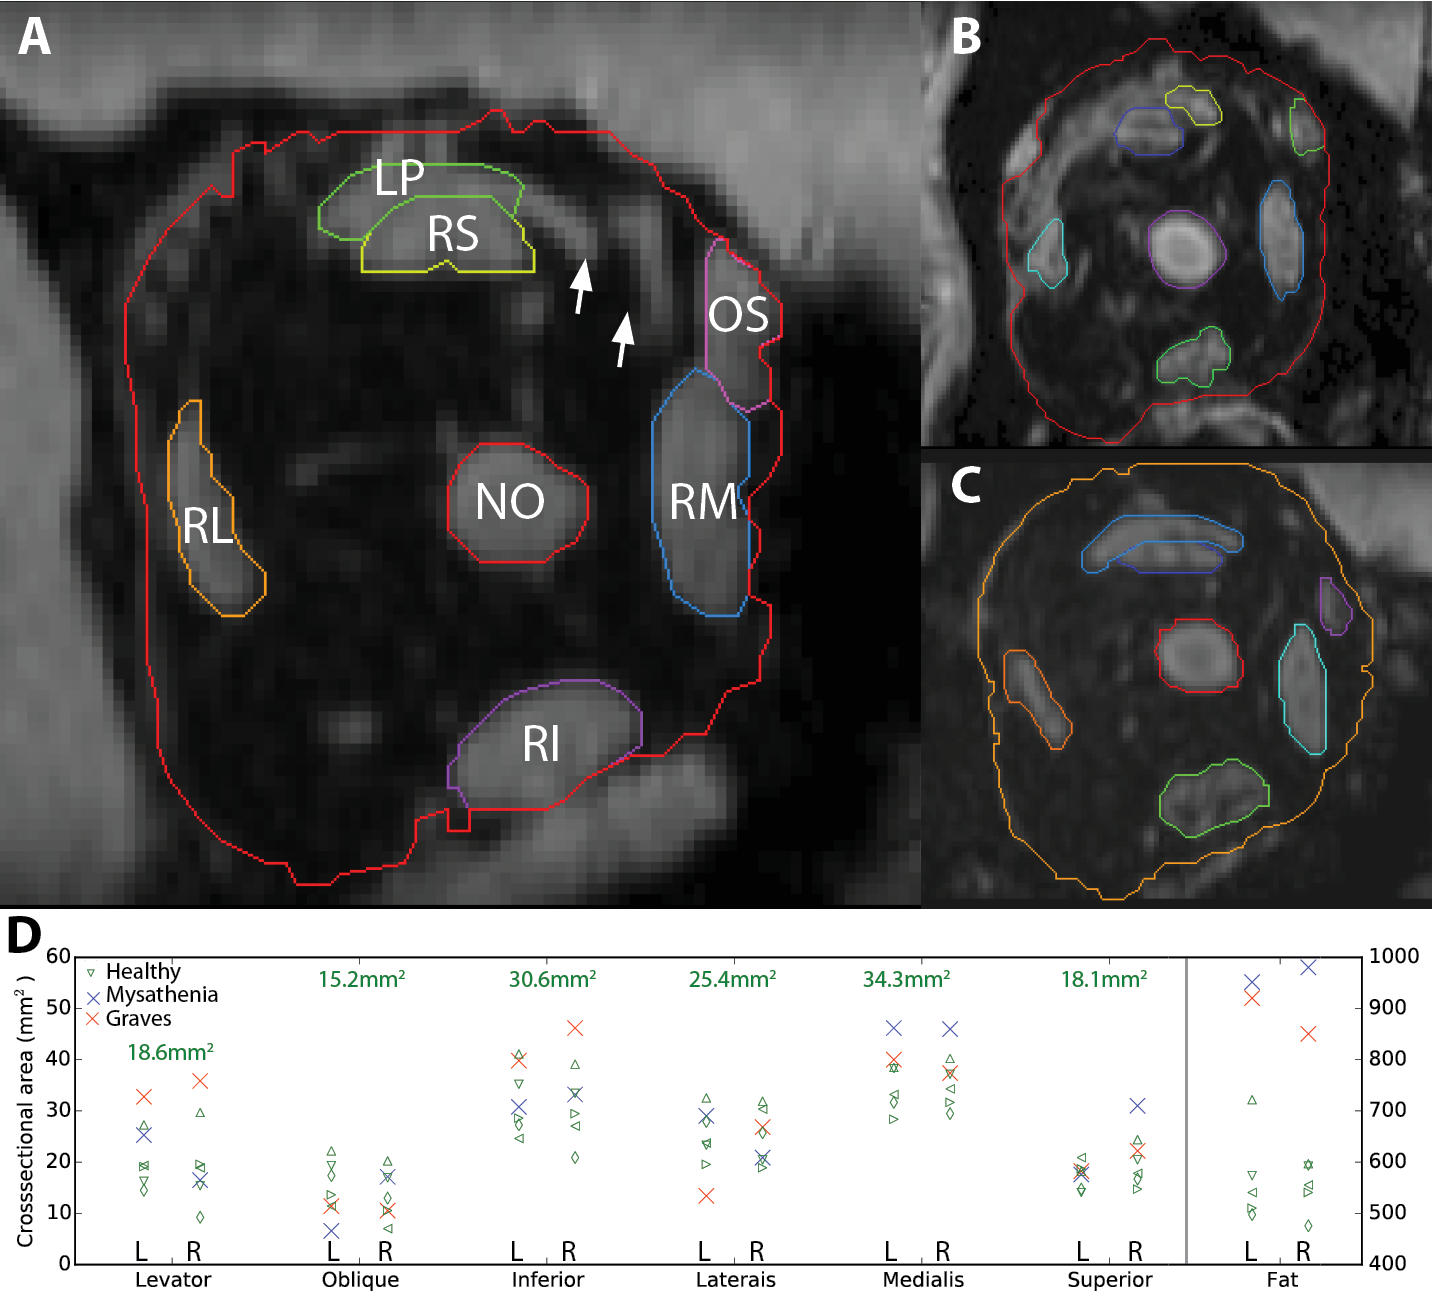
Figure 2: (ABC) ROIs to determine crosssectional areas of the muscles (LP:levator palpebrae, RS:rectus superior, OS:oblique superior, RM:rectus medialis, RI:rectus inferior, RL:rectus lateralis), NO:nervus opticus and orbital fat, for a healthy (A), Graves' orbitopathy (B) and mystastenia subject (C). The high resolution 7T scan enables the discrimination of small blood vessels (arrows in A), providing more accurate measurements.
(D) Cross sectional areas for the different muscles and orbital fat of all participants. The values indicate the average of all healthy subjects.
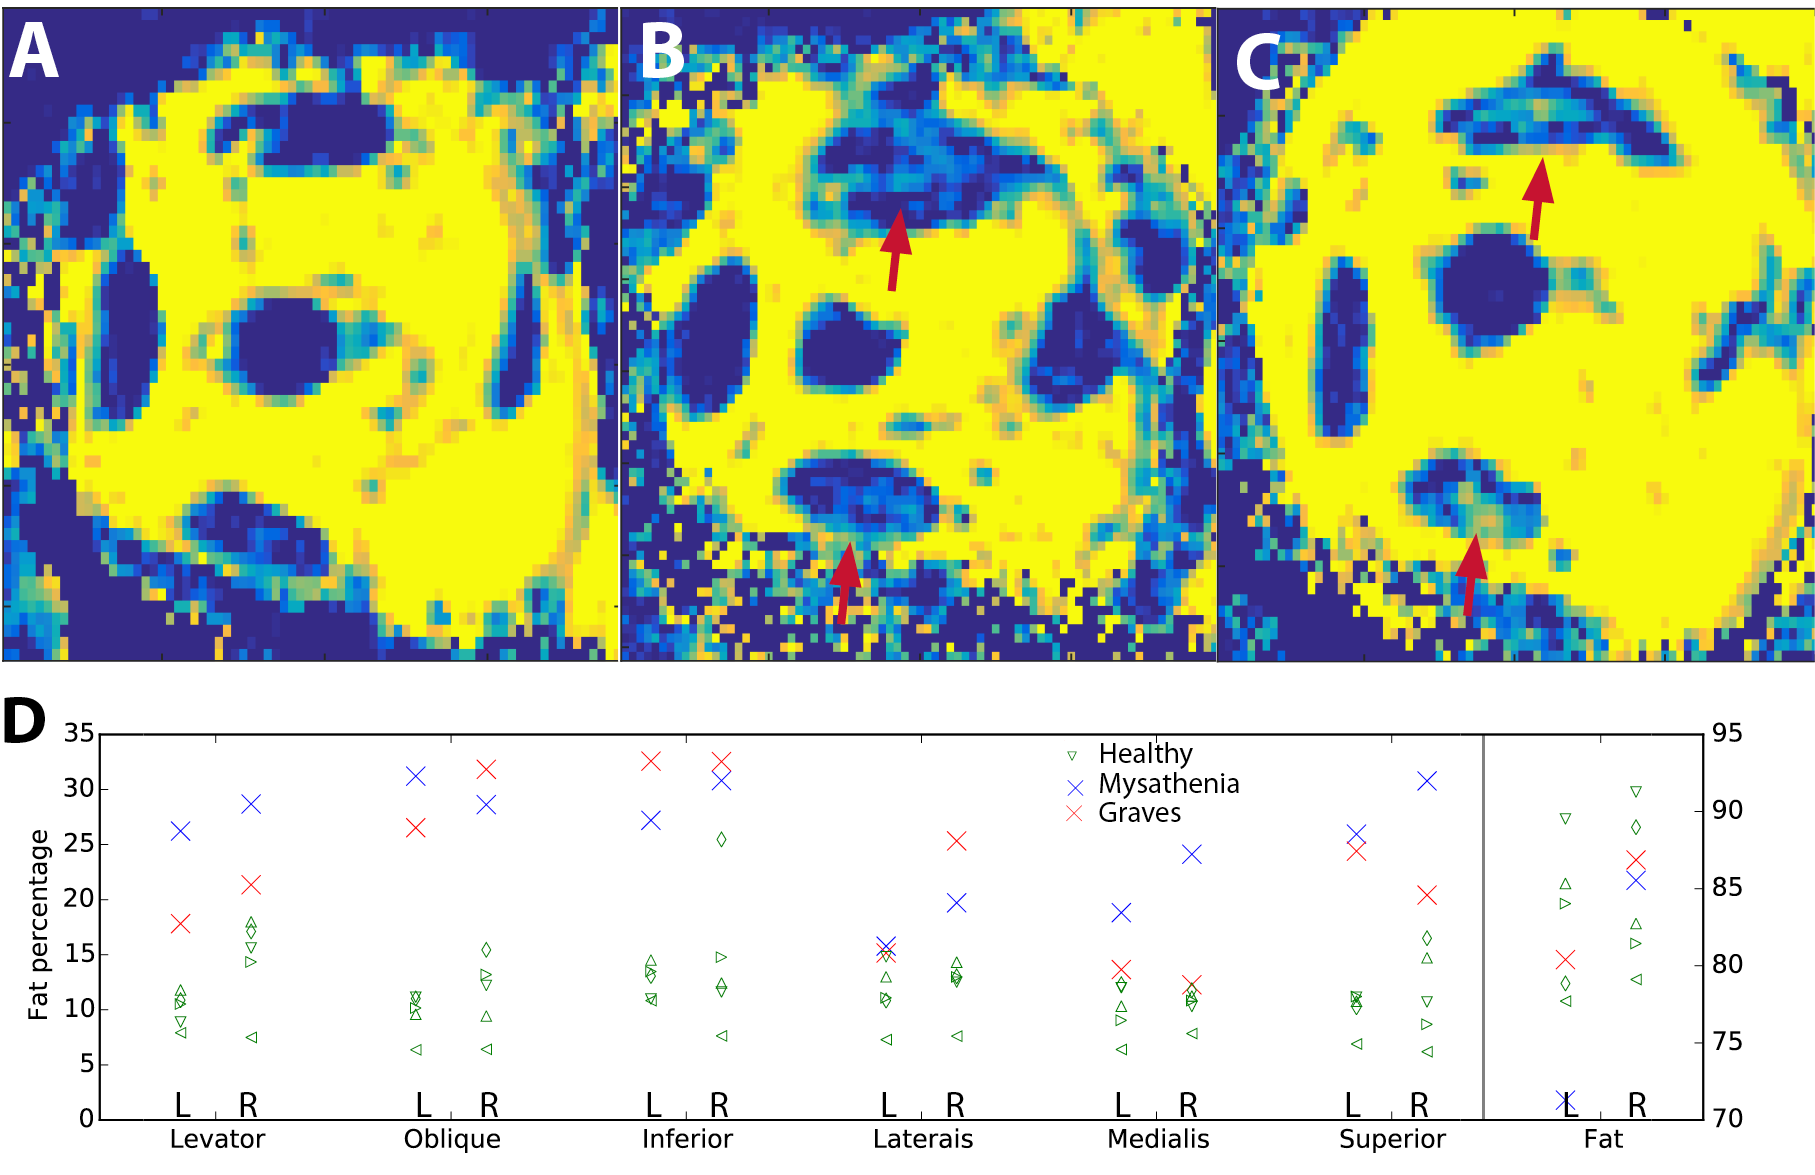
Figure 3: (ABC) Water/fat ratio maps for the right eye of a healthy subject (A), Graves' orbitopathy (B) and myasthenia (C) patient, showing elevated fat levels in the muscles of the patients (arrows).
(D) Fat percentages for the different muscles and the orbital fat, for the latter a representative area has been taken to exclude blood vessels from calculation. The fat of the Graves orbitopathy patient has an increased water content, suggesting an inflamed tissue