4401
A form-fitted 1H/13C transceive coil array for MR spectroscopy in the human calf muscles at 7 T: initial results1Division MR Physics, Center für Medical Physics and Biomedical Engineering, Medical University of Vienna, Vienna, Austria, 2High-Field MR Center, Department of Biomedical Imaging and Image-Guided Therapy, Medical University of Vienna, Vienna, Austria, 3Christian Doppler Laboratory for Clinical Molecular MR Imaging, Medical University of Vienna, Vienna, Austria, 4Division of Endocrinology and Metabolism, Medical University of Vienna, Vienna, Austria
Synopsis
Carbon-13 (13C) MR spectroscopy (MRS) requires RF coils enabling acquisition at two different Larmor frequencies, namely at the 1H frequency (f1H=297.2 MHz) for scout imaging, B0 shimming and proton decoupling, as well as at the 13C frequency (f13C=74.7 MHz) for acquisition of the carbon spectra at 7T. In this work we present preliminary data on the development of a dual tuned 13C/1H coil array for calf muscle studies at 7 T, including simulation, bench and MR measurements in a glucose phantom.
Purpose
Carbon-13 (13C) MR spectroscopy (MRS) requires RF coils enabling acquisition at two different Larmor frequencies, namely at the 1H frequency (f1H=297.2 MHz) for scout imaging and B0 shimming and the 13C frequency (f13C=74.7 MHz) for the acquisition of the carbon spectra. Since the MR sensitivity of 13C is inherently low, higher field strengths and/or coil arrays instead of single loop coil or large volume coils can be used to increase SNR. 13C spectra can be additionally improved by proton decoupling, which requires transmission at the 1H frequency during 13C reception. Therefore, 13C spectroscopy experiments at 7T demand optimized coil arrays, operating at both frequencies of interest, with sufficient isolation between the two frequencies to enable 1H decoupling (1). Here we present preliminary data on the development of a 4+3 channel 1H+13C transceive array conformed to the human calf at 7T.Methods
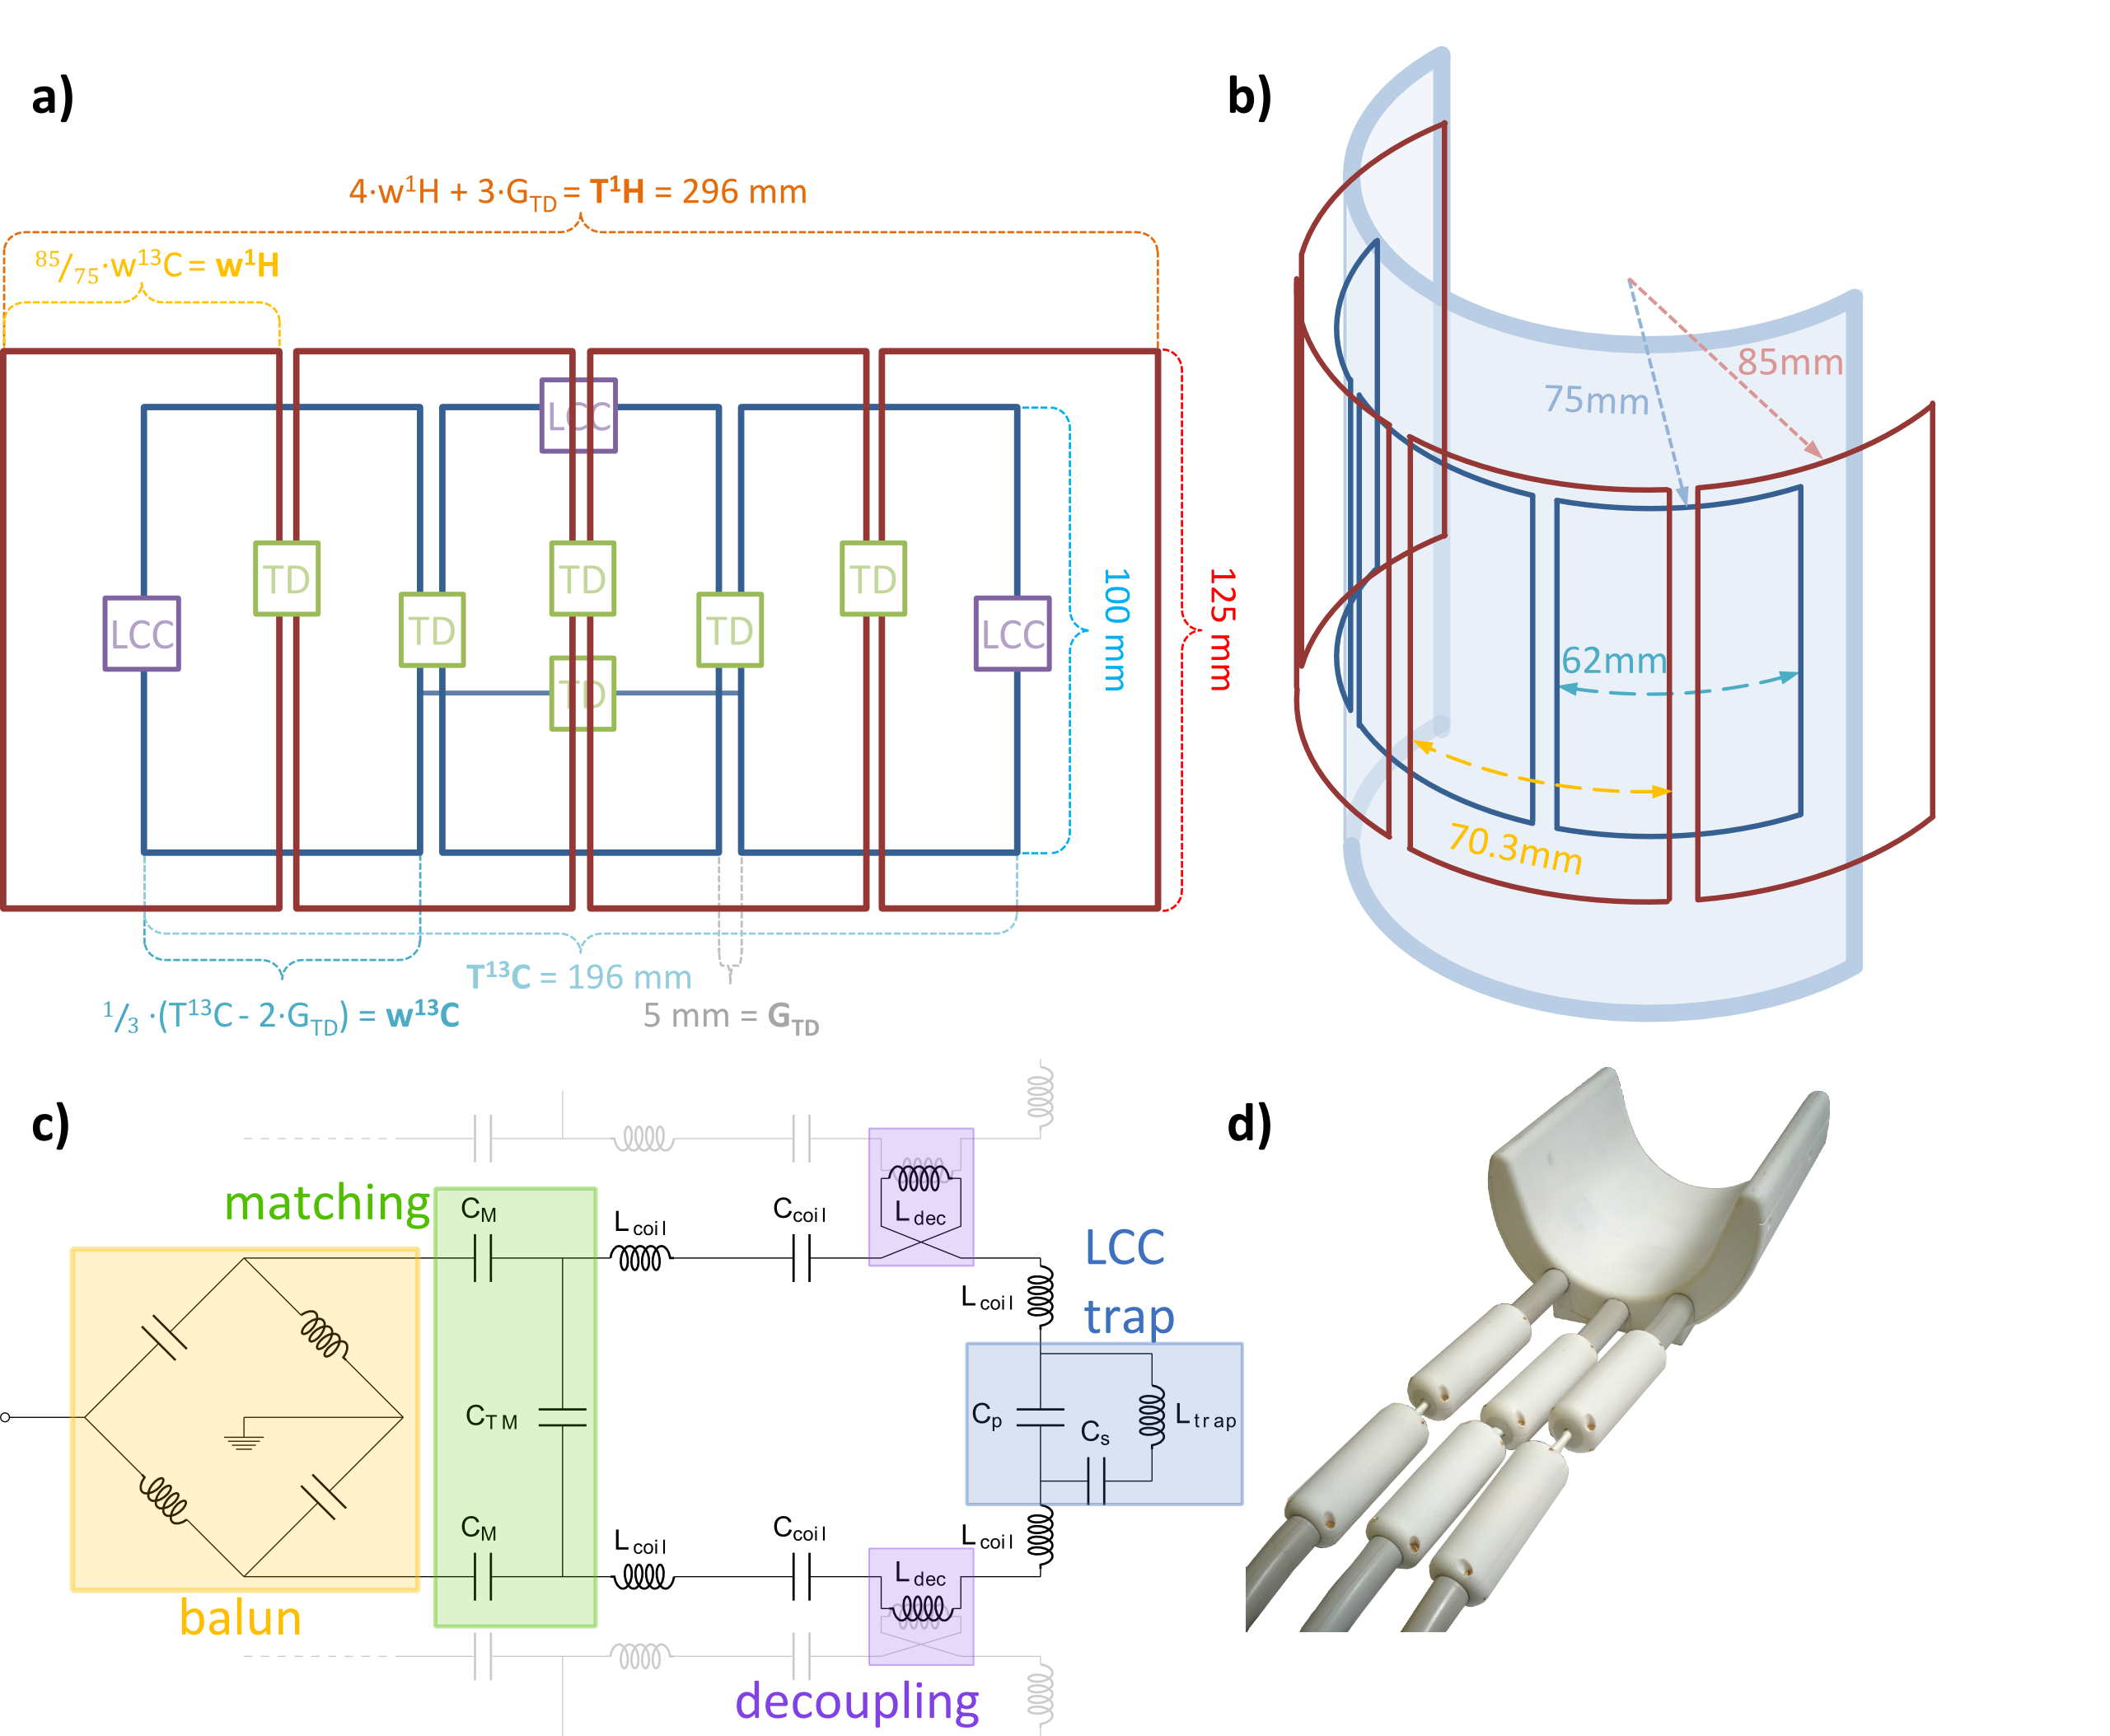
Coil Design: The coil array was designed as to yield good coverage of the average human calf and sufficient penetration depth into the muscle. Element sizes were 70.3x125 mm2 and 62x100 mm2 for the 1H and 13C array, respectively (see Fig. 1a-b). Nearest neighbors were decoupled by transformer decoupling (TD), i.e. using counter-wound inductors in series with the coil elements. In the 13C array additional TD was inserted between elements 1 and 3. To ensure minimal cross-coupling between 13C and 1H coils at the proton frequency, the arrays were shifted by a half coil width with respect to each other, and LCC traps (2) were inserted into the 13C array (see Fig. 1c). Common mode currents on cables were minimized using double tuned cable traps on each cable. T/R-switches and Wilkinson power dividers were built for each array, low-pass 13C and band-pass 1H filters were incorporated for efficient proton decoupling. A housing CAD model was designed to ensure reproducible patient positioning and comfort (see Fig. 1d).
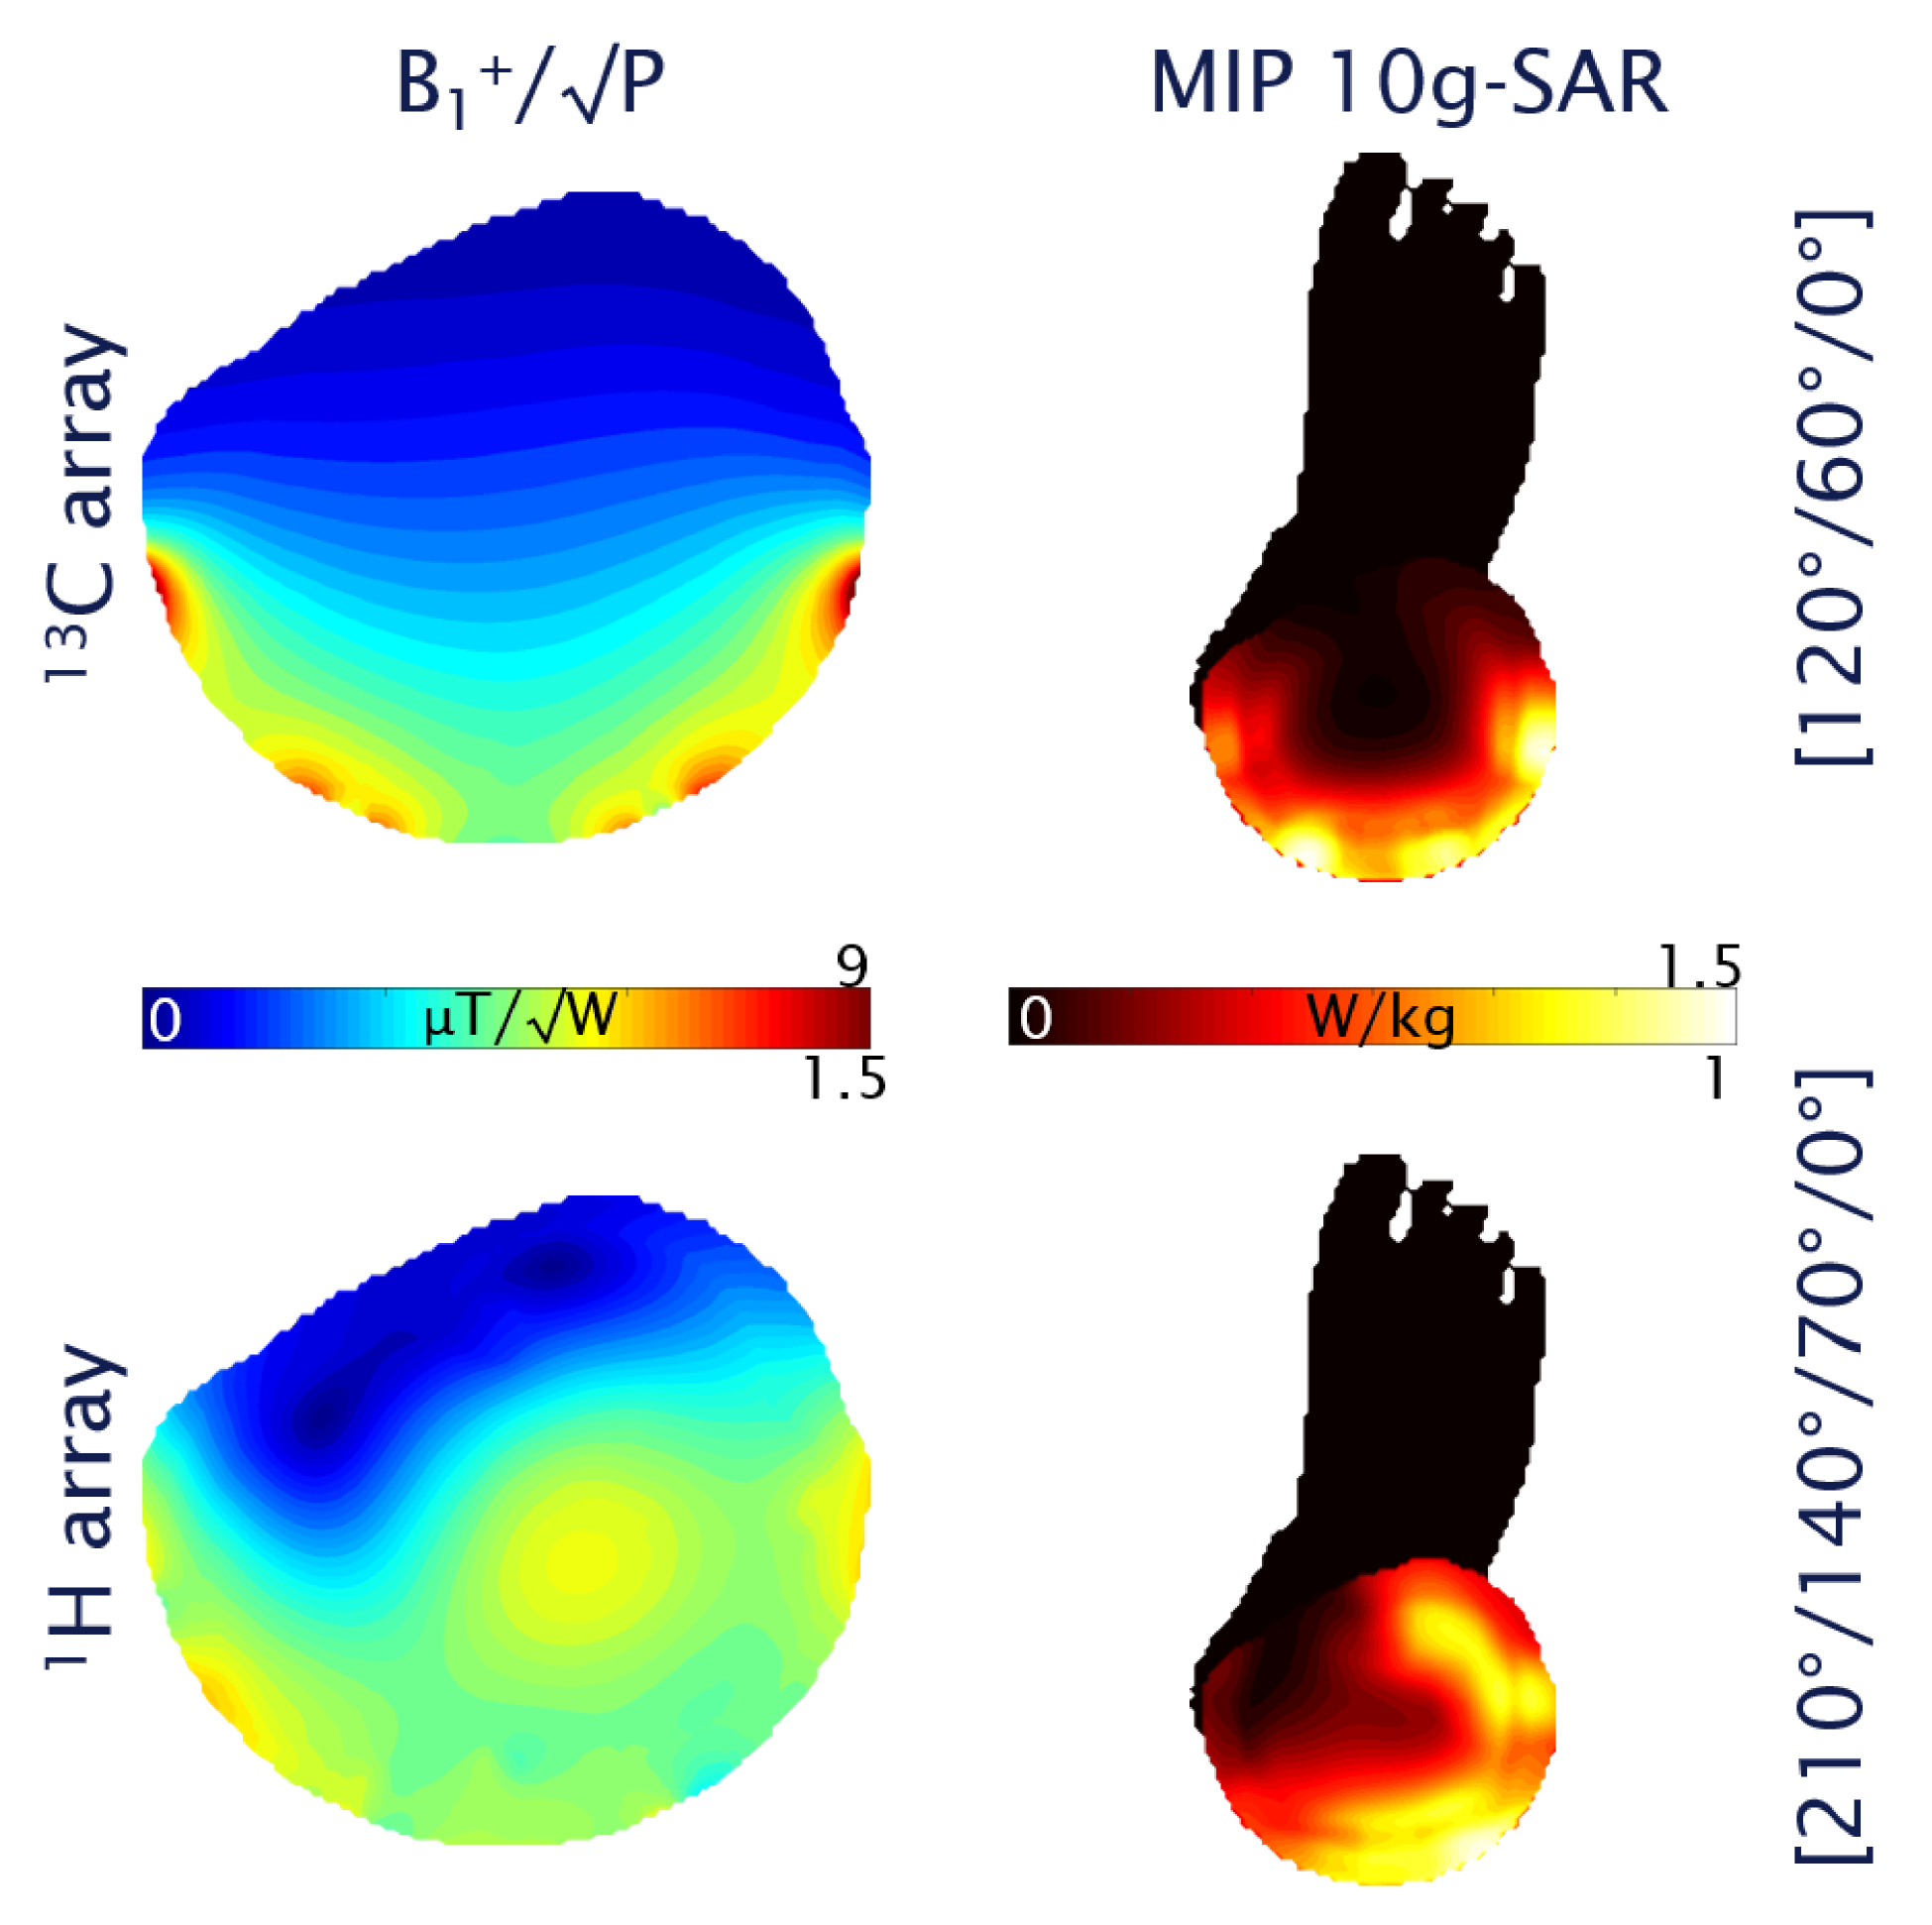
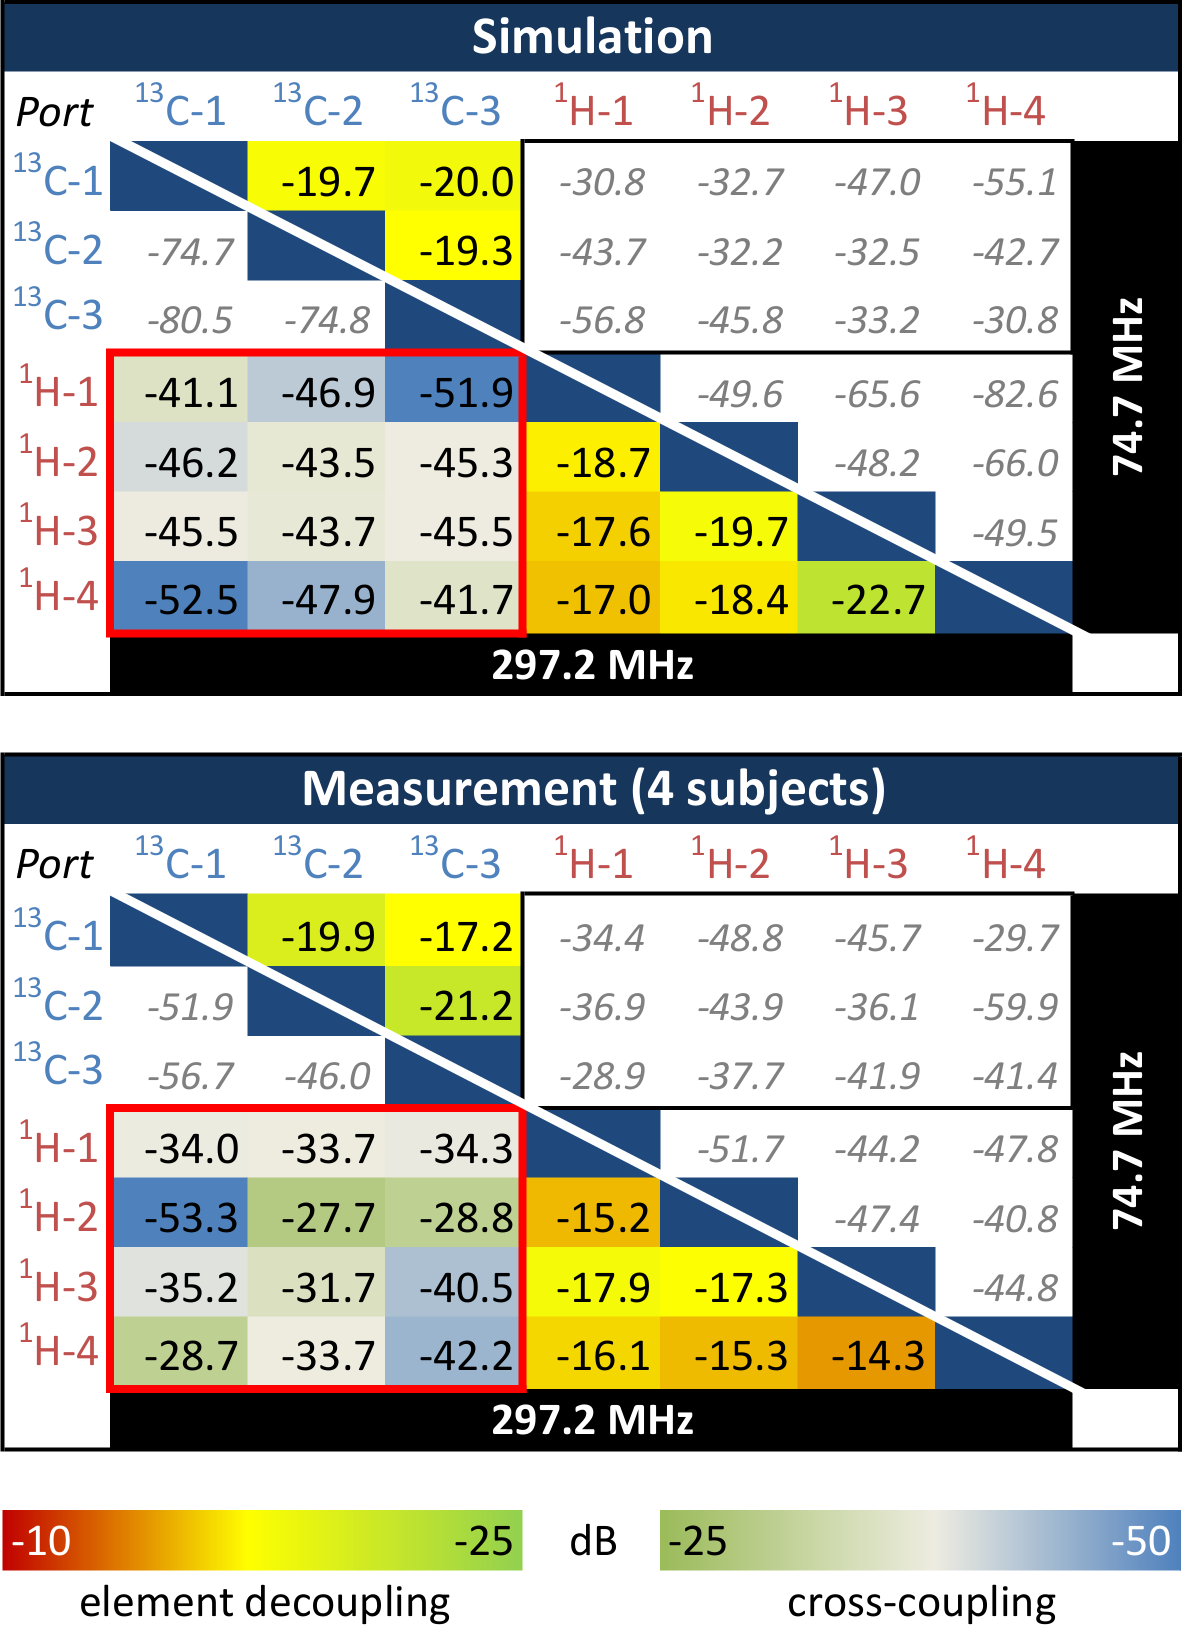
Simulation & Bench: 3D electromagnetic simulation was used to determine the optimal element size and geometry for the coil (3). Safety was evaluated by calculating the 10g averaged SAR in a phantom and in a realistic human calf model (Ella, Virtual Family, IT’IS Foundation, Zurich, Switzerland). Organ specific phase optimization was achieved via maximization of transmit efficiency (B1+/√P) as a function of phase offsets. The coil was built on a 3D-printed former made of from laser-sintered polylaurinlactam. A separate interface box contains power splitters, T/R switches, and filters, as well as cables of different length to achieve a static transmit phase shim according to the simulation results. S-parameters were measured using a network analyzer (Agilent E5061B) on 4 different loads (2 female, 2 male subjects).
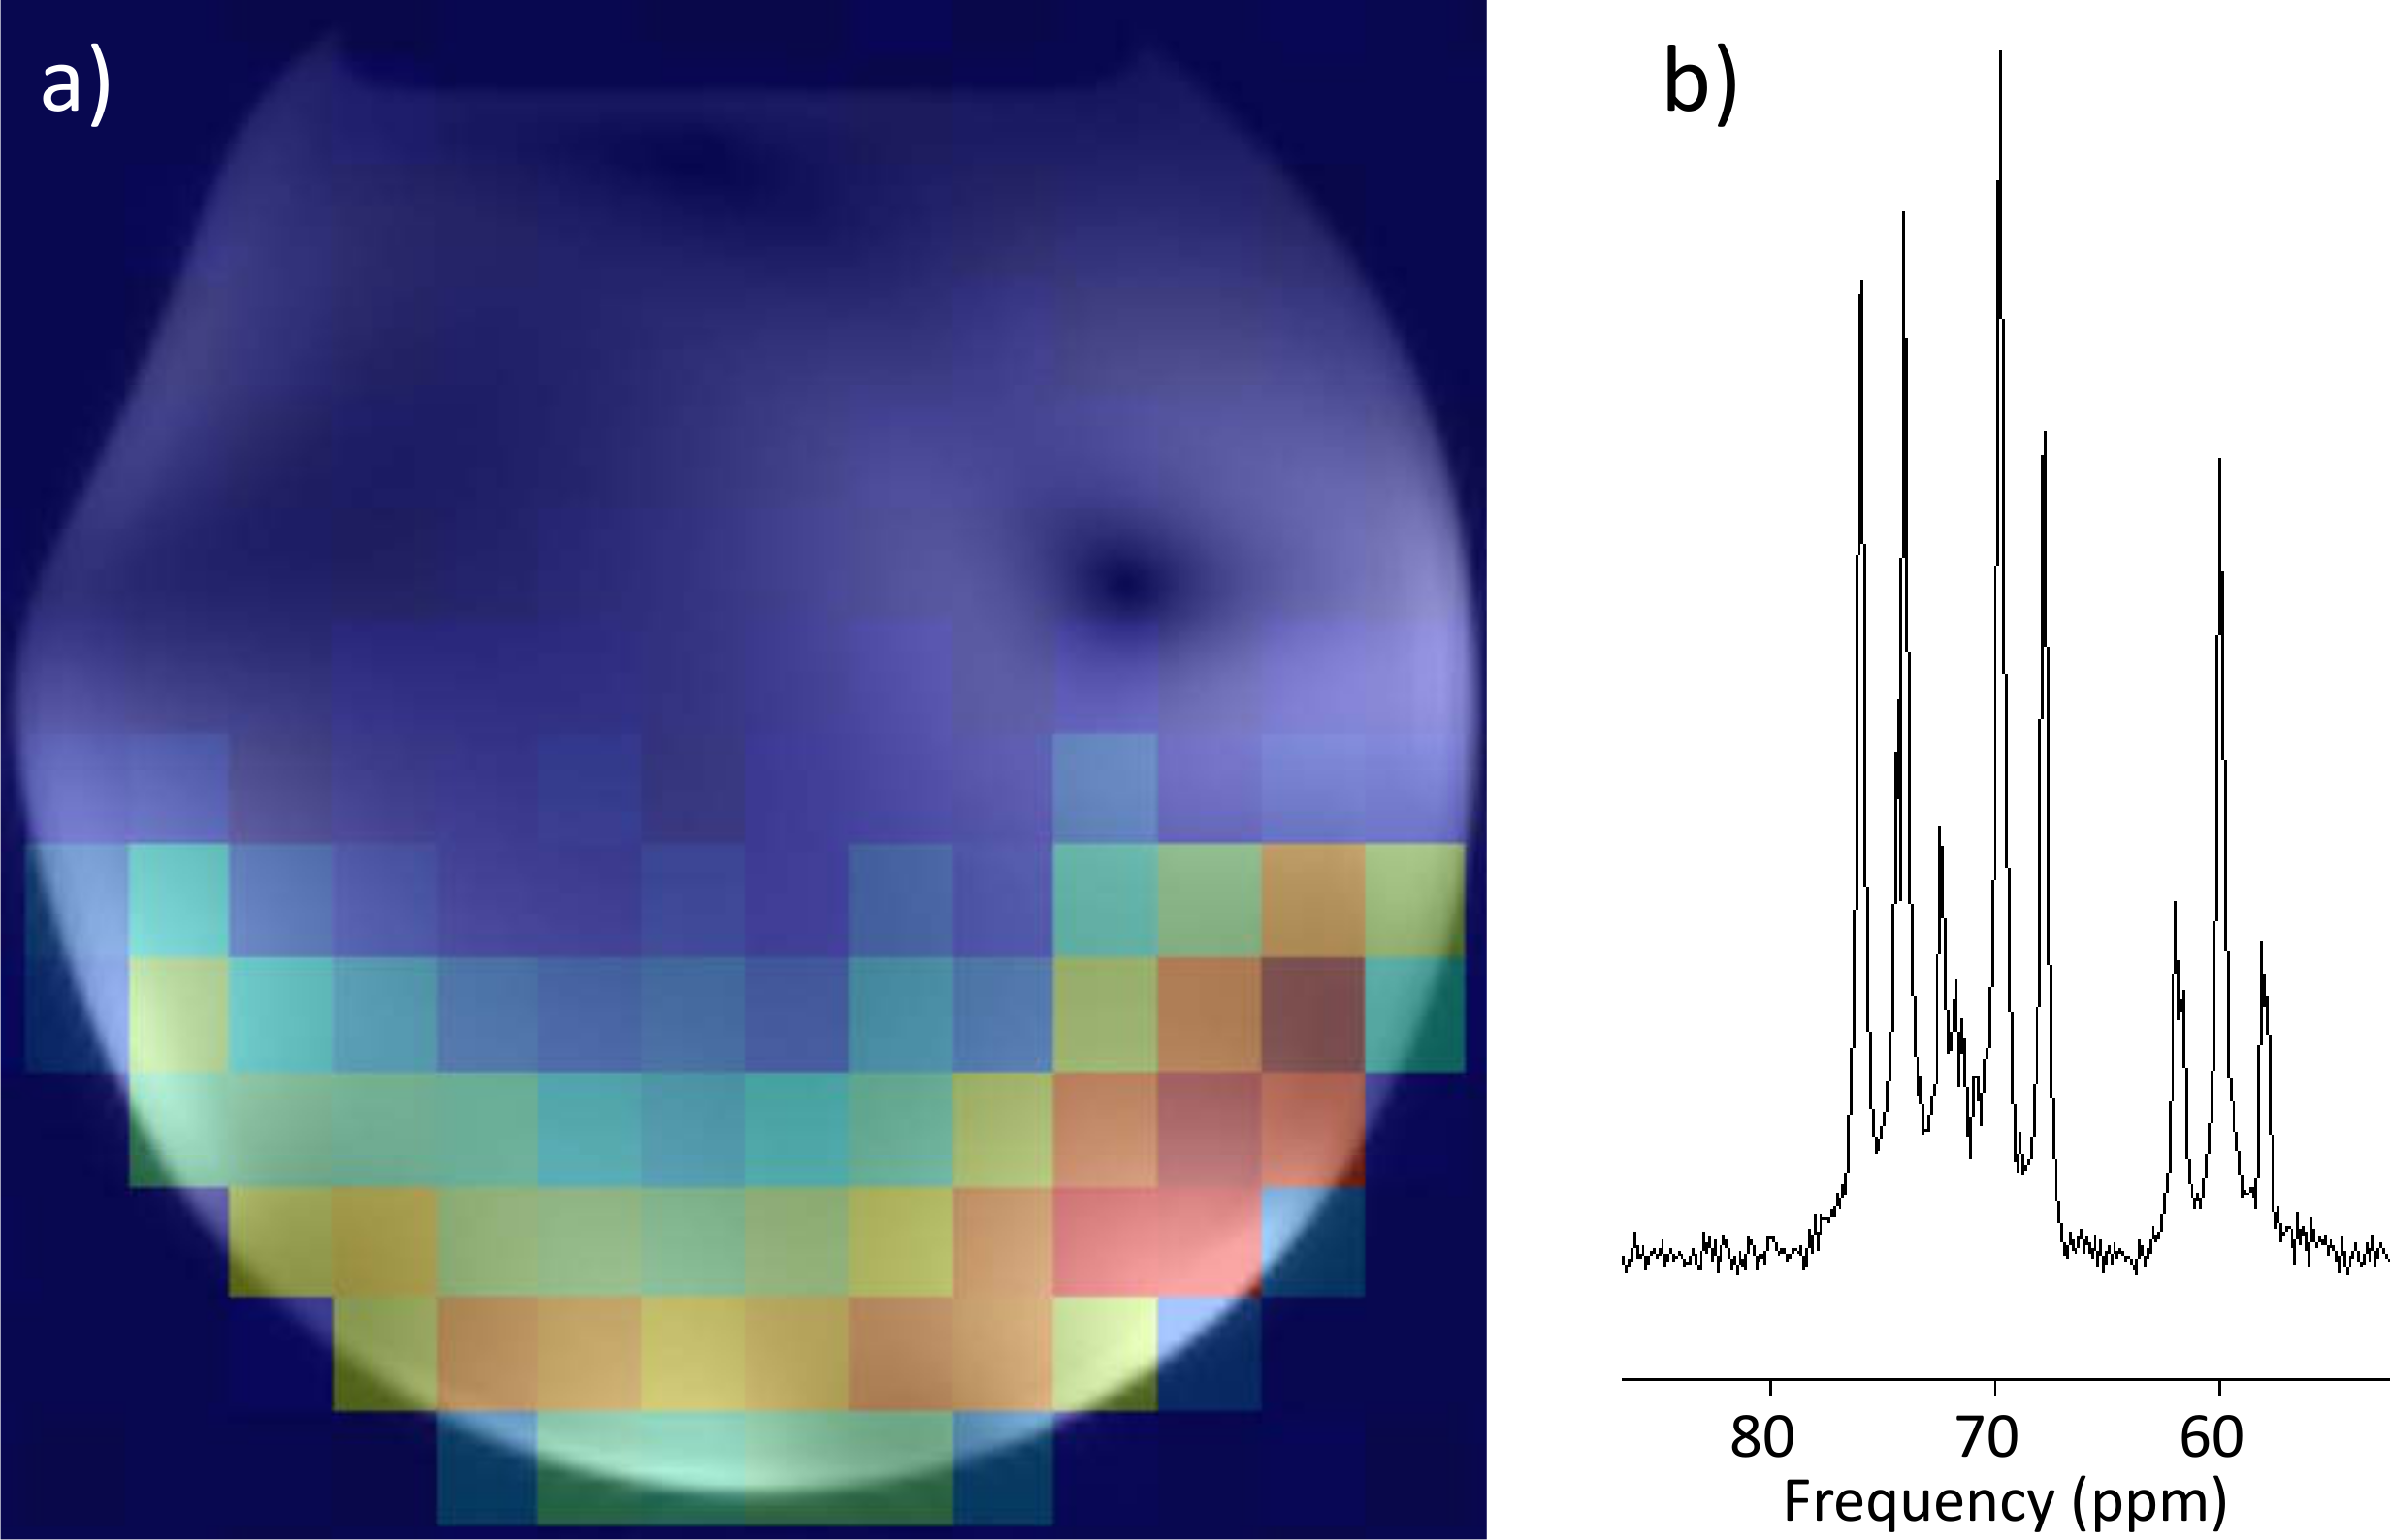
MR Measurements were conducted on a whole body MRI system (Magnetom 7 T MRI, Siemens Healthineers, Erlangen, Germany) equipped with an SC72d gradient coil (maximum gradient strength 70 mT/m, slew rate 200 T/m/s) while the coil loaded by a glucose phantom (20% glucose solution). A CSI map was acquired with the following parameters: rectangular RF pulse with duration of 500 µs, TE = 1.5 ms, TR = 2000 ms, NA = 4, FOV = 160x160x30 mm3, and Matrix size = 16x16x1.
Results
A comparison of simulated and measured S-parameters with human calf loading can be seen in Tab. 1. B1+ maps (through center slice) and 10g-averaged SAR MIPs for both arrays can be seen in Fig. 2. A CSI map of the combined C2-C5 glucose signal is depicted in Fig. 3a. An example spectrum from one voxel in the CSI matrix is depicted in Fig. 3b.
Discussion/Conclusion
In this work we present preliminary data on the development of a dual tuned 13C/1H coil array for calf muscle studies at 7 T. The maximum 10g-averaged SAR value is relatively low (1 and 1.5 W/kg per W of input power for 1H and 13C, respectively) and, therefore, SAR-demanding pulses like proton decoupling or adiabatic excitation for 13C should be feasible. Accordance between simulated and measured S-parameters is high, leading to the conclusion that efficient, decoupled 13C MRS will be possible in future measurements. First MR measurements prove functionality of both arrays.Acknowledgements
This project was funded by the Anniversary Fund of the Austrian National Bank (P 15363) and Austrian FWF grant (P 28059).References
(1) Roig et al.
MRM, 2015; 73(2):894-900
(2) Meyerspeer et al. MRM, 2014;
72(2):584-90
(3) Goluch et al. ISMRM, 2016, abstract #2229
Figures