4395
Longitudinal assessment of tumor volume and apparent diffusion coefficient in patients on active surveillance: a good way of monitoring disease progression?1CRUK Imaging Centre, The Institute of Cancer Research, Surrey, United Kingdom, 2Academic Urology Unit, The Royal Marsden Hospital NHS Foundation Trust, Sutton, United Kingdom
Synopsis
Tumor growth on T2-W MRI in 151 men with low-risk prostate cancer managed by active surveillance was related to tumor apparent diffusion coefficient (ADC). Volume increases greater than the 95% upper Limits of Agreement of reproducibility (~60%, n=20) were seen in 52 (34.4%) men. ADC was more reproducible (~5% variability). Baseline ADC values did not differ between those with and without measurable growth (p=0.06) but change in ADC did (-6.8±12.3% for those with measurable growth vs. 0.23±10.1% for those without, p=0.0005). A 5.6% reduction in ADC with time indicated a measurable increase in tumor volume (specificity 77.0%, sensitivity 54.9%, AUC=0.67).
Introduction
MRI is increasingly being utilized to follow-up patients on active surveillance1 but images are not routinely used for providing longitudinal tumor volume measurements to monitor growth rate so that this quantitative metric of disease progression remains under exploited.2 The Apparent Diffusion Coefficient (ADC) in prostate cancer has been shown to correlate negatively with Gleason grade; lower values are observed in higher Gleason grade tumors.3 There is potential, therefore, for this biomarker to indicate tumor growth rate in patients on active surveillance but the relationship between tumor growth and ADC remains to be established.Aim
To measure the increase in tumor volume of the dominant intraprostatic lesion at 2 time points and determine the accuracy of baseline ADC and change in ADC for detecting measurable tumor growth.Methods
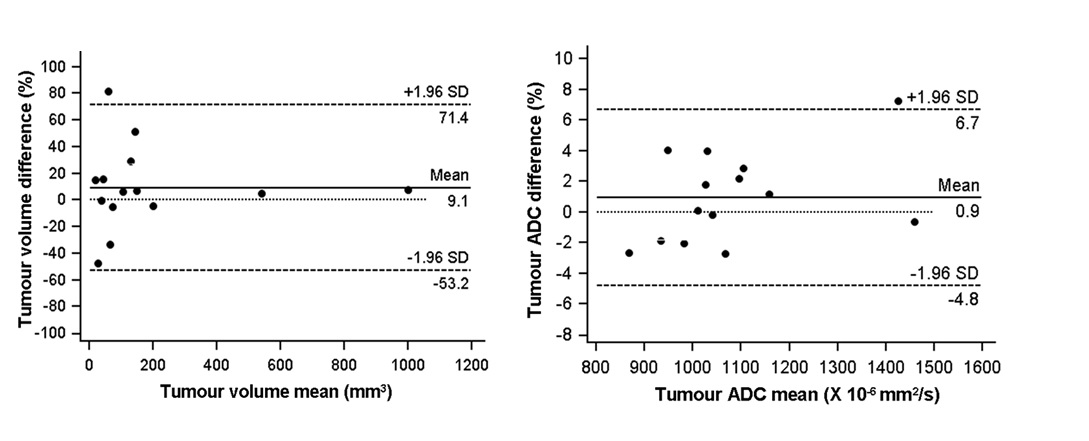
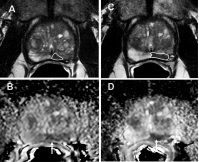
151 men on active surveillance aged 68.1+7.4 years had 3D whole prostate, zonal and tumor volumetry documented on endorectal MRI done on a 3T Achieva (Philips, The Netherlands) at 2 time-points (median interval 1.9 years). T2-W fast spin echo images were acquired in 3 orthogonal planes to the prostate, sagittal, axial and coronal. Following this, a diffusion-weighted sequence with 5 b values (0, 100, 300, 500, 800 s/mm2) was acquired in the axial plane. Slice thickness was 2.2 or 2.5 mm with 0.1 mm gap for all axial images depending on the coverage required. ADC maps were calculated using scanner software and a monoexponential fit to the data. Tumor volume (location confirmed at TRUS or template biopsy) was measured on T2-W axial images by drawing regions of interest (ROI) around a focal lesion of low-signal intensity that showed restricted diffusion. ROIs were drawn on all slices containing the lesion. Summed ROI area multiplied by slice thickness was used to derive tumour volume. Apparent diffusion coefficient (ADC) was measured on the slice with the largest ROI area. Twenty randomly selected cases had the measurements repeated by the same observer after a 5-month interval and limits of agreement (LoA) of measurements were calculated. Tumor volume increases >upper LoA were designated “measurable growth” (Fig 1); their baseline ADCs and change in ADC were compared with those without measurable growth (independent samples t-test).Results
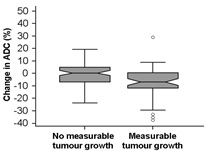
Fifty-two (34.4%) tumors increased measurably in volume (Fig 2). Tumor volume and baseline ADC were negatively correlated (r2=-0.42, p=0.001). Baseline ADC values did not differ between those with and without measurable growth (p=0.06) but change in ADC was significantly different (-6.8±12.3% for those with measurable growth vs. 0.23±10.1% for those without, p=0.0005). Percentage change in tumor volume and % change in ADC was negatively correlated (r2=-0.31, p=0.0001). A 5.6% reduction in ADC indicated a measurable increase in tumor volume with 54.9% sensitivity, 77.0% specificity (AUC=0.67).Discussion and Conclusion
Tumor volume in patients on active surveillance measured using 3D volumetry can vary by 60%; ~25% of men on active surveillance show a level of increase that is greater than this at 1 year. ADC may be used to identify patients with significant growth as it is a more reproducible measurement than volume with a ~5% variability. Using a 5.6% reduction in ADC with time would identify tumors that grow measurably with 77% specificity, although sensitivity is low at 54.9%.Acknowledgements
CRUK and EPSRC support to the Cancer Imaging Centre at ICR and RMH in association with MRC and Department of Health C1060/A10334, C1060/A16464 and NHS funding to the NIHR Biomedical Research Centre and the Clinical Research Facility in Imaging.References
1. Moore CM, Giganti F, Albertsen P, et al. European Urology. 2016. PMID:27349615.
2. Recabal P and Ehdaie B. Current opinion in Urology. 2015; 25: 504-509.
3. Barbieri S, et al. European Radiology. 2016. PMID:27567210.
Figures